


 texto en
  Inglés (pdf)
 Artículo en XML
 Referencias del artículo
 Enviar artículo por email
 Citado por SciELO
  Similares en
SciELO
Similares en
SciELO 
 Permalink
Highlights:
Water contamination and runoff were determined in micro-watersheds of the Copalita River.
Physicochemical characterization indicates water has a good quality, suitable for human use.
Chemical oxygen demand classifies water as contaminated, non-suitable for human consumption.
Runoff values indicate good conservation conditions of the sub deciduous forest.
Introduction
Intense extractive human activity and the excessive consumption of natural resources are a threat to the environment. Water, being a vitally important resource, merits special consideration (Audesirk, Audesirk, & Byers, 2013). According to the World Water Assessment Program (WWAP, 2019), starting in the 1980s, water use has increased 1 % each year globally. This trend is related to population growth, which has generated serious consequences due to intensive use of water for food production, which classifies it as a resource under anthropological pressure (Morales-Durán, Torre-González, García-Sánchez, & Chávez, 2018). Agriculture and livestock are the largest consumers of water with 69 % of annual withdrawals globally (WWAP, 2018).
Out of the approximately 1 449 471 million cubic meters of precipitated water that Mexico receives annually, only the water that runs off into rivers and that which infiltrates into the subsoil to maintain aquifer recharge can be used (Secretaría del Medio Ambiente y Recursos Naturales [SEMARNAT] & Comisión Nacional del Agua [CONAGUA], 2018a). This infiltration process reduces surface runoff and, consequently, water and soil loss. In contrast, vegetation cover removal can cause degradation, which is reflected in its infiltration capacity and soil permeability (González, Álvarez-Figueroa, González, & Aguirre-Mendoza, 2016).
One of the most serious problems faced by water bodies and streams is pollution caused by industrial and municipal wastewater, caused by excessive consumption of ecosystem goods and services (Haseena et al., 2017). For the adequate use of water in Mexico, SEMARNAT and CONAGUA (2015) established 37 hydrological regions constantly monitored to know the quality of the water. Depending on the water use, different qualities are accepted; their physicochemical characteristics are evaluated with parameters selected according to specific requirements (Basílico, De Cabo, & Faggil, 2015; Ritabrata, 2018).
The Copalita river basin belongs to hydrological region number 21 Costa de Oaxaca, made up of 19 micro-watersheds with a territorial extension of 10 514 km2 and a hydrological potential by normal annual precipitation of 951 mm (SEMARNAT & CONAGUA, 2018b). In the region, one of the main economic activities is shade-grown coffee production, which affects runoff water due to processing and agrochemicals used for maintenance. Wet-processed coffee causes problems due to the discharge of residues from pulp removal and from washing coffee beans in water bodies, modifying their physicochemical characteristics such as decreased pH and increased concentration of total solids and chemical oxygen demand (Rattan, Parande, Nagaraju, & Ghiwari, 2015). The objective of this study was to determine the level of contamination of seven water bodies, located in coffee farms, and to estimate surface water runoff in micro-watersheds of Pluma Hidalgo and Santa María Huatulco (Oaxaca, Mexico), given the lack of information for these variables.
Materials and Methods
Study area
This study was carried out in the municipalities of Pluma Hidalgo and Santa María Huatulco on the coast of Oaxaca, micro-watersheds belonging to the Copalita river basin complex, which covers 152 945 ha (Villalobos-Hiriart, Álvarez, Hernández, Lanza-Espino, & González-Mora, 2010). In addition to coffee production, other economic activities in the region include beekeeping, firewood extraction, and aquaculture. Provision of tourism services is relevant, which is supplied by water from these micro-watersheds given the demand for enormous quantities to satisfy recreational activities (García Alvarado, Díaz Zorrilla, Castañeda Hidalgo, Lozano Trejo, & Pérez León, 2017). The study area is dominated by the sub deciduous forest in an altitudinal range of 350 to 1 200 m. The dominant tree species are guanacaxtle (Enterolobium cyclocarpum Jacq. Griseb.), red cedar (Cedrela mexicana L.), palo mulato (Bursera simaruba L.), huanchal (Cupania dentata L.) and palo de mujer (Alchornea latifolia Sw.) (Pennington & Sarukhán, 2005; Rzedowski, 2006). Because these species are considered fine woods, the extraction of these species is already notorious in some abandoned farms, and coffee growers tend to clear the land, leaving one or two species to shade the coffee. During the period of 2000-2011, there was a change in the vegetation cover of the region's forests, which were converted into areas for human use (Leija-Loredo, Reyes-Hernández, Reyes-Pérez, Flores-Flores, & Sahagún-Sánchez, 2016).
Site sampling and selection
Water samples were collected from seven water bodies belonging to five coffee farms: El Brasil, Vista Hermosa and Chacalapilla in the municipality of Pluma Hidalgo (15° 55´ 16” a 15° 53´ 38” N, and 96° 26´ 51” a 96° 28´ 33” W, 350 to 744 m); and El Nueve and Miramar in the municipality of Santa María Huatulco (15° 55´ 54” to 15° 54´ 28” N, and 96° 17´ 8” to 96° 15´ 52” W, 642 to 1 275 m) (Figure 1).
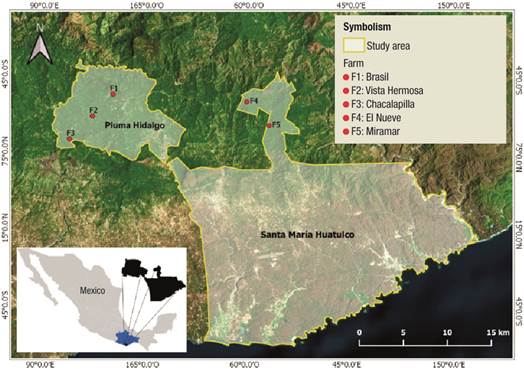
Figure 1 Location of sampled sites in the municipalities of Pluma Hidalgo and Santa María Huatulco in the coast of Oaxaca, Mexico.
Samples were collected in September and November 2019. Plastic containers of 600 mL were used for this purpose, following the indications of NOM-230-SSA1-2002 (Secretaría de Salud, 2002) for collection and transfer. Three samples were collected from seven supply sites: the Chacalapilla river and spring, the Vista Hermosa dam and catchment tank, El Nueve natural pond, Juquilita from El Brasil micro-watershed, and Miramar waterfall.
Physicochemical parameters
Water analyses were performed at the Soil Laboratory of CIIDIR Oaxaca. The following parameters were measured: pH, total dissolved solids (TDS, mg∙L-1) and electrical conductivity (EC, μS∙cm-1) measured with a potentiometer (Hanna Hi98130); total hardness (CaCO3, mg∙L-1) EDTA titration according to NMX-AA-072-SCFI-2001 (Secretaría de Economía, 2001), chlorides (Cl-, mg∙L-1) by Mohr's method according to NMX-AA-073-SCFI-2001 (Secretaría de Economía, 2001), total solids (TS, mg∙L-1) using the gravimetry method following NMX-AA-034-SCFI-2015 (Secretaría de Economía, 2015) and chemical oxygen demand (COD, mg∙L-1) using the open reflux method with titration, according to NMX-AA-030-1-SCFI-2012 (Secretaría de Economía, 2012). Data were analyzed using a nonparametric linear model, using sample origin as the classificatory variable; an ANOVA was carried out using the Kruskal-Wallis test and separation of means using the Duncan's multiple range test (P ≤ 0.05). Hierarchical clustering analysis was carried out with the minimum distance or maximum similarity strategy (Andritsos, 2002), using the simple average values of the physicochemical variables of the water and general conditions of sites. The analyses were performed with the SAS 9.4 program (SAS Institute, 2015).
Estimation of runoff coefficients
Tables with mean values of runoff coefficients of Raws and Prevert (Galindo-Castillo et al., 2010) were used, which were generated by empirical equations that include land use, slope and soil texture as elements for the calculation. Maps were developed with the QGIS 3.8 program (QGIS Development Team, 2019); land use and vegetation were taken from the vector layers of the Instituto Nacional de Estadística y Geografía (INEGI, 2016) and the Mexican Elevation Continuum (CEM ver. 3.0) that represents elevations of the Mexican continental territory. The vector layer of municipalities of Oaxaca, geostatistical framework (INEGI, 2019) was also used. These calculations were performed at the Geographic Information and Remote Sensing Laboratory of CIIDIR Oaxaca.
Results
According to Table 1, the ANOVA indicates highly significant differences (P ≤ 0.01) in the parameters pH, TDS, EC, TH and Cl- between supply sites. Table 2 contains the results of the physicochemical parameters evaluated in the water bodies. The pH of the water analyzed averaged 7.8, a value classified as alkaline. The natural pond of El Nueve farm had the lowest pH (6.0), classified as slightly acidic water, while the water of the Chacalapilla River had the highest value (8.4), classified as alkaline water. TDS were higher for the Chacalapilla spring water, just like the EC value. The lowest values of both parameters were recorded in the water from the Vista Hermosa catchment tank. The overall average of CaCO3 in water bodies analyzed was 48 mg∙L-1, which qualifies them as water without hardness. According to Romero-Rojas (2000) classification, water bodies with 75 to 150 mg CaCO3∙L-1 are considered moderately hard; only the water from the spring had such a qualification. The catchment tank had the highest Cl- content, while the river water had the lowest concentration. TS content recorded a significant difference between water sources (P < 0.05); values of parameter ranged from 100 mg∙L-1 (Vista Hermosa tank) to 173 mg∙L-1 (Miramar waterfall). Of the parameters analyzed, COD resulted with values classified as undesirable, since according to the ranges (40 to 200 mg∙L-1) established by SEMARNAT (2015), all water bodies fell in the contaminated water category. Water from El Nueve natural pond had the highest value, while the Brasil micro-watershed had the lowest value (Table 2).
Table 1 Overview of ANOVA of parameters evaluated in water samples from seven water bodies located in coffee farms in the Copalita river basin in the coast of Oaxaca, Mexico.
| Parameter | Mean squares and significance | ||
|---|---|---|---|
| Sites | Error | CV (%) | |
| pH | 112.44** | 6.2 | 22.6 |
| Total dissolved solids | 125.11** | 0.63 | 7.2 |
| Electrical conductivity | 119.66** | 3.1 | 16 |
| Total hardness (CaCO3) | 115.55** | 5.19 | 20.7 |
| Total solids | 52.11ns | 28.98 | 48.9 |
| Chlorides | 98.16** | 12.42 | 32 |
| Chemical oxygen demand | 78.94* | 18.77 | 39.3 |
Kruskal-Wallis test (α = 0.05). ns = non-significant values (P > 0.05); ** values with highly significant effects (P ≤ 0.01).
Table 2 Parameters measured in water bodies located in coffee farms in the Copalita river basin in the coast of Oaxaca, Mexico.
| Parameter | El Brasil | Chacalapilla | Vista Hermosa | El Nueve | Miramar | ||
|---|---|---|---|---|---|---|---|
| Micro-watershed | River | Spring | Dam | Tank | Natural pond | Waterfall | |
| pH | 8.3 ± 0.2 a | 8.4 ± 0 a | 8.1 ± 0 a | 8.2 ± 0.2 a | 7.3 ± 0 c | 6.0 ± 0 d | 7.7 ± 0 b |
| TDS (mg∙L-1) | 73.6 ± 1.6 c | 71.0 ± 0.5 d | 119.0 ± 0 a | 65.3 ± 0.6 e | 49.0 ± 0 g | 54.0 ± 0 f | 103.0 ± 0 b |
| EC (µS∙cm-1) | 178.3 ± 9.6 b | 142.0 ± 6.3 c | 232.0 ± 0 a | 142.3 ± 10.0 c | 96.0 ± 0 e | 121.0 ± 0 d | 170.0 ± 0 b |
| TH (mg CaCO3∙L-1) | 46.6 ± 0.6 c | 36.6 ± 1.7 d | 85.0 ± 2.4 a | 36.0 ± 1.1 c | 34.6 ± 5.6 d | 23.0 ± 0.6 e | 73.3 ± 0.6 b |
| TS (mg∙L-1) | 140.0 ± 20 ab | 120.0 ± 0 b | 133.0 ± 17 ab | 120.0 ± 11.0 b | 100.0 ± 23.0 b | 126.6 ± 6.6 ab | 173.3 ± 6.6 a |
| Cl- (mg∙L-1) | 28.2 ± 10.9 b | 8.2 ± 1.6 c | 28.1 ± 1.6 b | 38.0 ± 1.6 b | 55.4 ± 2.1 a | 33.0 ± 5.9 b | 21.5 ± 3.3 bc |
| COD (mg∙L-1) | 53.3 ± 13.0 c | 86.7 ± 25.0 bc | 66.7 ± 11.5 c | 86.7 ± 5.7 bc | 146.0 ± 23.0 ab | 173.0 ± 13.0 a | 93.3 ± 26.0 bc |
| CR | 0.726 | 0.213 | 0.218 | 0.226 | 0.218 | 0.255 | 0.215 |
| CP | 0.535 | 0.306 | 0.316 | 0.277 | 0.262 | 0.324 | 0.258 |
TDS = Total dissolved solids, EC = Electrical conductivity, TH = Total hardness, TS = Total solids, Cl- = chlorides, COD= Chemical oxygen demand, C = Raws (R) and Prevert (P) runoff coefficient. Mean values (± standard deviation) with the same letter show no significant statistical differences between water bodies (Duncan, P = 0.05).
Classification of aquifers studied
Figure 2 shows clustering of aquifer bodies studied, using all physicochemical parameters. Analysis shows formation of two groups at a distance of ±130; formation of three groups with one, four and two aquifer bodies, respectively, is defined at a distance of ±100. The Chacalapilla spring is the only water source with subway origin, which is why its physicochemical characteristics differ from the rest, which are formed by surface water runoff. The two remaining groups of springs do not have a close geographic association; they are grouped based on the value of their physicochemical characteristics.

Figure 2 Clustering of seven water supply sources according to their physicochemical characteristics in the coast of Oaxaca, Mexico. Nue_E = El Nueve pond; VH_T and VH_R = Vista Hermosa tank and dam; Mm_C = Miramar waterfall; Bra_Mi = Brasil micro-watershed; Ch_R and Ch_M = Chacalapilla river and spring.
Runoff coefficient
Runoff coefficient calculation by the Raws method shows that areas with higher vegetation have less runoff. Areas covered by vegetation, at the points where most of the sampling was carried out, have the lowest values of runoff coefficient, which means that the greater volume of rainwater that runs off through a watershed filters through the soil to supply groundwater recharge; while higher areas report a high runoff coefficient due to reduction of vegetation cover (Table 2; Figure 3).
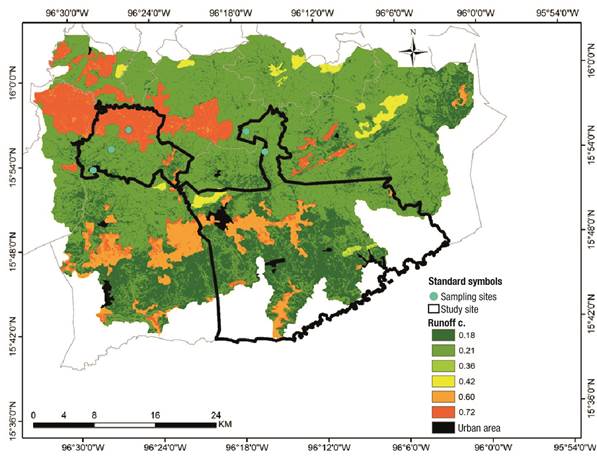
Figure 3 Runoff coefficient (Raws tables) of the Copalita river basin in the coast of Oaxaca, Mexico.
Results are similar using runoff coefficient calculation by the Prevert method, which includes soil type, as opposed to the Raws method that only includes slope and vegetation cover. The lowest values of the coefficient were recorded in areas with abundant vegetation, and the highest in places where soil has been left bare (Table 2; Figure 4).

Discussion
pH results (7.8 on average) are similar to those reported by Aly, Al-Omran, and Alharby (2014) in groundwater in an interval between 6.8 and 7.6. Also similar to those recorded by Sánchez, Álvarez, Pacheco, Carrillo, and González (2016), who indicated that water was moderately alkaline (6.7 to 8.2) in Quintana Roo aquifers. Bhat, Parveen, and Hassan (2018) determined pH from 7.03 to 7.71 for the Yamuna River in India. These authors indicated that high pH values may be due to the abundant presence of bicarbonates and calcium and magnesium carbonates from wastewater, mainly from urban runoff and industrial effluents.
TDS contents (<120 mg∙L-1) found in this study were lower than those reported by Gue, Mayer, and Grasby (2015), who determined values from 7 210 to 51 800 mg∙L-1 in spring waters from Athabasca, Alberta, Canada. Olorode, Bamigbola, and Ogba (2015) found TDS ranging from 91 to 7 931 mg∙L-1 in five rivers in the Niger Delta region of Nigeria for their dry season, while for the rainy season they reported 80 to 7 920 mg∙L-1.
Regarding EC, Solís-Castro, Zúñiga-Zúñiga, and Mora-Alvarado (2018) report 50 to 549 μS∙cm-1 for well water and 25 to 499 μS∙cm-1 for spring water; while Mayorga and Mayorga (2015) reported values of 50 to 100 μS∙cm-1 for river water and reservoir tanks from the Santa Rosa and La Hechicera sector in Mérida, Venezuela, values similar to those recorded in water bodies of this study. The latter authors take permissible ranges (50 to 100 μS∙cm-1) from Standard Methods, considering these water bodies suitable for use and consumption. Rubio-Arias, Contreras-Caraveo, Quintana, Saucedo-Teran, and Pinales-Munguia (2012) describe that high EC levels do not mean that water represents a health problem, it is only indicative of the concentration of dissolved ions.
Hardness values were similar to those found by Pérez-López (2016), who reported results between 40 to 121 mg∙L-1 of CaCO3 in drinking water samples from Poás and San Ramón, Costa Rica. Brousett-Minaya, Chambi-Rodríguez, Mollocondo-Turpo, Aguilar-Atamari, and Lujano-Laura (2018) reports hardness results from 92 to 135 mg∙L-1 CaCO3 in surface water and maximum values of 135.42 mg∙L-1 CaCO3 for spring. This value is higher than that recorded in the Chacalapilla spring, where the highest value (85.0 mg∙L-1 CaCO3) was found with respect to the water bodies evaluated. Such values may be because the water in these bodies contains rocks rich in carbonates and other minerals that upon detachment are incorporated into the water (Almazán-Juárez et al., 2016).
Alcivar-Bueno et al. (2017) studied water wells in the Guayas Province of Ecuador and found 1 000.25 mg∙L-1 total solids. The authors classified water as normal, according to the limit (1 000 mg∙L-1) established by the Environmental Quality and Effluent Discharge Standard of that country (Presidency of the Republic, 2001). In the present study, the values did not exceed 200 mg∙L-1, so water is considered of good quality. Rubio-Arias et al. (2014) assessed water samples from La Boquilla Dam, Chihuahua, by the titration method with AgNO3, and found a mean Cl- concentration of 6.35 mg∙L-1 with the highest level in December (10.37 mg∙L-1). Bharti, Giri, and Kumar (2017) analyzed water samples using the Mohr's method and reported Cl- concentrations of 26.9 to 29.9 mg∙L-1 for the river and 15.8 to 16.9 for the spring. These authors describe that the increase in Cl- content may indicate possible contamination by human sewage, manure, industrial wastes, or simply naturally by the effect of dragging caused by precipitation.
Rosabal-Carbonell, Chang-Huerta, Pérez-Aballe, and Morales-León (2012) analyzed clean and wastewater samples in the Granma, Cuba, and reported DOC values ranging from 21.26 mg∙L-1 for the Arroyan River to 22.72 mg∙L-1 for the Paso Malo reservoir, concentrations lower than those found in the present study. Dimas, Garza, and Treviño (2015) evaluated the water quality of the Aguas Blancas riverbed, Acapulco, Guerrero, following the methodology used in this study, and determined average DOC values of 7 to 28 mg∙L-1 and 14 to 26 mg∙L-1, for dry and rainy seasons, respectively.
Furthermore, Flores, Del Ángel, Frías, and Gómez (2018) indicate average values of 105 to 155 mg∙L-1 of DOC in Laguna de las Ilusiones, Villahermosa, Tabasco, using the closed reflux method, and classify water as contaminated according to Mexican standards. DOC values in the present study (53.3 to 173.0 mg∙L-1) could be related to municipal drains, runoff of agrochemicals used for fertilization and control of plant pests and diseases in coffee plantations, incorporation of animal waste thrown into water bodies, or just by the same decomposing organic matter such as leaf litter and waste from aquatic organisms. Vázquez, Aké-Castillo, and Favila (2011) and Gómez-Anaya, Novelo-Gutiérrez, and Astudillo-Aldana (2017) indicate that coffee plantations can have an impact on waters, making them more sensitive to disturbances and changes in their physicochemical characteristics. Kaur and Kaur (2015) state that high DOC can cause oxygen depletion, due to microbial decomposition and contamination by degradable organic wastes from various sources.
Cluster analysis groups sites into clusters of similar nature based on similarities and differences between sources and is useful for clustering sampling sites to save time and effort in future sampling (Khan, Gani, & Chakrapani, 2016). These similarities may prove useful if conservation programs for the area are ever intended in the future.
Soils of the upper and middle basin of the Copalita River have sandy loam and loam textures (Lozano-Trejo et al., 2020), which favors rainwater infiltration. Úbeda, Farguell, Francos, Outeiro, and Pacheco (2020) found promising results using rainfall simulators and report that areas devoid of vegetation had higher runoff (4 to 12 %) than more vegetated areas. Treviño Garza, Muñoz Robles, Cavazos Camacho, and Barajas Chávez (2002) calculated the runoff coefficient for the Sierra de San Carlos (Tamaulipas, Mexico), using Prevert tables, and found values of 0.63 for agricultural areas and 0.35 for forests; these coefficients are similar to those found in this study. González et al. (2016) affirm that indirect methods to generate runoff coefficient are based mainly on slope, soil and vegetation; in steep areas this coefficient is high. Similarly, they indicate that soil characteristics, such as infiltration capacity and permeability, influence the magnitude of surface runoff. Camarasa-Belmonte, Caballero López, and Iranzo García (2018) used cartography by geographic information systems (GIS) for mapping runoff thresholds in the province of Valencia, Spain; the authors conclude that changes in land use cause up to 100 % of rainfall to become runoff, preventing infiltration and water storage in soil and aquifers.
Conclusions
The parameters analyzed in water samples are within good quality standards, which indicates they are acceptable for human use. Chemical oxygen demand values, higher than the maximum value established by SEMARNAT, classify water as contaminated, which may be due to the presence of deposited and decomposing native organic matter and discharges from coffee processing. Water from Pluma Hidalgo and Santa María Huatulco, Oaxaca, is recommended for human use, but not for drinking. The runoff coefficient indicates the importance of conservation of vegetation cover and soil to maintain the existing aquifers. Raws and Prevert methods estimate similar values; areas with greater vegetation cover reported lower runoff coefficients.

