


 texto em
  Inglês (pdf)
 Artigo em XML
 Referências do artigo
 Enviar este artigo por email
 Citado por SciELO
  Similares em
SciELO
Similares em
SciELO 
 Permalink
Highlights:
- Phenol concentration was evaluated in extracts of leaves (without oil) and stems of Lippia graveolens.
- Extracts were obtained with aqueous ethanol (30, 50 and 80 %) and mass/volume ratios 1:10, 1:20 and 1:30.
- Leaves had higher concentrations of total phenols and antioxidants compared to stems.
- Phenolic compounds dissolved better in ethanol than in water (80 % and ratio 1:30).
- Naringenin, taxifolin, eriodictyol, caffeic acid and luteolin were identified.
Introduction
henols are a group of organic compounds with a wide distribution in the plant kingdom. These compounds are divided into phenolic acids, phenylpropanoids, xanthones, flavonoids, lignans, biflavonoids, lignins and tannins. Phenols have important biological, therapeutic and pharmaceutical characteristics, due to antioxidant properties (Caleja, Ribeiro, Barreiro, & Ferreira, 2017; Gutiérrez-Grijalva, Ambriz-Pérez, Leyva-López, Castillo-López, & Heredia, 2016).
Considering the diversity of phenolic compounds and plant sources they contain, there is no specific method for extraction, because the structure varies from simple to polymerized molecules (Del Rio et al., 2013). Extraction depends on the method used (maceration, Soxhlet, ultrasound or microwave), chemical nature of the compounds, polarity of solvent, particle size, among other parameters (Naczk & Shahidib, 2004). Acetone, ethyl acetate, methanol, ethanol, water, and mixtures of alcohols with water are used for extraction. Ethanol and ethanol-water mixtures are efficient, safe and low-toxicity solvents for food applications or for human consumption (Lim, Cabajar, Lobarbio, Taboada, & Lacks, 2019).
A wide variety of agro-industrial residues are an important source of phenolic compounds with antioxidant potential; some reports on residue valorization are those of grape seeds (Dang, Zhang, & Xiu, 2014), avocado (Rosero, Cruz, Osorio, & Hurtado, 2019) and pomegranate (Ambigaipalan, Costa de Camargo, & Shahidi, 2016) that may have application as nutraceutical ingredients with benefit to human health (Caleja et al., 2017).
Lippia graveolens Kunth and Lippia berlandieri Shauer are known as Mexican oregano. Leaves are used as a condiment in fresh and processed foods, as well as for obtaining essential oil, which is used in the production of cosmetics and pharmaceuticals (Martínez-Hernández, Villa-Castorena, Catalán-Valencia, & Inzunza-Ibarra, 2017). Lippia graveolens report phenolic compounds in leaf extracts with methanol/water and methanol (Gutiérrez-Grijalva et al., 2018; Lin, Sudarsan, Robbins, & Harnly, 2007; Pérez-Gutiérrez, 2014); in an extract of stems with hexane/ethyl acetate/methanol (González, Soto-Hernández, Kite, & Martínez-Vázquez, 2007); and for leaves without essential oil in which a process with supercritical carbon dioxide/ethanol was applied (Arias et al., 2020). The use of ethanol or mixtures with water for the extraction of phenolic compounds from the species has not been reported.
In Durango, Mexico, L. graveolens is located in 16 municipalities, including El Mezquital, Nazas, Cuencamé and Mapimí (Granados-Sánchez, Martínez-Salvador, López-Ríos, Borja-De la Rosa, & Rodríguez-Yam, 2013; López-Enríquez et al., 2011). In the municipality of Cuencamé, the Oro Verde del Semidesierto Cooperative was established, and its main economic activity is the collection of oregano leaves, although it also receives the complete plant material. Leaves are screened for cleaning and used both for bulk sale and for extracting essential oil using a supercritical carbon dioxide process without adding organic solvents. Residues generated in this cooperative is the remnant of leaves without the essential oil and stems, both are discarded because they have no apparent commercial value and cause disposal and accumulation problems.
The objective of this study was to evaluate the effect of extraction conditions of phenolic compounds on yield in solids, concentration of total phenols and flavonoids, as well as antioxidant capacity in oregano residues (leaves without oil and stems). The extraction was done using ethanol in three mixtures with water and three mass/volume ratios. The assessment was conducted with the purpose of evaluating residues and suggesting their applications.
Materials and Methods
Collection of plant material
The plant material was provided by the Oro Verde del Semidesierto Cooperative, located in Cuencamé, Durango. This cooperative collects oregano from L. graveolens from eight localities in the municipality. Sampling was carried out in August 2018. A total of two kg of leaves (remaining leaf material without oil) were collected with a particle size of 60 mesh and moisture content of 8.0 %, as well as 5 kg of stem with a particle size of 30 mesh and 8.5 % moisture. The material was stored in closed plastic bags and kept refrigerated at 4 °C until use.
Extract preparation
Extraction was performed with the maceration method and aqueous ethanol was used as solvent at concentrations of 30, 50 and 80 % (ET30, ET50, ET80, respectively). The mass:solvent ratios evaluated were 1:10, 1:20 and 1:30, for a total of nine extracts for each raw material. To perform the extraction, each treatment was macerated at room temperature (25 °C) with stirring for 24 h. After this time, the extract was separated by filtration with Whatman paper No. 4. The remaining material was subjected to a second extraction with fresh solvent under the same conditions as in the first stage. Extracts from the first and second maceration were combined and concentrated in a rotary evaporator at 45 °C under vacuum, from which a concentrated aqueous extract was obtained and dried by lyophilization.
Determination of phenolic compounds and antioxidant capacity
Yield in solids was evaluated by the total solids method and expressed as a percentage. Calculation corresponds to the quotient between the mass of crude extract (g) and the mass of material used (g), both on a dry basis.
Total phenol content was quantified by the Folin-Ciocalteu method, according to the methodology reported by Rosales-Castro, González-Laredo, Rivas-Arreola, and Karchesy (2017). The standard curve (y = 0.0012x + 0.0076; R2 = 0.9990) was prepared with gallic acid. Results were expressed as mg gallic acid equivalents per g of dry extract (mg EAG∙g-1). Total flavonoids were evaluated according to the methodology described by Rosales-Castro et al. (2017). The standard curve (y = 0.0034x - 0.03; R2 = 0.9981) was prepared with catechin (Sigma-Aldrich). Results were expressed as mg catechin equivalents per g of dry extract (mg EC∙g-1).
Antioxidant capacity of extracts was evaluated through inhibition of free radicals by three in vitro methods: DPPH, ABTS and FRAP. This evaluation was performed at ET30, ET50 and ET80 in an ultraviolet-visible spectrophotometer (UV-VIS Hach, DR 5000, Germany), although only for the 1:30 m/v ratio, because it was the one with the highest concentration of total phenols and flavonoids.
The DPPH analysis was performed with the method reported by Rosales-Castro, Honorato-Salazar, Reyes-Navarrete, and Gonzalez-Laredo (2015) which is based on the transformation of DPPH- (2,2-diphenyl-1-picrylhydrazyl) as a stable radical to reduced DPPH. Such transformation is measured by the gradual color change (purple to yellow) at a wavelength of 515 nm for 30 min. Color change increases gradually according to the number of electrons accepted. The radical was used at a concentration of 2.4 mg∙100 mL-1 1 dissolved in methanol. Extracts were analyzed over a range of 300 to 1 800 mg∙L-1 to obtain CE50 corresponding to the effective concentration of extract to inhibit 50 % of the radical.
The ABTS radical (2,2′-azinobis [3-ethylbenzothiazolin]-6-sulfonic acid) was measured at a wavelength of 754 nm, dissolved in ethanol at an absorbance value of 0.70 ± 0.1. The extracts were analyzed at a concentration of 200 mg∙L-1 and the results were expressed as percent inhibition. The methodology reported by Rosales-Castro et al. (2015) was used.
The FRAP method or iron reducing antioxidant power was evaluated according to the methodology of Rosales-Castro et al. (2015). The extracts were dissolved in ethanol at a concentration of 200 mg∙L-1. A calibration curve was performed with trolox and the results were expressed as millimoles trolox equivalent (mmol ET).
Qualitative comparison of phenolic compounds by HPLC-DAD
This evaluation consisted of a chromatographic analysis of the extracts (ET30, ET50, ET80) of leaves and stems, m/v ratio 1:30, to determine the effect of the solvent on the extraction of compounds with the three ethanol concentrations and to compare them qualitatively.
The analysis was performed in a high-performance liquid chromatography equipment coupled to a diode array detector (HPLC-DAD Infinity 1260 Series, Agilent Technologies, Palo Alto, CA, USA), according to the methodology described by Gutiérrez-Macías, Peralta-Cruz, Borja-De la Rosa, and Barragán-Huerta (2016). Extracts were used at concentration of 1 000 mg∙L-1, injection volume 20 μL, C18 column (Agilent Technologies) 4.6 x 150 mm, 5 µm, 2.5 % acetic acid mobile phase (phase A) and acetonitrile (phase B) with flow rate of 1 mL∙min-1. Phenolic compounds were monitored at 280 nm. Only compounds showing the highest absorbance were considered.
After obtaining the chromatograms, a presence (1) and absence (0) analysis was carried out at the different retention times (between 0 and 35 min), where compounds eluted in the six samples analyzed. With the presence/absence information, a dendrogram was elaborated to analyze the grouping of the solubilized compounds when using the three ethanol concentrations.
Identification of phenolic compounds by UPLC-MS
ET80 1:30 samples, both leaves and stems, were analyzed using the methodology proposed by Villegas-Novoa et al. (2019). Extracts were dissolved at 1 000 mg∙L-1 in 80 % ethanol. An Acquit UPLC-MS (mass spectrometry coupled to high-performance liquid chromatography) system consisting of an automatic injector, pumps, and a Xevo TQ-S tandem triple quadrupole mass spectrometer (Waters Corp., Milford, MA, USA) was used. Phenolic compounds were separated on a C18 100 × 2.1 mm, 1.7 µm column employing 7.5 mM formic acid mobile phase (phase A) and acetonitrile (phase B) with 210 µL∙min-1, flow rate. Compounds were identified by interpreting mass spectra, through MS/MS array and using standards (Sigma-Aldrich) of various phenolic compounds (phenolic acids and flavonoids) by negative ionization. Quantification was done from the standard curve of each of the compounds (standards) and results were reported as relative percentage of the response of each compound compared to the total response in a UPLC chromatogram.
Statistical analysis
The experiment for the evaluation of yield, total phenols and flavonoids was carried out in a 32 factorial design: two factors (ethanol concentration and mass/volume ratio) and three levels (ET30, ET50, ET80; 1:10, 1:20, 1:30), both for leaves and stems. An analysis of variance and Tukey's mean comparison test (P ≤ 0.05) were applied with the STATISTICA v.7 statistical package (StatSoft Inc., 2007). The chromatographic comparison was done with the PAST version 3.21 program (Hammer, Harper, & Ryan, 2018).
Results and Discussion
Extraction is a mass transfer process involving three stages: penetration of solvent into the solid phase (internal transport), dissolution of the solute (solubility) and diffusion of the solute from the solid phase to the solvent (external transport).
Extraction yield in materials studied was from 24.3 % (ET30-1:10) to 31.18 % (ET50-1:30) for leaves and from 13.0 % (ET30-1:10) to 19.95 % (ET50-1:30) for stems, which indicates that for every 100 g of dry leaf residue up to 31 g of dry extract could be obtained and 19.95 g in the case of stems. The highest yield was for the m/v ratio of 1:30 and ET50, both for leaves and stems, while extractions with the 1:10 ratio had the lowest yield. The m/v ratio of 1:20 showed no statistical difference (P > 0.05) with the 1:30 ratio. M/v ratios of 1/40 are reported as optimal in extractions of the Phaleria macrocarpa (Scheff.) Boerl. fruit (Lim, Sook, Yusoff, Mudalipa, & Gimbun, 2019) and yields of 7.92, 15.17 and 37.0 % in agro-industrial residues of grape, peanut and mango, respectively (Costa et al., 2016). For L. graveolens leaves, yields of 25.74 % in extractions with methanol and 19.73 % in extractions with water are reported (González-Trujano et al., 2017). For the solvent concentration, the highest yield in solids was achieved with ET50, being significantly higher (P < 0.05) than with ET30 and ET80. Solubility of phenolic compounds depends on the type and polarity of the solvent, the chemical structure of the compounds, degree of polymerization, interaction with other constituents in plant material and formation of insoluble complexes. Therefore, there is no single procedure that is satisfactory and suitable for the extraction of all phenols or a specific class of phenolic substances in plant materials (Ajila et al., 2011).
Total phenol concentration was higher in leaf extracts compared to stem extracts. Leaf concentration ranged from 227.5 to 342.1 mg EAG∙g-1 and from 170.4 to 277.9 mg EAG∙g-1 in stems (Figure 1). In both leaves and stems, the maximum concentration was obtained with ET80 and 1:30 ratio. Statistical difference (P < 0.05) was observed in the concentration of phenols depending on the solvent used, as well as between the two materials evaluated; however, in the m/v ratio, only the 1:10 ratio showed difference with the rest. A methanolic extract of L. graveolens leaves free of essential oil (Martínez-Rocha, Puga, Hernández-Sandoval, Loarca-Piña, & Mendoza, 2008) reported total phenol concentrations of 211 to 270 mg EAG∙g-1, values lower than those obtained in this study. In another study, from mango residues, Lim et al. (2019) used ethanol-water mixtures in proportions from 0 to 100 % ethanol and found that the 50/50 ethanol mixture was the most favorable to obtain the maximum yield in total phenols. These authors attribute their results to the "like dissolves like" principle, where water dissolves polar compounds, while ethanol dissolves less polar ones.
Flavonoids are a group of compounds that are part of the total phenolic content; the concentration ranged from 125.8 to 180.7 mg EC∙g-1 for leaves and from 98.4 to 176.2 mg EC∙g-1 for stems (Figure 1). In both leaves and stems, the highest concentrations were obtained with ET80 and 1:30 ratio, although with no statistical difference for the 1:20 ratio. Differences between solvents ET50 and ET80 were significant (P < 0.05) compared to ET30. These results indicate that flavonoids from oregano leaves and stems have better dissolution in ethanol than in water. Martinez-Rocha et al. (2008) reported 136 to 200 mg EC∙g-1 of flavonoids in a methanolic extract of leaves free of essential oil, values similar to those obtained with ET80.

Figure 1 Concentration of total phenols (milligram equivalents of gallic acid per gram of dry extract) and flavonoids (milligram equivalents of catechin per gram of dry extract) in oil-free residual leaf and stems of Mexican oregano (Lippia graveolens) from an aqueous ethanol extract as solvent at concentrations of 30, 50 and 80 % (ET30, ET50, ET80, respectively) with mass:solvent ratio of 1/10, 1/20 and 1/30.
From total phenol and flavonoid data, the flavonoid/phenol ratio was estimated for the three ethanol concentrations. For leaves, the flavonoid/phenol ratio decreased with increasing ethanol concentration, as the ratio was 57.3 % with ET30 and decreased to 53.3 % when increased to ET80, indicating that this concentration favors the extraction of non-flavonoid phenolic compounds, possibly phenolic acids and stilbenes. For the stems, the behavior was reversed, since the flavonoid/phenol ratio was 60.7 % when using ET30 and increased to 62.6 % with ET80, which favored the extraction of flavonoid-type phenolic compounds.
Antioxidant capacity
Regarding the antioxidant capacity in the evaluation with the DPPH radical, leaf extracts had higher inhibition compared to stem extracts. Figure 2a shows the results CE50, which corresponds to the effective concentration of extract to inhibit 50 % of the radical; the lower concentration of the extract (mg∙L-1) indicates that the activity is higher. The highest capacity was for leaf samples with ET80 (447 mg∙L-1 extract) and for stems with ET50 (748 mg∙L-1 extract), although with no statistical difference (P > 0.05) for stems with ET80 (750 mg∙L-1).
For the ABTS (Figure 2b) and FRAP (Figure 2c) analyses, extracts showed similar trend of antioxidant capacity in both techniques. For ABTS, the results were expressed as percentage of inhibition, so the higher the percentage, the better the inhibitory capacity. The highest inhibition was for stems ET50 with 46 %, followed by leaves ET80 with 44 %. For FRAP, the results indicate that the extract with the highest capacity was for leaf ET80 with 346 mmol ET, followed by stems ET50 with 320 mmol ET. In a study on the extraction of phenolic compounds in mango residues, Lim et al. (2019) report that the best results in DPPH and FRAP analyses were obtained with ethanol/water extraction at 50/50 (v/v) ratio.
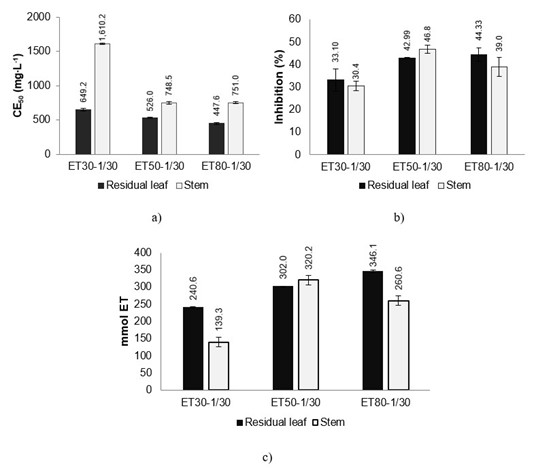
Figure 2 Antioxidant capacity of residual leaf extracts (without oil) and stems of oregano (Lippia graveolens) by techniques a) DPPH, expressed as effective concentration to inhibit 50 % of the radical (EC50), b) ABTS expressed as percentage inhibition and c) FRAP in millimol equivalents of trolox (mmol ET) from an aqueous ethanol extract as solvent at concentrations of 30, 50 and 80 % (ET30, ET50, ET80, respectively) with mass ratio: solvent of 1/30.
The correlation between the concentration of total phenols and flavonoids was analyzed concerning the antioxidant capacity; the highest correlation was obtained between total phenols and FRAP (R2 = 0.87). The values obtained for the correlations with flavonoids were low: flavonoids and DPPH (R2 = 0.62), flavonoids and ABTS (R2 = 0.50), flavonoids and FRAP (R2 = 0.66). The above indicates that, although the concentration of flavonoids in both leaves and stems is high, the chemical structure of some of these compounds does not allow them to have good free radical trapping capacity.
Qualitative comparison of phenolic compounds by HPLC-DAD
The similarity of the compounds extracted with ET30, ET50 and ET80 ethanol concentrations, both for leaves and stems, is shown in the cluster analysis in Figure 3. The results showed that, for leaves, the compounds solubilized with ET50 are the same as those dissolved in ET80 qualitatively and, for stems, the similarity between those soluble in ET50 and ET80 is 95 %. For ET30 stem extracts, the similarity with the rest is 70 %, while for ET30 leaves, the similarity is less than 30 %. From this information, it can be deduced that the solvent concentrations ET50 and ET80 did not affect the solubility of the compounds qualitatively, although they did affect the solubility of the compounds quantitatively. The compounds solubilized with ET30 are different from the rest.

Identification of phenolic compounds by UPLC-MS
Table 1 shows the compounds identified in the ET80-1:30 extracts and their concentrations in residual leaf and stems. The leaf extract had 14.67 % caffeic acid, while in the stem extract this compound represented 7.34 %. For the compound 2-hydroxybenzoic acid, contents were 2.01 % for leaves and 2.86 % for stems. The flavonoids in the leaf extract were naringenin (25.95 %), taxifolin (17.61 %), eriodictyol (15.13 %), acacetin (10.44 %), luteolin (4.43 %), quercetin 3-O-glycoside (3.59 %), apigenin (1.53 %), floridzin (1.0 %) and quercetin (0.80 %). For the stem extract, the flavonoids identified were naringenin (30.11 %), taxifolin (21.31 %), eriodictyol (20.59 %), luteolin (6.12 %), quercetin 3-O-glycoside (2.82 %), apigenin (2.18 %), quercetin (0.96 %), acacetin (0.94 %) and floridzin (0.9 %).
Table 1 Phenolic compounds identified in ethanolic extracts (80 % in 1:30 m/v ratio) of oil-free leaves and stems of Mexican oregano.
| Content | Classification | Retention time (min) | Extract of leaves without oil (%) | Stem extract (%) |
|---|---|---|---|---|
| Quinic acid | Phenolic Acid | 1.33 | 0.35 | 0.5 |
| Protocatechuic acid | Phenolic Acid | 2.7 | 0.69 | 0.85 |
| 4-hydroxybenzoic acid | Phenolic Acid | 3.74 | 0.18 | 0.27 |
| Caffeic acid | Phenolic Acid | 4.32 | 14.67 | 7.34 |
| Coumaric acid | Phenolic Acid | 5.51 | 0.37 | 0.59 |
| Quercetin-3-O-glucoside | Flavonol | 5.8 | 3.59 | 2.82 |
| Rutin | Flavonol | 6.35 | 0.32 | 0.35 |
| Taxifolin | Flavanone | 6.41 | 17.61 | 21.31 |
| 2-Hydroxybenzoic acid | Phenolic Acid | 7.56 | 2.01 | 2.86 |
| Neohesperidin | Dihydrochalcone | 7.79 | 0.63 | 0.6 |
| Floridzin | Dihydrochalcone | 7.79 | 1 | 0.9 |
| Eriodictyol | Flavanone | 8.67 | 15.13 | 20.59 |
| Luteolin | Flavone | 8.92 | 4.43 | 6.12 |
| Quercetin | Flavonol | 8.96 | 0.8 | 0.96 |
| Naringenin | Flavanone | 9.73 | 25.95 | 30.11 |
| Apigenin | Flavone | 9.84 | 1.53 | 2.18 |
| Acacetin | Flavone | 12.51 | 10.44 | 0.94 |
Compounds coincide with those identified for leaves without essential oil (Arias et al., 2020), in methanolic extracts of leaves (Gutiérrez-Grijalva et al., 2018; Pérez-Gutiérrez, 2014) and for stem extracts obtained with hexane/ethyl acetate/methanol mixture (González et al., 2007). Some other compounds reported for L. graveolens were not identified in this study, because reference standards for their identification and quantification were not available.
ET80 favored the extraction of non-flavonoid phenolic compounds in leaves and agrees with the results obtained in the identification section, because the concentration of caffeic acid is higher for leaves than stems. The analysis also showed that ET80 favored the extraction of flavonoids in stems, because concentration was higher than in leaf extract.
There are several mechanisms to determine antioxidant activity of phenolic compounds (Apak, Özyürek, Gü clu̧, & Çapanoglŭ, 2016). One of them is through free radical scavenging, which depends on the number of hydroxyl groups and their position in the molecule, as well as the substituent groups, whether hydroxyl, methoxyl, glycosides, among others (Yi-Zhong, Sun, Xing, Luo, & Cork, 2006). In the case of flavonoids, the free radical trapping capacity increases with increasing degree of hydroxylation; flavonoids without hydroxyl groups have no radical scavenging capacity (Chen et al., 2018). Substitution patterns in the A- and B-rings, as well as the double bond between C2-C3 and the 4-oxo group in the C-ring are related to the low or high antioxidant activity of flavonoids. DPPH and ABTS radical trapping capacity of groups of phenolic compounds is reported to be in the sequence Flavan-3-ol ˃ flavonols ˃ chalcones ˃ stilbenes ˃ phenolic acids ˃ flavones ˃ flavanones ˃ isoflavones, with some exceptions within each group (Yi-Zhong et al., 2006).
For the extracts of oregano residual leaves and stems, the major compound is the flavanone naringenin, which, due to its chemical structure, has low free radical trapping capacity, so it is suggested that the flavonoids taxifolin, eriodictyol, quercetin, quercetin-3-O-glucoside, luteolin, apigenin, as well as caffeic acid are the ones giving antioxidant capacity to the extracts ET80 and ET50. Although naringenin has no free radical trapping capacity, it is reported that, in biological assays, this flavonoid has anti-diabetic properties, regulates glucose and lipid metabolism (Den & Tsiani, 2019; Ren et al., 2016), so its biological activity is important. Antioxidant activity and therapeutic properties of flavonoids contained by the Mexican oregano have been reported, which correspond to those identified in the present study, as well as pharmacological and biological properties of taxifolin (Sunil & Xu, 2019), eriodictyol (Islam, Islam, Rahman, Uddin, & Akanda, 2020), apigenin and luteolin (Liu, Shi, Fu, & Zhao, 2019). Therefore, the extraction of these compounds from by-products such as oregano residues may have potential in pharmacological applications and as nutraceutical ingredients.
Conclusions
Ethanol-water concentrations (30, 50 and 80 %) and mass/solvent ratios (1:10, 1:20 and 1:30) are feasible for obtaining flavonoid and non-flavonoid phenolic compounds with antioxidant capacity from oil-free leaves and stems of oregano (Lippia graveolens). Solvent concentrations at 50 and 80 % had no qualitative effect on the solubility of the compounds, although they did have a quantitative effect. The maximum concentration of phenols was obtained with 80 % and 1:30 ratio, which indicates better dissolution in ethanol than in water. Oil-free leaves and stems of oregano contain flavonoids and phenolic acids with beneficial biological properties for human health, making these residues a valuable resource for therapeutic and pharmacological purposes. This study represents the first research on the use of ethanol with water for the extraction of phenolic compounds in residues from the oregano oil extraction industry.

