


 texto en
  Inglés (pdf)
 Artículo en XML
 Referencias del artículo
 Enviar artículo por email
 Citado por SciELO
  Similares en
SciELO
Similares en
SciELO 
 Permalink
Introduction
Forest fires are considered the most important cause of loss of vegetation cover (Moore, 2019). In tropical regions of Asia and America, the occurrence of fires in wooded areas, is the second most important factor of loss of vegetation only behind Land-Use Change (Food and Agricultural Organization [FAO], 2007). In Mexico, the effects of these incidents are an important cause of loss and degradation of forest cover. An average of 7 087 ± 2 538 fires are recorded each year (1970-2018) with an average annual burned area of 253 950 ± 189 500.597 ha and an average burned area by fire of 109 ± 107 ha (Comisión Nacional Forestal [CONAFOR], 2019).
In recent years, forest fires show greater dispersion, frequency, size and severity (International Panel on Climate Change [IPCC], 2007). This increase in the occurrence rate is attributed both to the generation of greater fuel volume, as a result of fire suppression actions, and to climate change (Marlon et al., 2009; Westerling, Hidalgo, Cayan, & Swetnam, 2006). Both drivers have led to significant changes in precipitation and drought patterns, and fuel accumulation processes, which together have changed the dynamics of forest fires (IPCC, 2007). As a result, globally, governments spend a large budget on fire prevention and firefighting. While most of the government expenditure is spent on suppression, the design of prevention and management mechanisms, among which the generation of information to qualify the risk or anticipate the occurrence of a fire, accounts for a significant proportion of the expenditure (FAO, 2007). In this context, the estimation of the occurrence of a fire is significant, since it allows to plan measures to minimize loss of human lifes, infrastructure and natural resources (Adab, Kanniah, Solaimani, & Sallehuddin, 2015); to promote activities to maintain and restore fire regimes (Keeley, Fotheringham, & Morais, 1999); and to optimize the distribution of available resources in suppression activities (Podschwit, Larkin, Steele, Cullen, & Alvarado, 2018).
The occurrence of a fire has been estimated through two strategies. The first is to estimate indicators of risk of occurrence based on indirect measures of climatic, physical, environmental attributes or the characteristics of the same fires (i. e. statistics of occurrence). This strategy is derived from the absence or low quality and quantity of data on the causal variables of a fire or from the limited knowledge of fire behavior in a particular region (Miller & Ager, 2013; Thompson & Calkin, 2011). The estimates are made through indicators derived from probabilistic analysis of the available information (distributions of sizes) with refinements through regression models, neural networks, mathematical programming and Markovian models (Ager, Vaillant, & Finney, 2010; Miller & Ager, 2013; Podur, Martell, & Stanford, 2009; Preisler et al., 2004). The second strategy is the prediction of the occurrence or characteristics of a fire (size, intensity and duration), through models that predict the probability of observing an affected area (or fire attributes) depending on the site characteristics (v. g. slope, exposure, elevation, road distance and population density) (Adab et al., 2015; Adab, Kanniah, & Solaimani, 2013; Avila et al., 2010; Munn, Zhai, & Evans, 2003). Estimates are made through a wide variety of techniques ranging from statistical prediction models, to Bayesian networks and methods, among others (Stojanova, Panov, Kobler, Džeroski, & Taškova, 2006).
The estimation of the occurrence of a fire by one or another strategy is complex, not only due to the multitude of factors that determine its presence (Rodriguez, 2015), but also because they have their own dynamics. Therefore, forest fires have been categorized as “complex events, whose occurrence is the result of the interaction between natural processes and human factors in a social, economic and cultural context” (Vasilakos, Kalabokidis, Hatzopoulos, Kallos, & Matsinos, 2007).
The estimation of indicators of occurrence of fires or the burned area (annual burned area) in a season, based on the analysis of distribution of fire sizes, has been a recurrent practice to analyze their general behavior or to generate long-term indicators of occurrence (Malamud, Morein, & Turcotte, 1998; Torres-Rojo, Magaña-Torres, & Ramírez-Fuentes, 2007). The basic assumption is that burned surfaces follow a stationary process, so their size distribution does not change (Federal Emergency Management Agency [FEMA], 2002; Finney, 2005). These analyses have been extended to the study of large-scale fires, events that have acquired great relevance, because their frequency has increased and because they cause the greatest negative impact on forest cover (Jones et al., 2016). Studies have shown that large burned areas are a non-stationary process; that is, their frequency distribution does change, making their estimation more complicated (Holmes, Huggett, & Westerling, 2008; Liu, Stanturf, & Goodrick, 2010; Sun & Tolver, 2012).
In this context, the present work is a contribution to the study of size distribution and its application to estimate indicators of occurrence of large burned areas. The study aimed to present an indicator of the maximum area at risk of being affected by forest fires (SeR) in a territorial unit and over a season.
Materials and methods
Development of the maximum area at risk of fire indicator
The random variable "annual burned area" (y) is defined as the sum of the area affected by all fires occurring over a year in a territorial unit and, like any random variable, it has a density distribution f(y) and a distribution function F(y). This variable is known in the English-language literature as "annual burned area" (ABA) and should not be confused with the variable “area affected by a single fire” (SAI) in a territorial unit, which is most commonly used to model fire size distributions. The frequency distributions of the variable-SAI exhibits positive skewness, similar to that illustrated in Figure 1 for the random variable y; however, they are characterized by having heavy-tailed distribution (Jiang, Zhuang, Flannigan, & Little, 2009; Katz, Brush & Parlange, 2005), which complicates the modeling, even with the use of extreme-value distributions (Alvarado, Sandberg, & Pickford, 1998; Jiang & Zhuang, 2011).
For the remainder of the document, the random variable y will be referred to as the area burned and is equivalent to the sum of areas affected by fires over a year in a territorial unit. It should be noted that this variable is the most used indicator to qualify the severity of a fire season, the risk of the area under timber harvesting or to associate air quality and health in the presence of fires (Wiitala & Carlton,1994). The variable also has a positive skewness (Figure 1), but the weight of the right tail is lower, because individual fires with very large effects are a plus in the sum of affected areas in a year and do not represent a single value at the end of the distribution, as happens in individual event distributions.
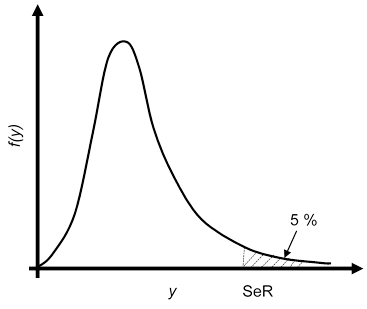
Figure 1 Random variable y (annual area affected by forest fires) with density distribution f (y). The maximum area at risk of fire (SeR) with maximum probability (P max ) of 5 % is illustrated.
If f(y) is known, then the maximum area at risk of fire (SeR) in a territorial unit, given a level of probability P max , is defined as the area corresponding to the value of y in the right tail of f(y) for a level of probability P max ; that is, SeR = F -1 (1- P max ). SeR is an indicator analogous to Value at Risk (Jorion, 2000) popularly known as VaR and used as a measure of risk in the financial sector. SeR is illustrated in Figure 1 with P max = 5 %. This indicator, measured in area, has the attribute of isolating very high value events (total area affected in a year) from those occurring in 1- P max of all occasions. This allows the estimation of the magnitude of a rare but large-scale loss without the effect of the most common events (area affected in one year).
The determination of the P
max
value depends on the risk willing to be taken in the estimation of the maximum burned area. Financial VaR uses a probability level of 5 %, but occasionally uses 2.5 % and 1 % (Dowd, 2003). For the estimation of SeR, the value P
max
= 5 % seems appropriate, since it approximates the relative frequency of large-scale fires (Taylor et al., 2013 ) and can also be associated with a return period (PR =
Other related indicators
Large - scale forest fires are regularly associated with climate change, increased fuel accumulation or poor incident management (Fernandes, Pacheco, Almeida, & Claro, 2016); therefore, fires follow a non-stationary pattern derived from the same characteristic of their main causes, which causes their probability distribution to change from period to period (Read & Vogel, 2016). This change in the distribution of large fires and, consequently, of the affected areas between year t-k and year t, can be assessed by the difference in the value of SeR in both times. This measure will be called in the subsequent Incremental SeR (ISeR); its calculation for a period of k years, given a P
max
ISeR provides a metric of the magnitude and sense in which the risk of occurrence of an burned area changes over the k-year period. An increase in ISeR over a period of k years indicates that risk increases at increasing rate (nonlinear), given the nonlinearity at the tail of the frequency distribution (Dowd, 2003).
The ratio between the area affected by fires in a year and the total forest area, in each territorial unit, is a relative expression of the area affected with respect to the forest area. This proportion constitutes a new random variable x (x = total burned area/forest area), which also has a density function f(x). Similarly, to SeR, the "maximum proportion of forest area at risk of fire" (PSeR) with a confidence level P max , was defined as the proportion in the right tail of f(x) given a P max probability level.
If f(x) is known for two consecutive moments, it is possible to calculate a difference in the maximum proportion of area at risk of fire (PSeR) in a period of k years and given a P
max
Data
The area affected by forest fires per entity and per year was obtained from CONAFOR for the period 1970-2018. The area covered by forests varies year after year as a result of land-use change processes. The estimation of this coverage has a variable level of accuracy. Therefore, the forest area was considered constant over time and was determined based on the last available land use and vegetation cover (Series VI of the Instituto Nacional de Estadística y Geografía [INEGI], 2015). This assumption makes the form of the empirical distribution of the variable PSeR [f(x)] similar to that of the variable SeR [f(x)], since X = Y/k, where k is constant in all years.
Method
Each of the forest burned area data series, by state, was adjusted to several distribution function models to identify the best model fit. The models tested were: gama, exponential, lognormal and Weibull, selection based on the recommendations of several authors (Alvarado et al., 1998; Cui & Perera, 2008; Cumming, 2001; Jiang & Zhuang, 2011). The probability function was adjusted from the estimation of an empirical distribution [
The performance of each model was evaluated with the significance of the Dmax statistic and two qualitative criteria. The first criterion qualified the model with the best significance with a value of 1, the model with the next best significance with 2 and so on until 4, corresponding to the model with the least significance. The rating of each model across all states was summed up and used as a first indicator of the most recommended model. The second criterion rated the model that provided the best fit with 1 and 0 for the others. The sum of these values, divided by the number of features, defines the proportion of times a model provided the best fit.
Once the most significant model was chosen, the SeR was calculated for P max values of 1 %, 5 %, 20 % and 90 % for the series 1970-2008, 1970-2013 and 1970-2018, following the best fit model for each entity (i. e. a generic model was not used for all entities). These P max values were chosen since they correspond to return periods of 100, 20, 5 and 1 year, respectively.
In order to identify the predictive power of the developed indicators, the prediction for year t + 1 of a model composed by SeR and ISeR was contrasted with the prediction for the same year based on the affected area in the previous year variable (SAA), which theoretically has greater predictive power. The prediction model with SeR and ISeR is based on a linear model of two components: i) a systematic or inevitable risk estimator related to the inherent risk of the territorial unit and ii) an estimator of the trend of the area at risk, which, as noted, approximates the accumulation of fuels. The systematic risk component was defined by SeR with P
max
= 90 % (SeR0.90), because this area is the expected in a one-year return period, while the trend component was approached with the ISeR of the last k = 5 años (ISeR5,0.90). The prediction model has the basic form SAA
t+1
=
Results
Functional form of f(y)
The fits had high statistical significance for the Dmax statistic in all states, with the exception of Baja California Sur, where it was necessary to eliminate observations with zero burned area to improve the quality of the fits. The lognormal model had the best rating according to qualitative criteria, followed by the gamma, exponential and finally the Weibull models (Table 1). This shows that burned area distribution follows a lognormal function in most cases, as several authors have mentioned (Holmes et al., 2008; Reed, 2001; Strauss, Bednar, & Mees, 1989).
Maximum area at risk of fire (SeR)
Figure 2 shows the maximum area at risk of fire (SeR) for P max values at 1 % (SeR1 %) and 5 % (SeR5 %). In this graph the states with the largest forest area (Chihuahua, Durango, Jalisco, Quintana Roo, Oaxaca, Chiapas and Guerrero) stand out, derived from their greater exposure to risk (greater forest area). Some states such as Coahuila, Sonora, Baja California, Zacatecas and Nuevo Leon showed a significantly large SeR; however, the result may be misleading since the area reported as affected is not necessarily related to the wooded area.
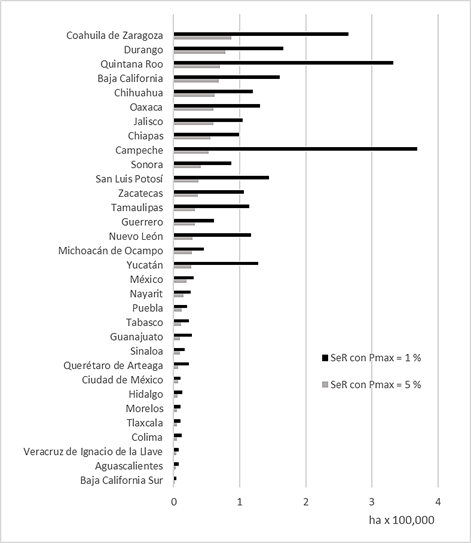
Figure 2 Maximum area at risk of fire (SeR) estimates for maximum probability values (P max ) at 1 and 5 %.
Figure 2 highlights the differences between SeR1 % and SeR5 % for states such as Quintana Roo, Coahuila, Sonora, Oaxaca, Campeche, Chiapas and Querétaro. The differential shows a greater occurrence of large effects in return periods of 100 years (SeR1 %). Presumably, the differential could be associated with particular fuel accumulation conditions, climatic conditions (extreme temperatures and specific winds), fire regimes, efficiency of suppression actions or even socio-economic conditions that create an environment of increased risk for the spread of large-scale events. These differences contrast with states such as Mexico City, Mexico State or Sinaloa, where it is evident that extreme events (i. e. big total effects in a year) in a 100-year return period, are not proportionally larger in relation to those that could be observed in a 20-year period.
Maximum proportion of area at risk of fire (PSeR)
Unlike SeR, PSeR is comparable between territorial units, regardless of its size and amount of forest area; therefore, it is a relative index. The PSeR evaluated with P
max
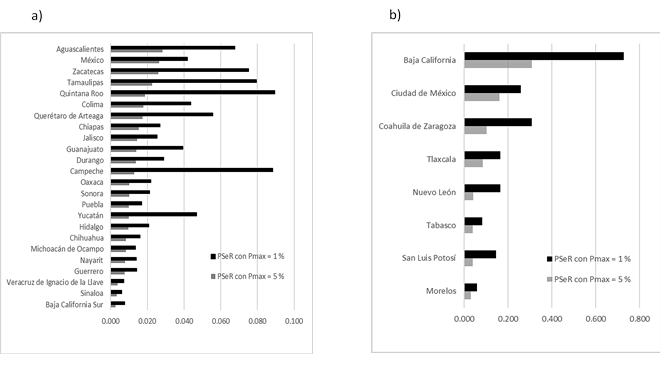
Figure 3 Estimates of the maximum proportion of area at fire risk (PSeR) for maximum probability values (P max ) of 1 % and 5 %. Entities with PSeR < 3 % considering P max = 5 % (a) and PSeR ≥ 3% considering P max = 5 % (b), in the period 1970-2018.
Another relevant aspect in the results is the PSeR with P max = 1 % (PSeR1 %) for Quintana Roo, a state with a high incidence of large events; its PSeR1 % is proportionally higher than the PSeR5 %, suggesting greater probability of observing more isolated events of large-magnitude than events of medium magnitude. The same case is observed for states such as Campeche, Tamaulipas, Zacatecas, Yucatan, Queretaro and Baja California.
Proportion of area at incremental risk (IPSeR)
To exemplify the incremental PSeR (IPSeR) a period k = 10 years was used. The difference was obtained by comparing the PSeR for the period 1970-2018 with that for the period 1970-2008 (i. e. the evaluated period is 2009-2018). In all cases, the comparison was made with the functional form f(x) that had the best fit for each state. Figure 4 shows three groups of entities: the first composed of entities where IPSeR is increasing, the second group with entities where there is practically no change, and the third group where IPSeR is decreasing for the period 2009-2018. Increases in IPSeR above 2 % are only observed in Mexico City, Baja California, Quintana Roo, and Aguascalientes. In contrast, reductions in IPSeR are only observed in Coahuila; the rest of the entities appear to have very small changes during the analyzed period.
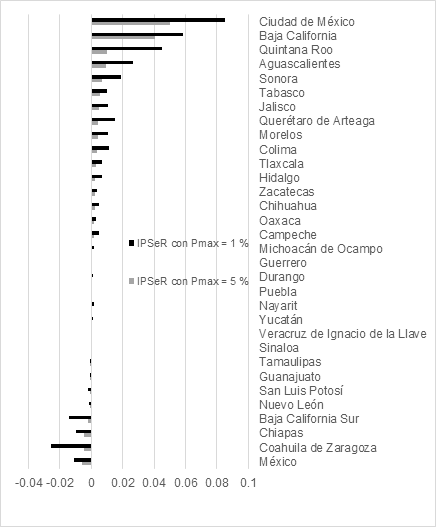
Figure 4 Values of proportion of area at incremental risk (IPSeR10, 5 %) of fires between 2009 and 2018.
IPSeR is an indicator of the direction in which the PSeR changes during the analyzed period and is most likely related to the amount of fuel available or the higher incidence of causative agents in a territorial unit. An example of their relationship with fuel availability are the states of Coahuila, Chiapas, Mexico and Nuevo Leon, which had significant burned areas in the previous period (2009-2018) and caused a reduction in fuel volume. Such a reduction presumably decreased the post-period effects, which is reflected in an IPSeR < 0. On the other hand, states with positive IPSeR (Mexico City, Baja California, Quintana Roo and Aguascalientes) are characterized by having presented extensive areas affected in a period greater than 10 years, before 2009, so they most likely recovered the inventory of fuels along the evaluated period (2009-2018) and show greater risk of having extensive burned areas after that year. A result that reinforces this argument is that, in these entities, the average number of fires in the analyzed period was statistically higher than the average for the whole series.
Prediction of affected areas
Table 2 shows the results of the adjustments made for the prediction of SAA in 2014, based on variants of the models indicated in the methodological section. The ISeR corresponds to that between the periods 2009-2013 (k = 5). In all cases a logarithmic transformation was used, because the best fit model is a lognormal model. Model C provided estimators whose sum of ß
i
is close to the unit, which is consistent with the theoretical model SAA
t+1
=
Table 2 Models used to predict the area affected by fires in the previous year compared to 2014.
| Variable | Models | |||
|---|---|---|---|---|
| A | B | C | D | |
| Intercept | 14.3744 ns | |||
| ln(Affected area 2013) | 0.8351* | |||
| ln(ISeR 2009-2013) | 1.3237* | 0.4871* | 0.8189* | |
| ln(SeR (Pmax = 90 %)) | -0.3916 ns | 0.4170* | 1.9051* | |
| ln[ln(SeR (Pmax = 90 %))] | 1.2691 ns | -7.0846* | ||
| R2 adjusted | 0.5402 | 0.9431 | 0.9349 | 0.9416 |
| Observations | 32 | 32 | 32 | 32 |
ns: no significant; *significant (P ≤ 0.05).
Discussion
Adjustments for all distributions of annual burned area over a year, and for each of the states, showed high statistical significance (P ≤ 0.05). Several authors have pointed out that the Pareto distribution is the one that best adjusts the size distributions of individual fires, since these are very heavy-tailed (Alvarado et al., 1998; Cui & Perera, 2008; Irland, 2013; Schoenberg, Peng, & Woods, 2003); however, the distributions of the total burned area for a year in a territorial unit did not show such heavy tail, and therefore did not require the use of extreme value models (i . e. Pareto, Gumbel, Fréchet or Weibull of more than two parameters) for its fit or the application of special fitting techniques (i. e. probabilistically weighted model). In all cases, the models tested to adjust the size distributions of the effects in each of the states showed high goodness of fit. The lognormal model stood out for being the best fit in 75 % of states, in agreement with Taylor et al. (2013), who propose this model for the same variable (sum of areas burned in a season).
The SeR approximates the occurrence of very large events with a level of probability, making it an indicator of possible large-scale impact. The indicator is relevant since large events constitute less than 5 % of occurrence (Taylor et al., 2013); however, they are the ones that cause the greatest damage (Strauss et al., 1989). The SeR does not consider factors such as intensity of the event or the effects of fire on the structure or composition of the affected vegetation; variables that are more linked to short-term risk indices and of local application as defined by Adab et al. (2015), Ager et al. (2010), Keeley et al. (1999), Podur et al. (2009) y Preisler et al. (2004). Nevertheless, an estimator of the occurrence of extreme events in a territorial unit is useful for estimating a budget scenario in the presence of atypical (large) events, as well as estimating the opportunity cost of a forest area's lack of protection. As far as is known, there are no risk indicators similar to those proposed in this study that have been reported in the literature. The closest is Jiang and Zhuang (2011), who used extreme value distributions to estimate the return periods of large forest fires using individual fire data. As noted above, the return period is related to the SeR as the size distribution is estimated and the extreme values are identified. The other close estimator is that of Podur, Martell, and Knight (2002), who used the distribution of the sum of annually burned areas (annually burned area), to assess the change in fire damage in Canada; their approximation uses moments of distribution to identify differences in burned areas, but did not estimate a probability of occurrence of burned areas over large expanses.
The PSeR is a particularly useful indicator for a central planner, such as CONAFOR, as it provides information to prioritize regions or states in the face of the possibility of having an atypical event (total area burned) of great magnitude. The knowledge of the regions or entities that may have the greatest risk of presenting an event of this nature improves the planning of the needs of equipment, human and financial resources that must be invested in each entity to face the contingencies.
Several authors point out that large, atypical events are more related to the amount of fuel available than to weather conditions, combined with poor incident management (Fernandes et al., 2016; Taylor et al., 2013). Therefore, recurring recommendations to avoid large, atypical events are to reduce the amount of fuels where possible and to increase monitoring of this material, particularly in regions near the urban interface (Fernandes et al., 2016). In this context, the ISeR is a relevant indicator, since it shows the dynamics of the SeR over time and, thus, the probable accumulation of fuel given the greater or lesser occurrence of large, atypical events. A small (negative) ISeR is related to recent large, atypical events, which have probably consumed fuel; so a smaller occurrence of such events would be expected in the short term. The relationship seems to have theoretical bases; however, more research is needed to calibrate the fuel accumulation time with the periodicity of the calculation of ISeR, since this variable could be related to others non-observables such as extreme climatological events, increased anthropogenic activity linked to the occurrence of fires, differentiated suppression actions or poor incident management, as indicated by Fernandes et al. (2016).
Based on estimates, the states with the largest forest area have smaller PSeR but relatively larger SeR. The inverse relationship can be attributed to factors such as: 1) states with less forest area have forests more vulnerable to fire; 2) states with higher tree cover presumably have more area under timber management, which leads to the development of numerous activities for fuel control or improvement in the timeliness and effectiveness of the suppression activities being carried out. In any case, more research is needed on this subject, the result of which can be of great value in the planning of fire prevention and suppression activities.
The SeR, PSeR and IPSeR indicators are practical tools for estimating the occurrence of large fire effects. The three indicators can be recalculated year by year on the basis of new fire statistics and used in a public application to update such important variables in the planning of fire seasons as: 1) the estimate of the maximum area expected to be burned in each state or region; 2) the expected burned area at the beginning of the season and which can be used as an early warning approach and a tool for planning fire prevention and control activities; 3) the prioritization of regions according to their risk to suffer large damage, which is a tool for budgeting of central planners; and 4) the estimation of priorities for fire prevention and fire management activities, which results from the potential that IPSeR has for estimating fuel accumulation.
The analysis of frequency distributions of fire sizes is an area of study that can provide more information about the dynamics of these events and their impact on the environment and society. Topics such as the dynamics of joint distributions of surface and number of fires or the analysis of the spatial and temporal distribution of such distributions, undoubtedly, open up a wide space for research.
Conclusions
The distribution of the sum of areas affected by forest fires year on year in a state can be modeled with an asymmetric distribution. The lognormal model was the model that best adjusted such distributions. The area at risk (SeR) approximates the forest area potentially affected by forest fires with a certain level of probability. The SeR can be transformed in proportion of the area potentially affected (PSeR) by forest fires and both indicators are useful for the annual planning of fire prevention and suppression activities. In addition, the study showed that the SeR and its trend indicator (ISeR) are good predictors of the area expected to be burned in the next year. This makes SeR not only an indicator of risk, but also an approximate variable of a short-term hazard index.

