


 texto en
  Inglés (pdf)
 Artículo en XML
 Referencias del artículo
 Enviar artículo por email
 Citado por SciELO
  Similares en
SciELO
Similares en
SciELO 
 Permalink
Introduction
Teak (Tectona grandis L. f.) is one of the main exotic species used in reforestation programs in the Coastal region of Ecuador, due to both its adaptability to local ecosystems and the high demand in the global timber market. In this region, 9 368 ha of teak plantations were reported in 2018 (Ministerio de Agricultura y Ganadería [MAG], 2018), with an increasing trend in the coming years, which has motivated interest in the development of monitoring techniques to implement more accurate and efficient inventory methods (Aguilar, Rivas, Nemmaoui, Peñalver, & Aguilar 2019a; Aguilar, Nemmaoui, Peñalver, Rivas, & Aguilar, 2019b).
Information requirements for timber and other raw material harvesting, quantification of biomass production, carbon fixation and environmental management are relevant objectives of forest inventories. Statistical inference techniques from sampling are used to obtain these data (Kershaw, Ducey, Beers, & Husch, 2016). A relevant aspect in the design is the definition of the type of sampling unit. The usual practice is the fixed area and shape plot, where the selection of trees is directly related to the area and shape of the plot, as well as to the frequency of the individuals that make up the plot (Kershaw et al., 2016). In this sense, the fixed area sampling method has an equal probability of selection for each tree present in the reference plot (Ríos, Acosta, Gaillard de Benítez, & Pece, 2000). This type of sampling requires physically delimiting the reference plot and measuring the dendrometric variables of all the trees included in it, which can be costly in terms of fieldwork time. For this reason, other alternative inventory methods based on sampling with different selection probabilities have been developed, most notably the so-called probability proportional to size (PPS) sampling. In this case, the probability that a tree is selected to make up the sample is proportional to some of its measurable characteristics (Cochran, 1977) such as diameter in horizontal sampling or height in vertical sampling.
The angular sampling method, also known as the Bitterlich method after Austrian foresters Walter Bitterlich (Bitterlich, 1952; Burkhart, 2008), could be classified under the category of PPS sampling. This method does not require the physical delimitation of the sampling plot or the direct measurement of the tree diameter for the estimation of the basal area per hectare (G; m2·ha-1) (Burkhart, 2008); the probability of selecting a tree is proportional to its basal area. To determine G at each sampling point, the trees (n), whose normal diameters (d1.3) exceed a fixed critical angle (projected from the sampling point with an instrument called a relascope), are counted and multiplied by the basal area factor (BAF), which depends on the chosen critical angle (Kershaw et al., 2016).
Numerous applications of the Bitterlich method in various forestry contexts have been documented, highlighting its advantages and disadvantages in terms of accuracy and efficiency for the estimation of forestry variables (Druszcz, Nakajima, Netto, & Júnior, 2010; Gove, 2017; Lionjanga & Pereira, 2014; Mulyana, Rohman, & Purwanto, 2018; Rice, Weiskittel, & Wagner, 2014; Šmelko, 2013). However, in the practice of forest plantation inventories in Ecuador, fixed area plots of rectangular or circular shapes and variable size, between 400 and 1 000 m2, are used, but no references to the application of the angle-counting method have been documented. This method could, a priori, facilitate the development of forest inventories in teak plantations, reducing the time needed for field work and, therefore, allowing the implementation of a continuous decision making system based on forest stand monitoring. This system, complemented with techniques from the Remote Sensing discipline (e.g. Aguilar et al., 2019a), would significantly improve decision-making in forest management (economic) and protection (environmental) activities by public and private entities.
Accordingly, the objective of this research was to evaluate the accuracy and efficiency of the angular sampling method for determining dasometric variables in teak plantations in the Coastal region of Ecuador. To this end, the hypothesis that the angle-counting method is sufficiently precise and faster to implement than sampling with fixed area plots was tested.
Materials and Methods
Description of the area of study
The research work was conducted on a 78.2 ha teak plantation established on the "Las Iguanas" ranch, province of Guayas, in the Coastal region of Ecuador, located at the geographical coordinates 2° 6' 11.72" SL and 80° 2' 59.43" WL (Figure 1).
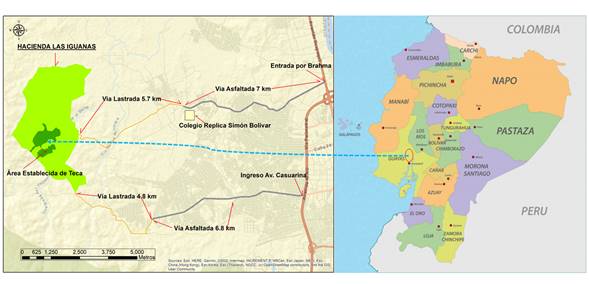
Figure 1 Location of the study site at the "Las Iguanas" farm, province of Guayas, cantón Guayaquil in Ecuador. Geographic coordinates 2° 6' 11.72" SL and 80° 2' 59.43" WL.
The study area is located in the bioclimatic zone known as the Tropical Dry Forest, which has a unimodal rainfall regime with a rainy period in the first quarter of the year (average rainfall of 1 222 mm) and a marked drought in the rest (Instituto Nacional de Meteorología e Hidrología [INAHMI], 2017). The average temperature is 24.4 °C and the relative humidity is 72.9 % (Flores, Cabezas, & Crespo, 2010). The teak plantation was established in 2015, with a frame of 3 m between trees and 4 m between lines. The plants were four months old at the time of planting, with an approximate height of 30 cm. The plants were produced in a nursery from scarified seeds from Costa Rica.
Sample design
During the months of March and April 2018, 21 fixed area plots were established in the teak plantation (Figure 2), under the simple sampling method without replacement. The plots were circular in shape with a radius of 12.62 m (area of 500 m2).

Figure 2 Location of the teak (Tectona grandis) plantation on the "Las Iguanas" farm, Guayas province, Guayaquil canton in Ecuador. Distribution of the 21 fixed area plots established in this study.
The plot size used is within the range recommended by White et al. (2013); i.e. between 200 and 625 m2 in order to ensure a correct stratification of the plots in the area of interest to cover, as far as possible, their range of structural variability. However, as it is a homogeneous plantation with an age at the time of sampling of 3 years (young plantation), with a fixed frame, similar silvicultural management and soil characteristics, the variability between plots in relation to some dasometric variables of interest was very low (Table 1). The number of experimental plots for sampling was determined following the proposal of Kershaw et al. (2016) given by the following equation:
where,
CV |
expected coefficient of variation for the variable to be estimated (basal area) within the work area (%) |
Er |
assumable error in the estimation (%) |
t |
value of the Student t for P < 0.05 |
In this case, and taking into account the homogeneity of the teak plantation, conservative values of CV = 46 % and Er = 20 % were adopted. The a posteriori CV for the basal area dasometric variable was found to be 30.8 % (Table 1), which implies that the final assumable error was lower than 14 % when 21 sampling plots were used. On the other hand, the sampling intensity was 1.35 %, which was considered appropriate considering the homogeneity of the plantation.
Table 1 Average characteristics of the 21 fixed surface plots (circular area of 500 m2) established on the teak plantation. The age of the plantation at the time of sampling was 3 years.
| Statistical | Density (tree·ha-1) | Basal area (m2·ha-1) | Average Lorey´s height (m) |
|---|---|---|---|
| Average | 736.2 | 4.12 | 8.0 |
| Standard deviation | 83.66 | 1.27 | 1.32 |
| Coefficient of Variation (%) | 11.34 | 30.88 | 16.45 |
The coordinates of the plot centers were recorded by GPS-RTK procedures in the WGS84 reference system and UTM 17S projection, using Trimble R8 GNSS equipment (Trimble Inc., Sunnyvale, CA, USA). Each tree in the sampling plots was numbered, recording absolute coordinates and dendrometric variables such as diameter at breast height (DBH) and total height. The time (min) required for the establishment of the tree sampling and measuring unit was also recorded, including the time for estimating the basal area per hectare using the Bitterlich method for BAF = 1. This value was determined by calculating the ratio between the average basal area per hectare, obtained from the inventory data based on the fixed area method (in this case G = 4.12 m2 ·ha-1 ), and the average number of trees sampled by angle sampling on each reference plot. This average value of trees sampled was close to four for the relascope used, which is in line with the recommendations of Kershaw et al. (2016) and Iles (2003) for open plantations and small size trees.
In each fixed area plot the tree density (N; tree·ha-1 ), normal tree diameter of average basal area (dg; cm), total basal area (G; m2 ·ha-1 ), average Lorey height (hL; m) and total volume (V; m3 ·ha-1 ) estimated by Lara's (2012) formula were calculated. In the angular sampling method the same dasometric variables were estimated, but in this case extracted from the partial sample of trees selected for each of the BAFs evaluated. The normal diameter and height of each selected tree were also measured for the estimation of the dasometric variables of interest using the following expressions (Kershaw et al., 2016):
where,
n |
number of trees selected by angle sampling (variable for each plot and BAF) |
N |
number of trees per hectare |
gi, hi and di |
basal area, total height and normal diameter, respectively, of the selected tree i. |
Finally, the time (minutes) of field execution for the tree count in the angle sampling unit with BAF = 1 was recorded. Similarly, the working times by type of measurement in the fixed area plot (times of the survey and delimitation of the circular plot, tree count and measurement of its diameter and height) were recorded.
Simulation of Angle Sampling
From the coordinates of the center of each circular plot of fixed area, the distance from the center to each tree of the sampling unit was determined using the electronic Excel® tabulator.
The critical distance (Dcritical) corresponding to the diameter of each tree was calculated for each BAF. The Dcritical refers to the maximum distance between the observer and the observed tree where it can be seen exactly that the normal tree diameter is larger than the scanning angle or critical angle of the relascope (Jerez, Vincent, Moret, & Quevedo, 2005). In this way, for each normal diameter (DBH, cm) a Dcritical (m) can be established, from which the tree would not be selected to form part of the sample obtained by angular sampling and whose equation is given by the following expression
For the evaluation of the angular sampling, BAFs of 0.5, 1.5 and 2 were chosen, according to the range of normal diameters found in the plantations. Figure 3 shows that the probability of finding trees with diameters larger than 14 cm is nil, so that the value of Dcritical to the tree furthest from the center of the plot for each simulated BAF should not exceed the radius of the circular fixed area plot (12.64 m). For example, for a BAF = 0.5, the Critical value for a tree with DBH = 14 cm would be 9.9 m, lower than the 12.64 m radius of the plot.
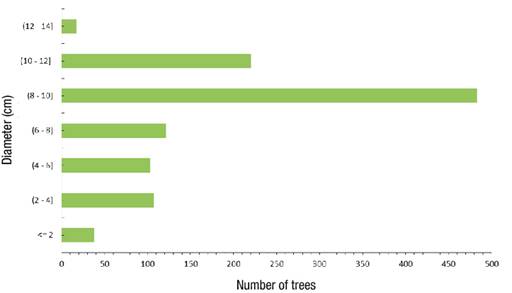
Figure 3 Frequency histogram of the distribution of normal diameters of Tectona grandis in the reference plots.
For the evaluation of the accuracy and efficiency of the angle sampling method, the dasometric variables were calculated by the simulation procedure described for each of the selected BAFs (0.5, 1.5 and 2) and the estimates of these variables on the fixed area and angle sampling field plots (BAF = 1) were compared.
The simulated time values were obtained from the time measurements on the fixed area based inventory plots and the angle sampling plots with BAF = 1 (chain relascope). These values were converted into unit times per tree and measurement type so that they could be applied for the simulation of the field run times for BAF 0.5, 1.5 and 2.
The relative efficiency (e) of the Bitterlich method was determined for surface and fixed plot sampling, using the procedure described by Jordan, Ducey, and Gove (2004), Kershaw et al. (2016) and Kenning, Ducey, Brissette, and Gove (2017):
where,
Sx1 |
standard error (%) for a sample unit as a basis for comparison |
Sx2 |
standard error (%) for the sample unit to be compared |
t1 |
time to carry out the reference sample unit |
t2 |
time to carry out the compared sample unit. |
e > 1 indicates that sampling unit 2 (BAF 0.5, 1, 1.5 and 2 angle sampling) was carried out more efficiently than sampling unit 1 (fixed area plot based reference sampling) and vice versa. This equation does not consider the travel times between sampling units.
The data generated by the simulation of the angular sampling for each of the BAFs were processed by the electronic Excel® tabulator; additionally, the values of the averages and the standard error of the dasometric variables were calculated.
Using the InfoStat statistical package (Di Rienzo et al., 2017), Kruskal-Wallis' non-parametric ANOVA was applied to contrast the differences in means between the variables under study, assuming complete randomization of the sampling units. The non-parametric approach was necessary due to the lack of data normality and homocedastic variances evidenced by the Kolgomorov and Levene tests. All tests used a P < 0.05 significance level. The contrasting sampling methods were considered as treatments or sources of variation: circular fixed area plot (control, PC); variable simulation area plot with BAF = 0.5 (BAF -S 0.5); variable simulation area plot measured in field with chain relascope and BAF = 1 (BAF -C 1); variable simulation area plot with BAF = 1.5 (BAF -S 1.5); variable simulation area plot with BAF = 2 (BAF-S 2).
Results and discussion
Table 2 shows that the standard error of estimation (%) for all variables studied and for the sampling methods tested was less than 10 %. Bitterlich angular sampling, for the BAFs assessed, and fixed area and shape plot sampling had similar precision in the estimation of the dasometric variables. In this sense, ANOVA did not detect significant differences (P < 0.05) between averages of the dasometric variables by treatments or types of sampling plots.
Table 2 Descriptive statistics of Tectona grandis and statistical significance of ANOVA for the dasometric variables measured on the 21 reference plots.
| Variable | Statistical | Treatments | ||||
|---|---|---|---|---|---|---|
| PC | BAF-S (0.5) | BAF-C (1) | BAF-S (1.5) | BAF-S (2) | ||
| Total basal area (m2·ha-1) | Mean | 4.12 a | 4.67 a | 4.57 a | 4.57 a | 4.76 a |
| Standard error (%) | 6.74 | 7.77 | 7.78 | 7.33 | 7.38 | |
| Time (min) | 36 c | 10 b | 5 a | 5 a | 4 a | |
| Relative efficiency | 1.00 | 2.67 | 5.32 | 6 | 7.4 | |
| Density (trees·ha-1) | Mean | 736.2 a | 815.2 a | 886.9 a | 807.8 a | 890.9 a |
| Standard error (%) | 2.48 | 5.16 | 9.61 | 7.72 | 10.57 | |
| Time (min) | 15 c | 14 c | 7.5 b | 6 ab | 5 a | |
| Relative efficiency | 1.00 | 0.25 | 0.13 | 0.26 | 0.17 | |
| Normal tree diameter of mean basal area (cm) | Mean | 7.9 a | 8.5 a | 8.8 a | 8.8 a | 8.7 a |
| Standard error (%) | 3.68 | 4.04 | 4.67 | 4.60 | 4.41 | |
| Time (min) | 36 c | 20 b | 8 a | 7 a | 5.5 a | |
| Relative efficiency | 1.00 | 1.50 | 2.80 | 3.29 | 4.57 | |
| Average Lorey height (m) | Mean | 8.0 a | 8.2 a | 8.1 a | 8.1 a | 8.1 a |
| Standard error (%) | 3.59 | 3.56 | 3.72 | 3.81 | 3.75 | |
| Time (min) | 80 c | 25 b | 14 a | 9 a | 7 a | |
| Relative efficiency | 1.00 | 3.26 | 5.32 | 7.89 | 10.47 | |
| Total volume (m3·ha-1) | Mean | 22.4 a | 25.5 a | 24.7 a | 24.9 a | 25.7 a |
| Standard error (%) | 7.63 | 8.73 | 8.67 | 8.38 | 8.13 | |
| Time (min) | 101 c | 26.5 b | 16 a | 9 a | 8 a | |
| Relative efficiency | 1.00 | 2.92 | 4.90 | 9.31 | 11.14 | |
Treatments: PC = fixed area sampling; BAF: basimetric area factor; BAF-S (0.5), BAF-S (1.5) and BAF-S (2) = simulated angle sampling for BAF 0.5, 1.5 and 2, respectively; BAF-C (1) = angle sampling executed in the field. Different letters in the mean values and in the measurement time of the dasometric variables indicate significant differences between treatments (P < 0.05).
As expected, fixed area sampling showed slightly lower standard errors than angular sampling. This was most notable for the estimation of variable density, with standard errors between two and four times higher in variable area sampling. These results are related to Kershaw et al. (2016), who state that, in general, it is more efficient to use a sampling unit where the trees are selected with a probability proportional to the variable of interest. In this sense, if the objective was to estimate the volume of a stand, it would be more efficient to use variable plot sampling (VPS), since the selection of sample trees is proportional to their basal area, a variable closely related to volume. If the objective were to determine the number of trees in a stand, it would be more efficient to use fixed area plots, as evidenced in this paper.
The results of the present work, in terms of the precision of the sampling methods, are similar to those reported by several authors both in plantation inventory and in the natural forest. In the case of plantations, Do Couto et al. (1993) determined the precision of the angular method (BAF 2, 3 and 4) vs. fixed plot in Eucalyptus saligna Sm. plantations in Brazil and found no significant differences (P < 0.05) in the estimation of the basal area per hectare. The same conclusion is reached by the results obtained by Druszcz et al. (2010) in plantations of Pinus taeda L. On the other hand, Lionjanga and Pereira (2014) tested BAF values (1, 2 and 4) against fixed area sampling for the inventory of plantations of Pinus patula Schltdl. & Cham. in Angola and observed that all the dasometric variables had similar precision, except the density which showed a value estimated by angular counting less precise than the fixed area. In the case of natural forest inventories, the results obtained in this work also coincide with those reported by Moscovich and Brena (2006) in a native forest of Araucaria angustifolia (Bertol.) Kuntze in Brazil, where they found no significant differences between several PPS methods (among them the Bitterlich method with BAF = 4) and the fixed area plot method for the estimation of commercial volume, basal area and tree density. In the same line of work, De Farias Soares, de Souza, and Leite (2002) compared estimates of dasometric variables in a tropical natural forest in Brazil using variable area plots with BAF 2, 3 and 4, and found no significant differences (P < 0.05) in the variables evaluated (basal area, average height and volume per hectare), except for tree density.
In relation to field sampling time, the variable presented significant differences (P < 0.05), pointing to the fixed area and shape plot as the sampling method that required more working time (Table 2). This result is related to relative efficiency, since, with the exception of tree density, the advantage of the angle method over the fixed area plot method was evident, especially in the case of BAF = 2, showing efficiency between 4.5 and 11 times higher than the fixed area plot method. In the case of the variable density, lower efficiencies were observed in the angular sampling, which was due, as already mentioned, to a lower precision in its estimation for any of the BAFs evaluated, although such decrease was not statistically significant.
Regarding the relative efficiency of sampling methods, Moscovich and Brena (2006) obtained similar results to those of the present work in a native forest of A. angustifolia in Brazil, while a recent work by Mulyana et al. (2018) proposed the suitability of the angular count method (BAF = 1) for basal area estimation in community forests in India. It should be noted that the BAF depends on the geometry, variability and age of the plantation, and local trials assessing relative effectiveness under different conditions are needed. In this study, for variables such as total basal area, normal tree diameter of average basal area, average Lorey's height and total volume, the ideal BAF value in young teak plantations located in the Coastal region of Ecuador was equal to two. This BAF produced sufficiently precise estimates and decreased the work time required for the field inventory (increased efficiency), as shown in Table 2.
Some authors have evaluated the method of angular sampling through computer simulations, proving to be a fast and efficient tool for comparing the performance of various BAF s. For example, Šmelko (2013) used this tool to evaluate the use of different BAFs for angle sampling, finding that the accuracy was similar in the BAFs tested and that the efficiency of the Bitterlich method was superior to the fixed area method, which is consistent with the results of this study. Using a similar procedure, both Rice et al. (2014) and Gove (2017) reported that the angle sampling method was more efficient than the fixed area method.
In general, the angular counting method or methods based on the selection of individuals with a probability proportional to the variable of interest could be used in the case of the terrestrial laser scanner or field instruments with similar characteristics. This could be a promising line of research that integrates sampling methodology with spatial information technologies to increase efficiency in obtaining forest inventories (Aguilar et al., 2019b).
Finally, it is necessary to mention that future research should validate these results by applying the angular counting method in inventory work in teak plantations of different ages, soil and climatic conditions and silvicultural management.
Conclusions
The angular counting method was accurate and faster than sampling with fixed area plots. Neither sampling method was statistically superior to the other with respect to the estimation of dasometric variables, which demonstrates that the angular counting method is sufficiently precise for the estimation of the main dasometric variables of young teak plantations in the Coastal region of Ecuador. On the other hand, the angular-count sampling method was significantly faster than the fixed-plot method. These results recommend the suitability of angle-counting as a reference method for the inventory of teak plantations in the region, which would reduce the costs of field work. In the case of young teak plantations, it is recommended that a basal area factor of 2 be used.

