


 texto en
  Inglés (pdf)
 Artículo en XML
 Referencias del artículo
 Enviar artículo por email
 Citado por SciELO
  Similares en
SciELO
Similares en
SciELO 
 Permalink
Introduction
Environmental damage, caused by the extraction and use of fossil fuel processes, has generated the need to use less harmful energies such as renewable sources, among which are bioenergetics. These products can be obtained from energy crops, wood from forests, residues from agricultural and forestry processes, and human or animal waste (Hernández-Rodríguez & Hernández-Zárate, 2008).
In Mexico, in the central area of the state of Veracruz, there is potential demand for sugarcane (Saccharum officinarum L.) production for bioenergy purposes (Secretaría de Agricultura, Ganadería, Desarrollo Rural, Pesca y Alimentación [SAGARPA], 2009); likewise, oilseeds such as jatropha (Jatropha curcas L.) and moringa (Moringa oleifera Lam.), which do not compete with food security and can be grown in this area, are recommended for such purposes (Noda-Leyva, Pérez-Vázquez, & Valdés-Rodríguez, 2015). However, the expansion of agriculture for bioenergy production in Mexico and the world is a controversial issue because modifications in plant cover and land-use can alter climatic systems at the local or regional level. For this reason, such modifications are taken as a reference for environmental monitoring, planning programs and climate change assessment (Instituto Nacional de Estadística Geografía e Informática [INEGI], 2015).
Assessing environmental variables at local, regional and global levels requires numerical models applied to the climate system in order to estimate the possible effects that human activities would have on the environment’s current state (Intergovernmental Panel on Climate Change [IPCC], 2014). As a reference, there are studies that use numerical models to estimate the effects generated by the planting of bioenergy crops, and they demonstrate that the introduction of crops can modify the climatic conditions of the sites where they are established (Caiazzo et al., 2014; Georgescu, Lobell, & Field, 2009; Georgescu, Lobell, Field, & Mahalov, 2013; Hallgren et al., 2013; Khanal, Anex, Anderson, & Daryl, 2013).
In this context, the objective of this study was to analyze the climatic variables of temperature and rainfall through the simulated replacement of the current vegetation with three bioenergy crops (sugarcane, jatropha and moringa) in the central region of the state of Veracruz, Mexico. The analysis was made with the Regional Climate Model (RegCM) version 4 (RegCM4). This model is important in climate study, since it has a regional focus; in addition, it has the advantage of being free-to-access and is feasible to install in medium level computer equipment, thus it can be used in developing countries or countries with limited economic resources (Elguindi et al., 2013).
Materials and methods
Study area
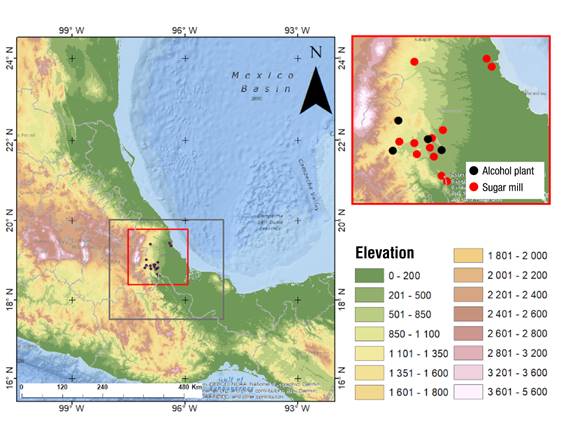
The study area is located between geographical coordinates 18.6° and 19.8° N and 97.4° and 96.0° W. It covers an area of 20 328 km2 in the central mountainous region of the state of Veracruz, Mexico. Twelve sugar mills and four alcohol plants are located in the area (Figure 1). The four alcohol plants produce ethanol for sale as fuel in the Veracruz-Boca del Río urban area (Agüero-Rodríguez, Tepetla-Montes, & Torres-Beristaín, 2015). Based on the above, it is deduced that the study area has a potential demand for sugarcane, jatropha and moringa production for bioenergy purposes, which in turn could also encourage the production of biodiesel, as has been proposed by SAGARPA (2009).
RegCM4
Mexico currently has no information related to the implementation of RegCM4 for assessing land-use changes; however, at the international level, there are studies on future scenarios in Africa, in the region known as the Greater Horn of Africa (Otieno & Anyah, 2012), in three Himalayan glaciers (Zaman, Waqas, & Rasul, 2011) and in China (Hua, Chen, & Li, 2015).
RegCM4 is a regional climate model developed and distributed by the International Centre for Theoretical Physics (ICTP). RegCM4 was the first limited area model for studying long-term climate, which is why this methodological approach was used in this study.
The model is mainly composed of three stages: pre-processing, numerical integration and post-processing. The land-surface characteristics and processes are represented by a biosphere-atmosphere transfer scheme (BATS), which consists of describing the vegetation-soil interaction in the energy, momentum and water transfers between the surface and the atmosphere (Dickinson, Henderson-Sellers, & Kennedy, 1993). With the BATS scheme, a land cover type is assigned to each point of the model mesh. Currently, RegCM4 considers 22 land-use and vegetation classes (Table 1), taken from BATS modifications and updates, although two types have also been added, which are urban and suburban environments. This is because such environments modify not only the albedo and the surface energy balance, but also create impermeable surfaces with large effects on runoff and evapotranspiration (Elguindi et al., 2013).
Table 1 Land-use and vegetation of the regional climatic model RegCM4.
| Class | Land-use and vegetation | Class | Land-use and vegetation |
|---|---|---|---|
| 1 | Agriculture/mixed crops | 12 | Ice cap/glaciers |
| 2 | Grasslands | 13 | Bog |
| 3 | Perennial needleleaf tree | 14 | Inland water |
| 4 | Deciduous needleleaf tree | 15 | Ocean |
| 5 | Deciduous broadleaf tree | 16 | Evergreen shrub |
| 6 | Perennial broadleaf tree | 17 | Deciduous shrub |
| 7 | Tall grass | 18 | Mixed woodland |
| 8 | Desert | 19 | Forest/Field mosaic |
| 9 | Tundra | 20 | Water and land mixture |
| 10 | Irrigated agriculture | 21 | Urban area |
| 11 | Semi-desert | 22 | Suburban area |
Sequence for land-use allocation and simulations
Step 1
Current land-use and vegetation of the study area were obtained from INEGI's series V land-use and vegetation map (LUVC) (2015), which represents the spatial distribution of natural and induced vegetation types, and agricultural areas. This map has more than 60 classes of land-use for the Mexican territory; it was developed from remote sensing and supported with field verification between 2011 and 2013. Using data from the BATS cartographic information of the RegCM, the study region areas contained in the LUVC were reclassified into the classes considered by the model (Table 1).
Step 2
The selection of the period is a requirement to be able to start with the future scenarios. The period covered from 2000 to 2010 and was selected on the basis of the availability of both climate (temperature and rainfall) and cartographic (LUVC) information, the latest updates of which are only available up to 2010.
Step 3
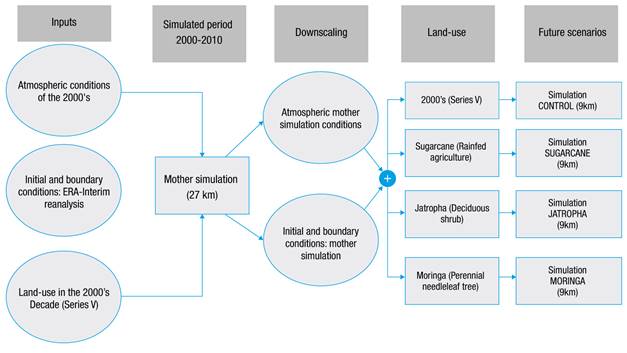
The first approach, known as the mother domain (Figure 1), consists of a domain that covers a large part of Mexico and simulates the atmospheric conditions of the selected period (2000-2010); the spatial resolution was 27 km and the temporal resolution every three hours. Initial and boundary conditions were provided through ERA-Interim reanalysis data with a 1.5° x 1.5° spatial resolution and a six-hourly temporal resolution. These data were selected because they present a considerable improvement in the hydrological cycle description, atmospheric circulation quality and meteorological fields (Dee et al., 2011).
Step 4
After the simulation of the mother domain, the dynamic scale was downscaled to eliminate potential errors due to abrupt orographic changes and to allow the model to represent these changes more accurately (Önol, 2012). The downscaling technique consists of using the information generated by the mother domain to establish the initial and boundary conditions required by the simulations with sugarcane, jatropha and moringa crops, plus current land-use conditions, identified as the control. The control simulation was made with the land-use and vegetation that INEGI's mapping (2015) provides (step 1). All four new simulations had a spatial resolution of 9.0 km and the same simulated period as that of the mother domain. The process flow chart is shown in Figure 2.
Step 5
To simulate the introduction of the crops, it was necessary to reclassify the current land cover into the corresponding classes available in the RegCM (Table 1). For this purpose, the "irrigated agriculture" class was assigned to sugarcane, because in the study region, an irrigation system must be in place for sugarcane production during the November-April period, since in this period only 10 % of the annual rainfall required for the crop is available (Comité Nacional para el Desarrollo Sustentable de la Caña de Azúcar [CONADESUCA], 2015). The "deciduous shrub" type was assigned to the jatropha crop, since this plant has shrub characteristics, such as short stems and lobe-shaped leaves that remain for seven to eight months (Teniente et al., 2011). In the case of moringa (7 to 12 m high), the "perennial needleleaf tree" type was assigned (Pérez, Sánchez, Armengol, & Reyes, 2010).
Data analysis
Four regions were considered in the data analysis. These regions had to have the greatest contrast with respect to the change in land-use and vegetation, and climatological information close to the time of the substitution of the three crops, in order to determine the behavior of the environmental temperature and rainfall. According to INEGI's cartographic description (2015), the zones were the following: region 1, which is characterized by being allocated for agricultural use; region 2, which represents zones with perennial needleleaf trees; and regions 3 and 4, where diverse forests and irrigated agriculture are located, respectively. Subsequently, the monthly climatology of each simulation was obtained to make the climatological variability comparison derived from the substitution of each of the three crops in the four regions.
Study region model calibration and validation
For the best model performance, the bias of the environmental temperature and rainfall variables was corrected. For temperature, the Piani et al. (2010) methodology was used by means of the following equation:
where
Rainfall was fitted with the Ines and Hasen (2006) technique:
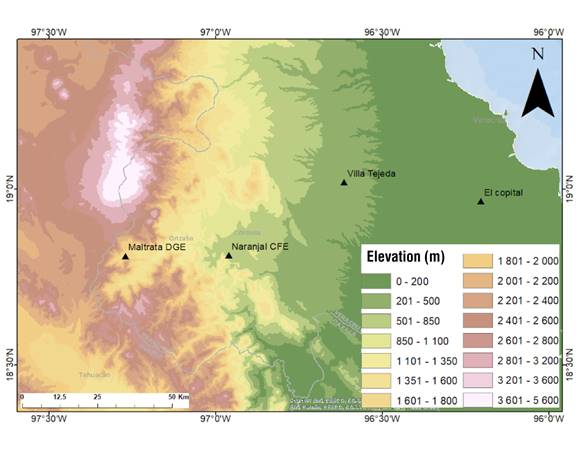
In order to evaluate the model’s results, the control simulation was compared to the data observed at four weather stations located within the regions analyzed: Villa Tejeda (region 1), Maltrata (region 2), Naranjal (region 3) and El Copital (region 4) (Figure 3). These stations belong to the National Meteorological Service (Comisión Nacional del Agua [CONAGUA], 2010) and were selected for their proximity to the study areas (less than 5.0 km) and because they have the largest number of data recorded during the analysis period. The differences between the two data sets were determined by the mean square error (MSE), the formula for which is as follows:
where S i and O i represent the simulated and observed data, respectively, and n indicates the total number of data in each set. This technique is used in climatology because it allows evaluating the performance of numerical models; large MSE values indicate greater differences between data sets (Bonilla-Ovallos & Mesa, 2017). Additionally, the root-mean-square error was used to determine value thresholds that allow evaluating the good performance of a model (Andrade & Blacutt, 2010).
Results and discussion
Validation of the RegCM4
Figure 4 illustrates the results of the environmental temperature simulations. In region 1, RegCM4 obtained data similar to those observed, as the largest differences were of 1 °C. For region 4, the model was able to adequately simulate temperature for almost the entire year, having a small overestimate of only 0.3 °C in October and November. In contrast, for region 3, the MSE increased by almost three units (Table 2), resulting in a maximum difference of 2.0 °C between actual and simulated data. For region 2, the MSE increased more than 20-fold, resulting in differences of up to 6 °C between observed and simulated temperatures.
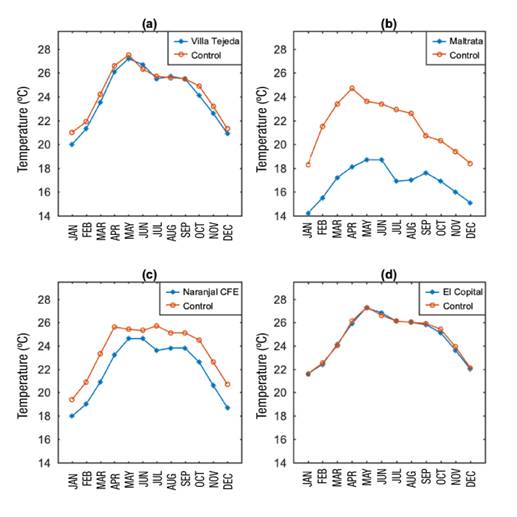
Figure 4 Comparison graphs between the information of the selected stations in the state of Veracruz and the results of the control simulation (current situation: INEGI’s series V land-use and vegetation map [2015]) with RegCM4, with respect to environmental temperature: a) region 1, b) region 2, c) region 3 and d) region 4.
According to Figure 5, in regions 1, 2 and 4, the model overestimated the monthly rainfall accumulated throughout the annual cycle; otherwise it was recorded in region 3, where the model underestimated the rainfall for the summer months (June, July and August). It should be noted that the model detected a heatwave at the Maltrata, El Naranjal and El Copital (regions 2, 3 and 4, respectively) stations; however, the control data only showed a moderate heatwave in Maltrata (region 2). Additionally, in regions 1, 3 and 4, the model simulated rainfall peaks in September and October, which resulted in a lag in relation to the control data.
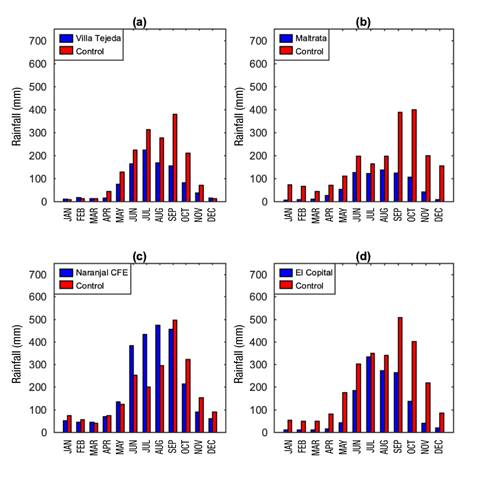
Figure 5 Comparison of the information from the selected stations in the state of Veracruz and the results from the control simulation (current situation: INEGI’s series V land-use and vegetation map [2015]) with RegCM4, regarding rainfall: a) region 1, b) region 2, c) region 3 and d) region 4.
In the four regions, the MSE of the rainfall variable had values greater than 7 000 units, while the root-mean-square error (RMSE) was greater than 60 units (Table 2); according to Andrade and Blacutt (2010), the value 60 is considered as a reference threshold to determine that the model fails to adequately simulate this variable. The opposite resulted for temperature, where the RMSE was below five units. In this regard, research by Fuentes-Franco, Coppola, Giorgi, Graef, and Pavia (2014), Pal et al. (2007) and Ali, Li, Congbin, and Yang (2015) conducted in regions of Mexico, South Africa, South America, South Asia, and China, respectively, indicated that the RegCM shows greater biases in complex orography areas, such as those evaluated in this research. Based on the above, the RegCM is considered to present problems when simulating the rainfall behavior in regions with very marked elevation gradients. In this sense, it should be emphasized that in the study zone, elevations vary from sea level to almost 2 000 m; the El Copital and Villa Tejeda weather stations are located below 350 m (14 and 348 m, respectively), whereas the Maltrata and Naranjal stations are above 900 m (1 713 and 967 m, respectively). According to the results and references cited, it is considered that the model did not adequately simulate the conditions of the study sites for the rainfall variable.
This condition is not unique to the RegCM, since Andrade and Blacutt (2010), in their study conducted in Bolivia, found that the PRECIS regional climate model performs better when simulating temperature and rainfall in low areas (<500 m) than in intermediate (500 to 3 500 m) and high areas (>3 500 m). Therefore, it is considered that, in sites with high variations in elevation, the estimation of temperature and, especially, of rainfall generates problems of bias in these climate models.
Table 2 Results of the mean square error (MSE) and the root-mean-square error (RMSE) of RegCM4, for the selected weather stations in the state of Veracruz.
| Region | Weather station and code | Months with data | Temperature | SD | Rainfall | SD | ||||
|---|---|---|---|---|---|---|---|---|---|---|
| MSE | RMSE | Obs | Sim | MSE | RMSE | Obs | Sim | |||
| 1 | Villa Tejeda 30364 | 111 | 0.30 | 0.55 | 2.32 | 2.07 | 7 876.10 | 88.75 | 73.34 | 128.14 |
| 2 | Maltrata 30100 | 62 | 24.3 | 4.93 | 1.35 | 2.07 | 18 776.69 | 137.03 | 51.85 | 112.05 |
| 3 | Naranjal 30115 | 122 | 3.14 | 1.77 | 2.30 | 2.13 | 10 246.73 | 101.23 | 170.98 | 131.78 |
| 4 | El Copital 30048 | 109 | 0.03 | 0.16 | 1.86 | 1.83 | 17 614.80 | 132.72 | 116.32 | 152.74 |
SD = standard deviation of the mean; Obs = Observed; Sim = Simulated.
In this study, temperature was the variable with the greatest capacity to be adequately simulated with RegCM4, while rainfall showed strong intensity and magnitude biases at all sites. This coincides with the results of Sanabria, Marengo, and Valverde (2009), Camargo-Bravo and García-Cueto (2012), Fuentes-Franco et al. (2014), Hassan et al. (2014), and Ji and Kang (2015), who concluded that temperature can be simulated more adequately. In contrast, Tiwari et al. (2015) indicate that the best simulated variable is rainfall, although this may be due to orographic traits at the study sites.
Temperature and rainfall simulation from crop introduction
Figure 6 shows the environmental temperature simulations with RegCM4 for each crop. Regions 1 and 4 show the largest temperature variation with respect to current land-use. In this sense, the sugarcane crop (rainfed agriculture), for January to May, causes cooling of the area (0.7 °C); subsequently, from June to December its behavior is similar to the control (with smaller than 0.3 °C variations). Such cooling coincides with what was found by Lobell, Bala, and Duffy (2006); Kueppers, Snyder, and Sloan (2007); Sacks, Cook, Buenning, Levis, and Helkoski (2009); and Marcella and Eltahir (2014), who state that cooling is caused by increased soil moisture and albedo, caused by the irrigated crop, which generates changes in the latent and sensitive heat fluxes (Mahmood et al., 2014; Pielke et al., 2007). For jatropha (deciduous shrub) and moringa (perennial needleleaf tree) crops, the behavior in relation to sugarcane is reversed from June to December with a maximum cooling of 0.5 °C. This cooling is due to the contrast with bare areas allocated for crops, compared to vegetated areas that have denser foliage and greater root depth, which causes an increase in evapotranspiration and a decrease in sensible heat (Pielke Sr. et al., 2007). For regions 2 (perennial needleleaf trees) and 3 (mixed forest), as they are areas with tree vegetation, changes in temperature would be between 0.1 and 0.2 °C because jatropha and moringa crops are also tree species, which in case of substituting the original vegetation would have a similar behavior.
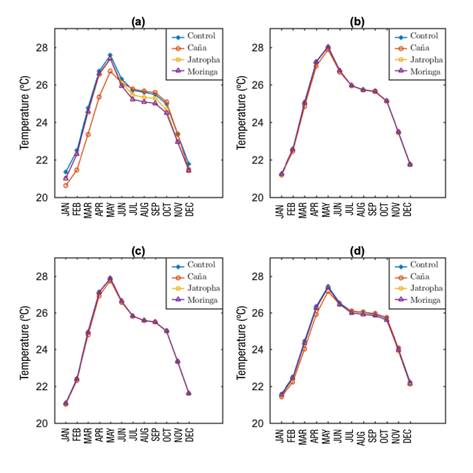
Figure 6 Comparison of the temperature obtained in the simulations with RegCM4 for each crop with respect to the control (current situation: INEGI’s series V land-use and vegetation map [2015]) in the four selected regions of the state of Veracruz. Current control situation: a) region 1 = agriculture/mixed crop (Villa Tejeda), b) region 2 = Perennial needleleaf trees (Maltrata), c) region 3 = mixed forest (Naranjal) and d) region 4 = irrigated agriculture (El Copital).
Figure 7 shows precipitation comparisons among crops. Even though the model did not adequately simulate this variable, the results were congruent with the vegetation types evaluated, since, in region 1, the model with sugarcane (irrigated agriculture) produced the highest rainfall from January to June with an average increase of 21 mm over the control. This result directly correlates with the increase in soil moisture, which causes greater evapotranspiration and upward movement of the low troposphere, leading to higher rainfall (Zhao, Fang, Cui, & Huang, 2012). For the other regions (2, 3 and 4), rainfall would have a maximum variation of 6.4 mm with respect to the control. In the case of moringa and jatropha, there would be a 7.0 mm increase in rainfall caused by the greater vegetation cover and soil moisture that can be evapotranspirated, which generates greater humidity in the atmosphere, causes greater convective activity and, therefore, greater precipitation (Mahmood et al., 2014; Pielke Sr. et al., 2007). This coincides with what is indicted by several authors, that the greater the amount of vegetation cover, the greater the precipitation (Lee & Berbery, 2015; Malhi et al., 2008; Pitman, Narisma, Pielke Sr., & Holbrook, 2004; Salazar et al., 2016).
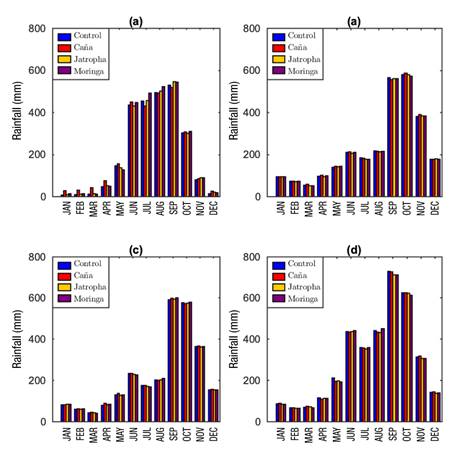
Figure 7 Comparison of the rainfall obtained in the simulations with RegCM4 for each crop with respect to the control (current situation: INEGI’s series V land-use and vegetation map [2015] in the four selected regions of the state of Veracruz. Current control situation: a) region 1 = agriculture/mixed crop (Villa Tejeda), b) region 2 = Perennial needleleaf trees (Maltrata), c) region 3 = mixed forest (Naranjal) and d) region 4 = irrigated agriculture (El Copital).
Based on Table 3, when comparing each region and each crop for the winter and summer seasons, it was determined that the greatest variation in temperature and rainfall would occur in regions 1 and 4. Of the three species, jatropha turned out to be the crop that would cause the least climatic variation, since it is the plant with the greatest leaf area and land cover, traits that help to conserve surface relative humidity (Salazar et al., 2016). The opposite is shown for the sugarcane crop, which causes the greatest variation in temperature and rainfall. On the other hand, moringa has a smaller leaf area and causes more radiation to reach the surface, because it is a tree with small, thin leaves, which results in greater variations in temperature and rainfall than with jatropha. It is important to mention that although the temperature variation is less than 1 °C, authors such as Georgescu et al. (2013), Hallgren et al. (2013) and Khanal et al. (2013) state that even these small climatic variations could cause adverse effects at both, the local and mesoscale level.
Table 3 Temperature and rainfall differentials in winter and summer, obtained with the simulated introduction (RegCM4) of sugarcane, jatropha and moringa crops in four regions of the state of Veracruz.
| Region | Weather station | Current land-use* | Land-use change | Temperature (°C) | Rainfall (mm) | ||
|---|---|---|---|---|---|---|---|
| Winter | Summer | Winter | Summer | ||||
| 1 | Villa Tejeda | Agriculture/ mixed crop | sugarcane | -0.7 | -0.1 | +19 | -3 |
| jatropha | -0.3 | -0.3 | +3 | +3 | |||
| moringa | -0.3 | -0.5 | +5 | +17 | |||
| 2 | Maltrata | Perennial needleleaf tree | sugarcane | -0.1 | NC | -1 | -1 |
| jatropha | -0.1 | NC | NC | -6 | |||
| moringa | -0.1 | NC | NC | -4 | |||
| 3 | Naranjal | Mixed forest | sugarcane | NC | NC | +1 | -1 |
| jatropha | NC | NC | NC | -2 | |||
| moringa | NC | NC | +1 | -2 | |||
| 4 | El Copital | Rainfed agriculture | sugarcane | -0.3 | NC | +1 | -13 |
| jatropha | -0.1 | -0.1 | -3 | -5 | |||
| moringa | -0.1 | -0.1 | -2 | +10 | |||
*Current land-use is that provided by INEGI’s series V land-use and vegetation map (2015); land-use change is the replacement of current vegetation by the three bioenergy crops (sugarcane, jatropha or moringa). NC indicates that there is no change in temperature or rainfall between the existing land-use and the one replaced by sugarcane, jatropha or moringa.
Conclusions
In the central region of the state of Veracruz, the substitution of the current vegetation by sugarcane, jatropha and moringa crops may cause environmental variations. According to RegCM4, regions with soils devoid of their natural vegetation, such as agricultural ones, would have the greatest climatic variability. In such soils, jatropha and moringa would be the crops causing the least contrast in both temperature and rainfall, whereas sugarcane would produce the greatest difference in both variables. According to the above, the introduction of moringa or jatropha for bioenergy purposes would be a low climate impact alternative, while sugarcane is not considered suitable for these purposes due to the greater adverse climate impact it would have in the region.

