


 texto en
  Inglés (pdf)
 Artículo en XML
 Referencias del artículo
 Enviar artículo por email
 Citado por SciELO
  Similares en
SciELO
Similares en
SciELO 
 Permalink
Introduction
Protected Natural Areas (PNA) have been considered as a tool for the conservation of ecosystems, their related ecological processes and their derived environmental services (Chape, Harrison, Spalding, & Lysenko, 2005; Pretty & Smith, 2004). Over the past century and to date, the area of protected land in the world has increased considerably; it shifted from 0.7 % in 1979 to 12.7 % in 2003, and 14.7 % in 2016 (Chape, Blyth, Fish, Fox, & Spalding, 2003; International Union for Conservation of Nature [IUCN], 2016). One of the main types of PNAs are the Biosphere Reserves (BR), which have distinguished themselves by promoting the well-being and development of communities in harmony with the conservation of biological diversity and ecosystem integrity (Ervin, 2003). In this sense, Mexico is among the leading countries as it has 44 BRs, which together cover an area of 777 615 km2 (Comisión Nacional de Áreas Naturales Protegidas [CONANP], 2019). However, due to social and environmental pressures affecting PNAs and, in particular those falling on BRs, these reserves face processes such as deforestation, invasion of exotic species, and forest fires (Figueroa, Sánchez-Cordero, Illoldi-Rangel, & Linaje, 2011; Pérez-Vega et al., 2016). In the deforestation scenario, the process of change in land cover and use (CLCU) is one of the main threats to biodiversity conservation (Figueroa, Sánchez-Cordero, Meave, & Trejo, 2009).
A case of particular interest is that of the oak (Quercus sp.) forests. These forests constitute one of the most important groups of woody plants in the northern hemisphere (Valencia, 2004), and are recognized for their ecological and economic importance worldwide (Martínez-Cruz, Téllez, & Ibarra-Manríquez, 2009; Olvera-Vargas & Figueroa-Rangel, 2012; Villaseñor, 2004). Mexico is among the nations with the highest diversity of Quercus species and it is estimated that 68 % of oaks in the Americas (161 species) are found only in this country (Arizaga, Cruz, Cabrales, & González, 2009). Moreover, in Mexico, these forests are distributed in a small area (2.9 to 5.5 % of the country’s total area; Rzedowski, 2006), which corresponds to a low percentage of the land set aside a for conservation in Mexico (3.77 % [457 067 ha]; Bezaury-Creel & Gutiérrez, 2009), so it can be said that these ecosystems are extremely vulnerable to deforestation.
To address this situation, it is recommended to identify the threats and factors affecting ecosystems (Ervin, 2003), based on the differentiation between biophysical and socioeconomic factors involved in the processes of deforestation and vegetation recovery (Crk, Uriarte, Corsi, & Flynn, 2009; Galicia, Zarco-Arista, Mendoza-Robles, Palacio-Prieto, & García-Romero, 2008; Geist & Lambin, 2002; Guerra-Martínez, García-Romero, Cruz-Mendoza, & Osorio-Olvera, 2019; Mas, Osorio, Guerra, & Maass, 2015). Deforestation is the removal of forest cover to less than 10 % of the original cover (Food and Agriculture Organization [FAO], 2002), and recovery is the re-growth of forests after a disturbance (Chazdon, 2014).
The aim of this study was to evaluate the regional dynamics of deforestation and recovery, as well as the factors of the CLCU in the oak forest in the Tehuacán-Cuicatlán region, both in the reserve's polygon and in its zone of influence. The dynamics of the CLCU was analyzed in two periods: one prior to the official declaration of the Tehuacán-Cuicatlán Biosphere Reserve (1979-2001) and one after it (2001-2011).
Materials and methods
Study area
This study was conducted in an area herein called the "Tehuacán-Cuicatlán Region" (TCR), located between the states of Puebla and Oaxaca, in south-central Mexico (Figure 1). This region includes an internal zone corresponding to the polygon of the Tehuacán-Cuicatlán Biosphere Reserve (TCBR) that covers an area of 4 910 km2, and its zone of influence which covers 6 274 km2; together they cover 20 municipalities of the state of Puebla and 31 of the state of Oaxaca. The geological, cultural, historical and landscape richness in the region is noteworthy; also, it has a high biological diversity that includes 10 to 15 % of Mexico’s flora species, out of which 365 (13.5 %) are endemic (Dávila et al., 2002). The oak forests are distributed in 21 % of the TCR area (National Institute of Statistics and Geography [INEGI], 2015), mainly in the Oaxaca portion of the Sierra Madre del Sur. This area corresponds to a minority portion of the original distribution area, with agriculture, livestock grazing, the opening of roads, and firewood extraction being the main causes of deforestation (Dávila et al., 2002; Ortíz-García et al., 2012).
Preparation of land cover/use maps
The cartographic information on land cover and use was obtained from INEGI’s land use and vegetation map series I (1979), series III (2002) and series V (2011), scale 1: 250 000 (INEGI, 2001, 2008, 2015). INEGI’s land use and vegetation classification system has 24 categories that were regrouped into six classes: oak forest, induced grassland, irrigated agriculture, rainfed agriculture, human settlements and other types of vegetation (Figure 1). The original maps were corrected by visual classification of 1995 aerial photographs at 1:80 000 scale, a 2003 QuickBird satellite image with 0.5 m spatial resolution from Google Earth platform, and a 2011 SPOT satellite image with 10 m spatial resolution. The correction was made to resolve errors due to the low resolution of the mapping and classification inconsistencies between the study dates. The interpretations were supported by a digital elevation model to identify the altitudinal distribution of the oak forest.

Dynamics of land cover and use change
The mapping overlap of land cover/use maps was made for 1979, 2001 and 2011, and the change rates among classes were calculated. The results interpretation centered on analyzing the processes of deforestation and recovery of the oak forest cover (Pontius, Shusas, & McEachern, 2004) in the period before the TCBR decree was issued (1979-2001) and the post-decree period (2001-2011). Annual change rates were obtained using the following formula (FAO, 1995):
Analysis of regional factors promoting deforestation and recovery of the oak forest
The study of the CLCU biophysical and socio-economic factors consisted of two stages. In the first stage of analysis, two biophysical variables obtained from the digital elevation model were considered, and various locality-level socioeconomic variables that were obtained from the 2000 and 2010 Population and Housing Censuses (INEGI, 2000, 2011) and from the 2000 and 2010 National Council for the Evaluation of Social Development Policy (Consejo Nacional de Población [CONAPO], 2000, 2010) (Table 1).
Table 1 Biophysical and socioeconomic variables considered in the first stage of analysis to explain the deforestation and recovery of the oak (Quercus sp.) forest in the Tehuacán-Cuicatlán Biosphere Reserve, in the 1979-2001 and 2001-2011 periods.
| Variable | Indicator | |
|---|---|---|
| Biophysical | Elevation | Terrain suitability |
| Slope | Terrain suitability | |
| Socioeconomic | Euclidean distance to localities | Accessibility to vegetation |
| Total population density | Demographic pressure | |
| Male population percentage | Migration | |
| Percentage of population over 5 years that speaks an indigenous language | Level of rootedness | |
| Marginalization index | Marginalization |
The transformation of socioeconomic variables from point format to aerial format was made with the IDW (Inverse Distance Weighting) method, which interpolates, through weighting, the data points that occur within a neighborhood; the points sampled closest to the unsampled point are more similar than those furthest away (Farfán, Mas, & Osorio, 2012).
To focus the analysis on the regional factors affecting the deforestation and recovery processes, a 5 km buffer was generated from the range of the oak forest, and a grid with 6 300 equidistant points at 1 000 m was established inside the buffer. Data were collected by cartographic overlapping of the spatial variables and obtaining information from each point. In this way, binary information (change/no change) was obtained for the analyzed periods. The relationship between biophysical and socio-economic factors with respect to oak forest deforestation and recovery was evaluated using generalized linear models (GLM) with a logit function. The resulting models were evaluated using the Akaike Information Criterion (AIC), and those with the lowest value were selected. This criterion incorporates the balance between bias and variance in the factors added to the model and provides a direct comparison between them (Burnham, Anderson, & Huyvaert, 2011).
In the second stage, historical trends of socioeconomic variables at the municipal level were analyzed (Table 2). The variables were obtained from the Population and Housing Censuses of 1970, 1980, 1999, 2000 and 2010 (INEGI, 1970, 1980, 1990, 2000, 2011), the open-access data of the Ministry of the Interior for the municipal level (Secretaría de Gobernación [SEGOB], 2018), the municipal agriculture census of 1991, and the agricultural-livestock and forestry census of 2007 (INEGI, 1991, 2007). Trends were validated with a linear regression for each analysis period (1979-2001 and 2001-2011), where dependent variables were the change rates (deforestation/recovery) of the 39 municipalities with oak forest distribution in the TCR, whereas independent variables were selected from municipal-level data.
Table 2 Municipal socioeconomic variables included in the second stage of analysis to explain the deforestation and recovery of the oak (Quercus sp.) forest in the Tehuacán-Cuicatlán Biosphere Reserve, in the 1979-2001 and 2001-2011 periods.
| Variable | Indicator |
|---|---|
| Total population | Human capital |
| Male population | Human capital |
| Migration index | Migration |
| Primary, secondary and tertiary sectors | Economics |
| Planted area | Farming-livestock activities |
| Number of livestock head | Farming-livestock activities |
Results and discussion
Forest cover regional dynamics in the Tehuacán-Cuicatlán Region
The regional dynamics of oak forest cover in the TCR showed differences between the periods before and after the TCBR decree. Thus, while in the pre-decree period (1979-2001) the forest cover decreased from 25 % to 19 % of the total TCR area, in the post-decree period (2001-2011) the forest cover increased slightly to 19.7 % (Figure 2). These results reflect that forest biomes and, in particular, oak forests, within or outside conservation schemes, are subject to deterioration processes that cause the transformation of ecosystems (Figueroa et al., 2011). In the particular case of the TCR, the results reveal the importance of evaluating the factors associated with deforestation and recovery, since the success of conservation objectives depends on maintaining native vegetation cover. Therefore, this study comprised a comprehensive analysis of TCR regional dynamics, and an analysis of biophysical and socio-economic factors associated with deforestation and recovery, based on two main sources of information.

Figure 2 Distribution of the deforestation and recovery processes in the oak (Quercus sp.) forest in the Tehuacán-Cuicatlán Biosphere Reserve (TCBR) and its zone of influence, in the 1976-2001 and 2001-2011 periods.
In the period prior to the TCBR decree (1979-2001), the annual change rates of the oak forest were -0.94 % in the TCR and -0.97 % in the TCBR reflecting intense deforestation and cover loss, even greater than those in the zone of influence, where the change rate was -0.86 %. These rates show a higher loss than those reported in official data (Comisión Nacional de Áreas Naturales Protegidas (CONANP), & Fondo Mexicano para la Conservación de la Naturaleza, 2003), which indicate a rate of -0.37 % for the 1986-1996 period and of 0.007 % for the 1992-2001period, considering all types of vegetation in the TCBR; likewise, the values are higher than those reported by Figueroa et al. (2011), who indicate a deforestation rate of -0.13 % for the 1993-2001 period. Although it is true that the use of different methodologies, information sources (satellite images and aerial photographs), analysis periods and vegetation types can explain the variation among those study results, there is a consensus in recognizing that changes in the TCR cover had a negative balance in the last decades of the last century.
A different situation arose in the period after the decree, when the transformation rate of the oak forest recovered in the TCBR (0.22) and was even equal to zero in the zone of influence. Although the deforestation and recovery processes respond to multiple biophysical and socioeconomic factors, such a decrease in the change rates is related over time to the reduction of productive activities, mainly from rainfed agriculture and grazing in induced grasslands (Table 3). This could be interpreted as a positive impact on the TCBR in terms of containing deforestation, while alerting us about the need to address the issue from its relationship with processes at the local level (land and resource rights of populations) to reconcile conservation and the use of degraded ecosystems.
Table 3 Annual change rates (%) in land cover and use in the Tehuacán-Cuicatlán Region (TCR), the Tehuacán-Cuicatlán Biosphere Reserve (TCBR) and the zone of influence in the reserve’s pre-decree (period 1: 1979-2011) and post-decree periods (period 2: 2001-2011).
| TCBR Sub-zone | Oak forest | Irrigated agriculture | Rainfed agriculture | Induced grasslands | Human settlements | |||||
|---|---|---|---|---|---|---|---|---|---|---|
| Period | 1 | 2 | 1 | 2 | 1 | 2 | 1 | 2 | 1 | 2 |
| TCR | -0.94 | 0.15 | 0.27 | 0.08 | 0.13 | 0.14 | 2.00 | -0.86 | 12.9 | 1.3 |
| TCBR | -0.97 | 0.22 | 0.30 | 0.03 | 0.13 | 0.28 | 2.16 | -0.87 | 13.0 | 1.4 |
| Influence zone | -0.86 | 0 | 0.20 | 0.14 | 0.12 | 0.04 | 1.70 | -0.80 | 12.9 | 1.2 |
Regional CLCU factors affecting oak forest deforestation and recovery in the TCR
First stage: analysis of biophysical and socio-economic factors
The evaluation of PNAs and their relationship with associated factors is a complex research problem that depends on environmental and socioeconomic factors (Mas, 2005).
The logistic regression models showed that oak forest deforestation in the pre-decree period (1979-2001) was associated with low-elevation, low-slope areas close to localities (Figure 3); i.e., easy-to-access areas vulnerable to resource use (Mas, 2005; Pressey, Whish, Barrett, & Watts, 2002). Likewise, deforestation was associated with high percentages in the male population, who are responsible for agricultural work (Pérez-Vega et al., 2016). The population that speaks an indigenous language has been considered a factor related to ecosystem conservation and reduced deforestation (Brandon, Gorenflo, Rodrigues, & Waller, 2005); however, in this study it was not a relevant factor in containing deforestation or favoring recovery in the two periods analyzed.
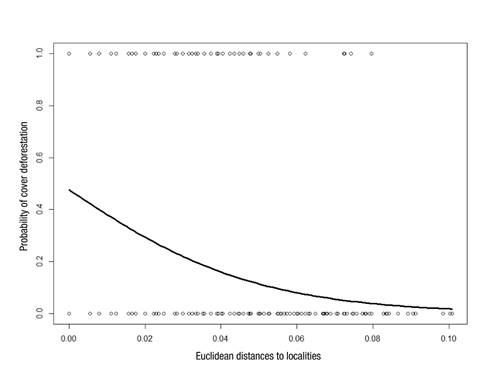
Figure 3 Euclidean distance to localities as a socioeconomic factor promoting oak (Quercus sp.) forest deforestation in the zone of influence within the Tehuacán-Cuicatlán Region.
On the other hand, the recovery of the oak forest cover in the post-decree period (2001-2011) was associated with low percentages in the male population (Figure 4) and high elevations, suggesting processes of abandonment of agricultural activity with favorable consequences in terms of recovery; this occurred mainly in the higher elevation areas, associated with mountain environments with steep slopes that impose restrictions on accessibility and resource management (Crk et al., 2009). The statistically relevant variables are shown in Table 4.

Figure 4 Male population as a factor promoting oak (Quercus sp.) forest recovery in the Tehuacán-Cuicatlán Biosphere Reserve.
Table 4 Biophysical and socioeconomic variables explaining deforestation and recovery of the oak (Quercus sp.) forest in the Tehuacán-Cuicatlán region (Tehuacán-Cuicatlán Biosphere Reserve [TCBR] and zone of influence).
| Area | Variables | Estimator | Z-value | P-value |
|---|---|---|---|---|
| First period: Deforestation | ||||
| TCBR | Intercept | 7.183 ± 2.091 | 3.436 | ˂ 0.001 |
| Slope | -0.024 ± 0.009 | -2.535 | 0.011 | |
| Elevation | -0.0009 ± 0.0003 | -2.352 | 0.018 | |
| Euclidean distance to localities | -47.55 ± 6.891 | -6.900 | ˂ 0.001 | |
| Population density | 7.628 ± 5.446 | 1.401 | 0.161 | |
| Percentage of male population | -0.099 ± 0.037 | -2.640 | 0.008 | |
| Population over 5 years that speaks an indigenous language | 0.0035 ± 0.0036 | 0.980 | 0.327 | |
| Marginalization index | -0.583 ± 0.269 | -2.162 | 0.030 | |
| Influence | Intercept | 3.785 ± 1.419 | 2.667 | 0.007 |
| Slope | -0.027 ± 0.009 | -2.891 | 0.003 | |
| Elevation | -0.0004 ± 0.0002 | -1.522 | 0.128 | |
| Euclidean distance to localities | -0.698 ± 0.109 | -6.385 | ˂ 0.001 | |
| Population density | 1.904 ± 6.207 | 0.307 | 0.759 | |
| Percentage of male population | -0.041 ± 0.023 | -1.767 | 0.077 | |
| Population over 5 years that speaks indigenous language | -0.00003 ± 0.002 | -0.013 | 0.989 | |
| Marginalization index | -0.769 ± 0.220 | -3.483 | ˂ 0.001 | |
| Second period: Recovery | ||||
| TCBR | Intercept | -5.714 ± 3.475 | -1.644 | 0.10010 |
| Slope | 0.039 ± 0.017 | 2.234 | 0.02550 | |
| Elevation | 0.004 ± 0.001 | 4.353 | ˂ 0.001 | |
| Euclidean distance to localities | -31.783 ± 16.677 | -1.906 | 0.05668 | |
| Population density | 1.367 ± 0.978 | 1.397 | 0.16251 | |
| Percentage of male population | -0.157 ± 0.055 | -2.857 | 0.00427 | |
| Population over 5-year-old that speaks indigenous language | -0.001 ± 0.006 | -0.265 | 0.79108 | |
| Marginalization index | -0.633 ± 0.437 | -1.447 | 0.14778 | |
Estimator ± standard deviation. Variables are considered significant when P < 0.05.
Second stage: analysis of municipal socioeconomic trends
The growth in demographic factors, such as in population, contribute to an increased demand for natural resources and to deforestation (Figueroa et al., 2009; Geist & Lambin, 2001). This situation is observed in the TCR, although with differences in the TCBR’s population behavior with respect to its zone of influence. While in the TCBR there was an increase in population in the 1970-1990 period, with a downward trend in the 1990-2010 period, in the zone of influence there was a downward population trend that remained constant in the 1970-2010 period (Figure 5) (INEGI, 1970, 1980, 1990, 2000, 2011). This is confirmed by the high emigration index that affected the TCR in 2000 (emigration of -6.15) and 2010 (emigration of -12.92) (SEGOB, 2010), indicating a process of intense emigration that has been interpreted as one of the household survival strategies that has had the greatest impact on the abandonment of land and the recovery of vegetation (Aide, Zimmerman, Pascarella, Rivera, & Marcano-Vega, 2000; Galicia et al., 2008; Guerra-Martínez et al., 2019; Mas, Osorio et al., 2015). In addition, there is a continuous process of urbanization in the TCR due to the migration of people from rural populations to the city of Tehuacán, which implies the reduction of activities related to the use of natural resources and, therefore, cover recovery.

Figure 5 Rural population trend in the Tehuacán-Cuicatlán region (Tehuacán-Cuicatlán Biosphere Reserve [TCBR] and zone of influence) in the 1970-2010 period.
With respect to economic factors in the TCR, the primary sector (agriculture, livestock and forest extraction) maintained a negative trend in the 1980-2000 period, as people engaged in this sector decreased from 13 718 in 1980 to 10 263 in 2000 (INEGI, 1980, 2000); the total number of livestock decreased from 71 820 in 1990 to 41 513 in 2007 (INEGI, 1991, 2007); and the number of people who used firewood for domestic purposes decreased from 51 996 in 1980 to 13 608 in 2007 (INEGI, 1980, 2000). On the other hand, in the 1980-2000 period, the secondary sector (construction activities and manufacturing industry) also showed a negative trend: 15 044 people were employed in this sector in 1980, whereas only 2 443 were employed in 2000 (INEGI, 1980, 2000). The decrease in primary and secondary activities could be attributed to the increase in the tertiary sector (commerce, transport, professional and health services), since the number of people employed in this sector rose from 670 in 1980 to 3 886 in 2000 (INEGI, 1980, 2000). These trends support the evolution of the CLCU processes in the TCR, as it was observed in the post-decree period, when the oak forest cover recovery was associated with agricultural abandonment and with a greater participation of the population in occupational sectors other than primary.
Although socioeconomic trends have a logical relationship with the dynamics of the CLCU, the simple regression model applied between the change rates of the municipalities in the TCR and the socioeconomic variables, in both periods, shows that there are no unique factors explaining the processes of the CLCU. However, the model highlights a negative statistical relationship (R2 = 0.19; P = 0.039) between the total population variable and the change rate of the oak forest in the TCR municipalities; that is, while the total population is lower, the change rates are positive, which represents a recovery of the forest cover (Figure 6).

Figure 6 Model of the relationship between total population in the Tehuacán-Cuicatlán Reserve and the cover change rate.
The above-mentioned results show that socioeconomic trends within the TCR have positively impacted the oak forest ecosystem. Although it is not possible to determine that the was a determining factor in the conservation of natural resources in the TCR, the results indicate a positive and indirect influence, by causing negative impacts in socio-economic terms, mainly in terms of emigration and the decrease in primary activities. The results could be more forceful after considering some local factors, such as the local population’s rights over the land and resources to reconcile conservation and the use of degraded ecosystems.
Finally, it is recognized that the regional analysis provides information for decision making on where to invest resources (human and economic) for conservation and, particularly, for identifying key areas useful for subsequent assessments at the local level. In addition, the study indirectly allowed a comprehensive view of the social, economic and political processes that affected the CLCU, as has occurred in other studies (Geist & Lambin, 2002).
Conclusions
In the period before the decree establishing the Tehuacán-Cuicatlán Biosphere Reserve (TCBR) (1979-2001), the oak forest was deforested. Areas with low slopes, proximity to localities, and higher male population were the main driving forces behind this change. In contrast, during the post-decree period (2001-2011), the recovery of the oak forest promoted by factors such as the high-slope, high-elevation areas and a decrease in the male population. The TCBR decree, which was issued in 1998, should not be considered as the main reason for containment of the oak forest deforestation or for its subsequent incipient recovery; however, indirect interference should be accepted, particularly related to the decrease in the male population, a social group that has traditionally been a promoter of agricultural activities, land use change and deforestation.

