


 texto en
  Inglés (pdf)
 Artículo en XML
 Referencias del artículo
 Enviar artículo por email
 Citado por SciELO
  Similares en
SciELO
Similares en
SciELO 
 Permalink
Introduction
Wildfires, according to the Secretaría de Gobernación (2014), are previously unpredicted fires that burn plant fuels in forests, tropical forests and scrub, forcing people to try to extinguish them. In Mexico, wildfires occur during the dry season, reaching their most critical level in April and May, which is why the federal government has implemented programs for monitoring and detecting them. The Ministry of Environment and Natural Resources (SEMARNAT), through the National Forestry Commission (CONAFOR), has developed the "National Wildfire Protection Program," which focuses on the detection, combating and extinction of wildfires. This program uses the following fire detection mechanisms: fixed land (forest watchtowers), mobile land (constant supervision with automobiles), and aerial (supervision with light aircraft and helicopters) to monitor inaccessible areas (Secretaría de Gobernación, 2014).
Cruz-López, Saldaña, Ressl, and Colditz (2011) and Manzo (2016) point out that CONAFOR's historical reports recorded approximately 14,000 wildfires in the 1998 season, considered the most catastrophic of recent years in Mexico. Against this backdrop, the “Hotspot detection by remote sensing techniques” program was developed, which later became the “Early warning system for fires”, both implemented by CONABIO (National Commission for the Knowledge and Use of Biodiversity). These programs have used images from several sensors, highlighted by the Advanced Very High Resolution Radiometer (AVHRR), Moderate Resolution Imaging Spectroradiometer (MODIS) and the Visible Infrared Imaging Radiometer Suite (VIRSS). Hotspots record thermal anomalies related to the generation of wildfires fires and burns in pastures and crops (Cruz-López et al., 2011). The spots are detected through the use of thermal bands in a satellite image, from pixels that comply with the thresholds established within an algorithm and that show a high temperature compared to their neighbors.
The National Water Commission (CONAGUA) is another agency that, through the National Meteorological Service (SMN), has constantly monitored the territory through the "Detection and monitoring of wildfires" program, which uses satellite images from the Geostationary Operational Environmental Satellite (GOES), AVHRR and MODIS sensors.
The information generated by the above programs is expressed through hotspots reported daily to various government agencies throughout the country. Although these programs have been using satellite technology for more than 15 years, there is no literature on thematic accuracy; it is therefore necessary to carry out tests to determine the uncertainty level. Thematic accuracy, according to Chuvieco (2008) and Mas, Díaz-Gallegos, and Pérez (2003), is the degree of accuracy achieved by a map obtained from the digital or visual classification of a satellite image, when compared with reference information considered highly reliable and analyzed with statistical techniques.
The evaluation of thematic map accuracy is a topic addressed by several papers (Card, 1982; Chuvieco, 2008; Congalton, 1991; Mas et al., 2003, 2014; Olofsson et al., 2014; Olofsson, Foody, Stehman, & Woodcock, 2013; Stehman & Czaplewski, 1998) that present the following recommendations to perform it with statistical rigor: a) implement a probabilistic design by reporting the sampling unit, sampling type and sample size; b) provide an adequate spatial and temporal representation, from the reference data, to label each sample unit accurately; c) summarize the accuracy assessment by reporting a confusion matrix in terms of area proportion; d) estimate overall accuracy by indicating omission and commission errors; and e) quantify the uncertainty of the accuracy indices by confidence intervals. These aspects are considered basic in any accuracy study.
In this regard, the objective of this research was to determine the thematic accuracy of hotspots and wildfires recorded in a period of 2011, in a region of the state of Michoacan, given that there is no history of this type at the national level. The data were obtained from three federal sources: CONAFOR, CONABIO and SMN.
Materials and methods
Study area
The study area included the municipalities of Aquila, Aguililla, Chinicuila and Coalcomán in the state of Michoacán, covering an area of 5 875 km2 (Figure 1). The area was determined based on two factors: the hotspot concentrations shown by CONABIO, SMN and CONAFOR fire reports, and the availability of high spatial resolution images in early February and late May, 2011.

Study material
CONABIO's hotspots in shapefile format (points) were downloaded through its portal (http://incendios.conabio.gob.mx), while those of SMN were obtained through a request for information from the Department of Environmental Atmospheric Monitoring. It should be noted that CONABIO’s hotspots come from MODIS image processing, while the SMN hotspots come from GOES, AVHRR and MODIS image processing.
Wildfire data were obtained through CONAFOR's state office in a spreadsheet with the following information: geographic coordinates, municipalities, causes, start dates, vegetation types, burnt area and duration of events. An important input was the V Series Land and Vegetation Use map of the National Institute of Statistics and Geography (INEGI, 2011) with a 1:250000 scale. In addition, thanks to an existing agreement between CONABIO and the National Autonomous University of Mexico (UNAM), 24 Rapid Eye images with a spatial resolution of 5 m were obtained. Half of these images are from February 6 and the other half are from May 20, 2011. All the material was processed in the ArcGis 9.3.1 Geographic Information System (Environmental Systems Research Institute [ESRI], 2009) with a UTM Zone 13 North projection system and WGS84 Datum.
Methods
Forest and grassland cover map
The boundaries of the covers, indicated on the INEGI V-Series map, were improved through a visual interpretation at a scale of 1: 50,000, taking as background the Rapid Eye images of February 6, 2011. Subsequently, the covers were reclassified into four categories: tropical forests, forests, grasslands and other covers. This resulted in a map of forest and grassland covers that served as the basis for determining the type of vegetation affected by the fires.
Rapid Eye image processing
Recent fires show a highly detectable footprint or scar with remote sensing techniques, due to the behavior of vegetation in the spectrum after a fire; according to Robinson (1991) and Pereira et al. (1999), vegetation shows a slight increase in visible response and a decrease in the near-infrared region. Depending on the combination of spectral bands, the scars acquire very characteristic shades; for example, in a false color, scars ranging from dark green to completely black can be seen. These scars are very noticeable in the time of greatest water stress of vegetation that coincides with the months of greatest damage by fires.
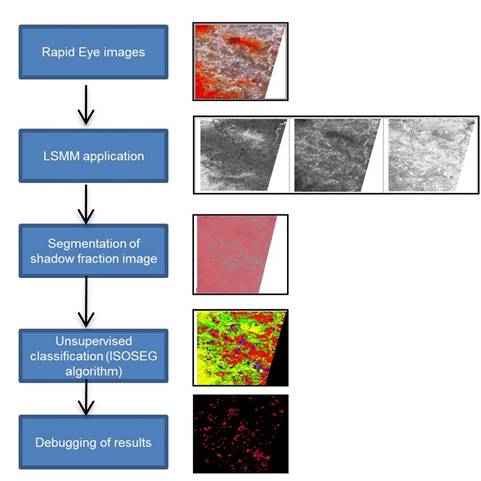
Fire scars were detected with Rapid Eye level 2A images indicating radiometric, geometric and terrain pre-processing (Blackbridge, 2013). The detection was done with the DETEQ methodology (detection of burnt areas in real time), developed by Brazil’s National Institute for Space Research (INPE). This methodology is based on the application of the linear spectral mixing model (LSMM), segmentation of the shadow fraction image and application of an unsupervised classification (Câmara, Valeriano, & Vianei, 2013; Shimabukuro et al., 2006, 2011).
Once classified, the burnt areas were analyzed through a visual interpretation in order to remove areas not corresponding to fire scars, since the shadow fraction image also enhances the shadows and water bodies present (Figure 2). The processing was done in the open source software SPRING version 5.3 (Câmara, Souza, Freitas, & Garrido, 1996).
Debugging of CONAFOR, CONABIO and SMN databases
CONAFOR's useful data for the accuracy analysis were the geographic coordinates of the fires reported in forests and tropical forests between February 6 and May 20, 2011 in the municipalities involved. The coordinates were spatialized in shapefile point format and treated with a 1 000-m buffer in order to obtain a greater spatial coincidence with respect to the reported location. These polygons were crossed with fire scars to evaluate their accuracy.
On the other hand, CONABIO and SMN hotspots located in the municipalities involved and reported between February 6 and May 20, 2011 were selected. A square buffer of 1 000, 1 100 and 4 000 m was applied to these points to simulate the pixels of the MODIS, AVHRR and GOES sensors, respectively, in order to know the number of fire scars that exist inside, and thus calculate the detection rate and perform the accuracy analysis.
Detection rate
The detection rate (Td) is defined as the proportion of area affected by fire, identified through images. The rate was calculated with the formula Td = Ci/Tc, where Ci is the total number of scars detected within a hotspot pixel and Tc is the total number of scars identified with high-resolution images. The crossing between the hotspot polygons and the scars also allowed separation by type of cover.
Thematic accuracy assessment
Sampling design
Polygons with dimensions of 1 000, 1 100 and 4 000 m with stratified random sampling were used as the sampling unit. The choice of a suitable sample size was necessary because at the time of generating simulated pixels there was a high overlap of hotspot polygons. The sample size (n) was calculated using the following formulae (Chuvieco, 2008; Mas et al., 2003; Stehman & Czaplewski, 1998):
Evaluation of data verification and analysis sites
This phase consisted of labeling the sample polygons in two categories: 0 = no hotspot and 1 = with hotspot. Data were analyzed using confusion matrices developed with the verification data (fire scars) and with the map results (hotspots and no hotspots). In this case, since there were only two categories, matrices were obtained with two columns and two lines (Table 1).
Table 1 Example of a confusion matrix for the evaluation of verification sites with two categories (0 = no hotspot and 1 = with hotspot).
| Reference data | ||||
|---|---|---|---|---|
| Map | 0 | 1 | Sum | |
| 0 | X00 | X01 | X1+ | |
| 1 | X10 | X11 | X2+ | |
| Sum | X+1 | X+2 | ||
In Table 1: X00 = agreements between the reference and the map for category 0, X01 = data mapped as 0 actually belonging to category 1; X1+ = total of category 0, and X2+ = total of category 1, both included in the map. However, Card (1982) and Olofsson et al. (2013, 2014) propose that measures of the proportion of area derived from the confusion matrix, corrected by an estimator, should be considered. As there are errors of omission (burnt areas not detected) and commission (burnt areas that did not exist), there is an underestimation and overestimation of the categories. This information was used to adjust the confusion matrix (Table 2).
Table 2 Confusion matrix adjusted in proportion of area.
| Reference data | ||||
|---|---|---|---|---|
| Map | 0 | 1 | Sum | |
| 0 |
|
|
|
|
| 1 |
|
|
|
|
| Sum |
|
|
||
In Table 2:
Measurement of confidence intervals
Confidence intervals of the omission error and commission error estimates were calculated using the following formulae (Card 1982; Olofsson et al., 2013, 2014):
Results
Forest and grassland cover map
As a result of the adjustment made to the INEGI Series V map, it was determined that the forests cover an area of 238 500 ha, the tropical forests 187 400 ha, the grasslands 139 000 ha and other covers 22 600 ha, representing 41, 32, 24 and 3 % respectively. This map is very important for calculating the detection rate, as greater accuracy is required on the scale to identify the affected covers.
Fire scar detection
The mapping resulted in a total of 2 181 scars: 1 468 in grasslands, 435 in tropical forests and 278 in forests with a burnt area of 10 836, 1 529 and 4 091 ha, respectively. The total burnt area is 16 448 ha, representing 3 % of the total study area. In the four municipalities involved, grassland was the cover with the highest number of scars and also with the largest burnt area. According to Figure 3, grasslands represent the largest number of fires in all categories analyzed, except in the category of more than 100 ha in which fires in forests stand out. An important feature was the size of the scars, since most of the 2 181 were of small magnitude; scars from 1 to 10 ha represented 82 %, scars from 10 to 50 ha represented 16.8 % and scars greater than 50 ha represented 1.2 %.

Detection rate with CONABIO and SMN hotspots
The detection rate was determined from the SMN and CONABIO hotspots; 710 spots were obtained from the MODIS sensor processed by CONABIO and 166 spots from the MODIS sensor, 82 spots from the AVHRR sensor and 102 spots from the GOES sensor processed by SMN. These spots, with their respective buffer, were crossed with the 2 181 scars.
Table 3 shows that there are 1 321 scars ranging from 1 to 5 ha when the MODIS sensor detected 368, which yields a detection rate of 28 %. At the other end there are seven scars of more than 100 ha and six were detected; therefore, the detection rate was 86 %. It can be seen that the detection rate increases as the burnt area increases. Figure 4 shows the results obtained when the same procedure was performed for the hotspots of the other sensors. The fire scars were also separated by type of cover inside the simulated pixel, as seen in Figure 5.
Table 3 Fire detection rate (February 6 and May 20, 2011) of the MODIS sensor processed by CONABIO.
| Area (ha) | Scars detected with Rapid Eye | Scars detected with the MODIS* sensor | Detection rate |
|---|---|---|---|
| 1 - 5 | 1 321 | 368 | 0.28 |
| 5 - 10 | 470 | 158 | 0.34 |
| 10 - 15 | 165 | 62 | 0.38 |
| 15 - 20 | 81 | 44 | 0.54 |
| 20 - 50 | 120 | 59 | 0.49 |
| 50 - 100 | 17 | 13 | 0.76 |
| >100 | 7 | 6 | 0.86 |
| Total | 2 181 | 710 |
*Scars were separated by magnitude of area detected, although a MODIS pixel may include several scars.
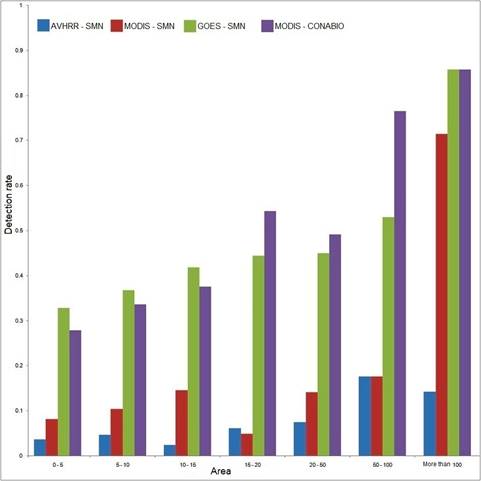
Figure 4 Scar rate detected by sensors (AVHRR, MODIS and GOES) processed by CONABIO (National Commission for the Knowledge and Use of Biodiversity) and SMN (National Meteorological Service).
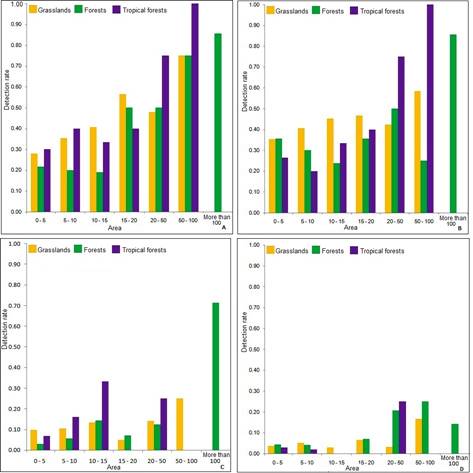
Figure 5 Comparison of the detection rates in the analyzed covers: A) MODIS sensor processed by CONABIO (National Commission for the Knowledge and Use of Biodiversity) and B) GOES sensor, C) MODIS sensor and D) AVHRR sensor processed by SMN (National Meteorological Service).
Figure 5A represents the MODIS case processed by CONABIO. In the 15 to 20 ha category, the detection rate reached was 56, 50 and 40 % for grasslands, forests and tropical forests, respectively. In the 20 to 50 ha category, the detection rate was 48, 50 and 75 % in grasslands, forests and tropical forests, respectively. The 50 to 100 ha category achieved detection rates of 75 % in grassland and forest covers and 100 % in tropical forest ones. Finally, in the category of more than 100 ha, the detection rate was 85 % in forests.
Figure 5B represents the case of the GOES sensor. In the 20 to 50 ha category, the detection rate was 43, 50 and 75 % in grasslands, forests and tropical forests, respectively. In the 50 to 100 ha category, the detection rate was 58, 25 and 100 % in grasslands, forests and tropical forests, respectively. In the category of more than 100 ha, the detection rate reached was 86 % in forests. Something important to consider is the pixel size of this sensor, since scars of different magnitudes are conjugated in a 4 000 m2 area; therefore, it is recommended to take these data with caution.
Figure 5C shows the case of MODIS sensor data processed by SMN, which indicates very low detection rate values in all categories, except in the category of more than 100 ha, where the rate was 71 %, as it detected five of seven scars in forests. Figure 5D shows data from the AVHRR sensor, where the detection rate is very low in every category analyzed and in all three of the covers under study.
Accuracy assessment
CONAFOR fire reports
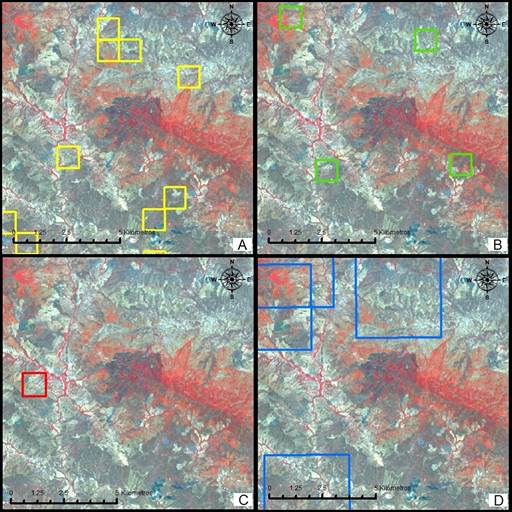
Table 4 presents the thematic accuracy analysis resulting from the crossing of CONAFOR wildfires (geographic location) versus scars in forests and tropical forests. It can be seen that the spatial location lacks accuracy, since only a forest fire coincides with a scar; however, it does not mean that wildfires have not occurred, but it is not known what they are; therefore, the accuracy assessment was discarded.
CONABIO and SMN adjusted matrices
The sample size was 150 spots, expecting to achieve 70 % accuracy with an uncertainty of ±5 %:
Table 5 shows the results of the matrix corrected by the proportion of the area, derived from the crossing between fire scars and a random sample of hotspots reported by CONABIO.
Table 5 Matrix adjusted for MODIS sensor data processed by CONABIO (National Commission for the Knowledge and Use of Biodiversity).
| Reference (Fire scars) | |||||
|---|---|---|---|---|---|
| Hotspots map (MODIS) | 0 | 1 | Total | Commission | |
| 0 | 0.65 | 0.22 | 0.88 | 0.25 | |
| 1 | 0.05 | 0.06 | 0.12 | 0.47 | |
| Total | 0.71 | 0.29 | 1 | ||
| Overall accuracy | 0.72 | ||||
| Omission | 0.08 | 0.78 | |||
Overall accuracy was 72 % for the MODIS hotspots processed by CONABIO. In the case of the spots processed by SMN, accuracy was 72 % in MODIS hotspots, 66 % in AVHRR hotspots and 39 % in GOES hotspots. However, a more detailed analysis, shown in Table 6, allowed the calculation of commission and omission errors with their respective average confidence intervals.
Table 6 Omission and commission errors with confidence intervals in the hotspot category.
| Sensor type/Dependency | Commission error | Omission error | ||
|---|---|---|---|---|
| Category 0 | Category 1 | Category 0 | Category 1 | |
| MODIS/CONABIO hotspots | 0.25 | 0.47 | 0.08 | 0.78 |
| Average confidence interval | 0.05 | 0.03 | 0.01 | 0.02 |
| MODIS/SMN hotspots | 0.28 | 0.31 | 0.01 | 0.93 |
| Average confidence interval | 0.10 | 0.06 | 0.004 | 0.01 |
| AVHRR/SMN hotspots | 0.33 | 0.51 | 0.01 | 0.97 |
| Average confidence interval | 0.12 | 0.10 | 0.004 | 0.009 |
| GOES/SMN hotspots | 0.81 | 0.08 | 0.14 | 0.70 |
| Average confidence interval | 0.09 | 0.05 | 0.11 | 0.02 |
CONABIO: National Commission for the Knowledge and Use of Biodiversity; SMN: National Meteorological Service.
Table 6 reports the omission and commission errors for the two categories under study, although only the results of category 1 referring to hotspots are analyzed.
The commission error for this category refers to the overestimation of hotspots in places that do not have fire scars. The highest error was presented with AVHRR sensor data with 51%; that is, for every 10 pixels of hotspots in five there are no scars. The lowest value was obtained with the GOES sensor (8 %).
The omission error for category 1 refers to the underestimation of hotspots where there were fire scars. In this sense, the highest error was obtained with AVHRR sensor data with 97 %; that is, for every 10 hotspot pixels there are another 10 that have scars and were not reported. The AVHRR sensor is followed by the MODIS sensor data processed by SMN with 93 %, then the MODIS sensor data processed by CONABIO with 78 % and finally the GOES sensor data with 70 %. These results show that there is a high omission of fires that are not detected with images from these sensors (Figure 6).
In addition to the data analysis, confidence intervals were measured for each category and type of error. The results show very low values in all cases, indicating that the sample size was suitable for the accuracy assessment.
Discussion
The fires reported by CONAFOR lack spatial coincidence with respect to scars; of 63 fire reports there was only one match when applying a 1 000-m buffer. Such results generate a confusing idea as to their location. This information is very useful, since fire, burnt area and spatial location statistics are constantly used for the generation of preventive indices and models, resource allocation, and incidence reports, among others (Ávila-Flores, Pompa-García, & Vargas-Pérez, 2010; Gutiérrez, Orozco-Hernández, Ordoñez, & Camacho, 2015; Torres-Rojo, Magaña-Torres, & Ramírez-Fuentes, 2007).
Regarding the detection rate for the simulated pixels of each sensor, the best results were obtained with the CONABIO MODIS sensor with a rate of 75 % in the 50 to 100 ha category and 86 % in areas larger than 100 ha. These results show similarity with the findings reported by Cruz-López et al. (2011), who compared the hotspots detected with MODIS versus scars detected with ASTER images. These authors indicate that when scars cover 50 % of a MODIS pixel, the match with ASTER images is 40 %, and that when the MODIS pixel approaches 80 % of the burnt area, the match with ASTER data reaches 85 % of what was detected. In other words, these results indicate that the larger the burnt area, the greater the probability of detection.
The thematic accuracy assessment had an overall average of 62 % in the confusion matrices with the sensors used; however, the omission and commission errors for the hotspots category represented an average of 85 and 34 %, respectively. The omission error expresses an idea of underestimation of areas burnt by fires. In this sense, it is essential to evaluate the CONABIO and SMN hotspots, since they are widely used by several agencies. CONABIO, for example, reports about 590 users from 109 agencies, with CONAFOR, CONANP (National Commission of Protected Natural Areas) and SAGARPA (currently SADER [Secretariat of Agriculture and Rural Development]) having the highest number of requests (Cruz-López et al., 2011). Other authors have also used CONABIO hotspots to generate preventive models against wildfires (Carrillo, Rodríguez, Tchikoué, Monterroso, & Pérez, 2012; Rodríguez-Trejo, Tchikoué, Cíntora-González, Contreras-Aguado, & de la Rosa-Vázquez, 2011), characterize spatial patterns and determine the anthropogenic and environmental factors that generate the presence or absence of hotspots (Muñoz-Robles & Santana-Arias, 2018).
The high omission values reported with the sensors used for fire monitoring are a consequence of several factors, such as the size of the burnt area, the duration of the fires, the time of acquisition of the images and the weather conditions. In relation to the size, it was possible to demonstrate that the class of 1 to 10 ha accounts for 82 % of the scars detected with Rapid Eye images, which is consistent with CONAFOR fire records, which indicate that the fires smaller than 10 ha accounted for 73 % of the total for the year 2011 in Michoacán. Vilchis-Frances, Diaz-Delgado, Magaña-Lona, Ba, and Gomez-Albores (2015) indicate that fires, on average, do not exceed 4 ha in the State of Mexico, which represents 87 %. Manzo (2016) analyzed cartographic products on fires and deduced that, nationally, fires under 50 ha represent 61 % and mentioned, on the other hand, that CONAFOR’s historical reports indicate that 66 % are under 5 ha. In this way, it is confirmed that the sensors analyzed here do not detect small fires.
Fire duration is another factor to consider; in Michoacán, fires last an average of 4.5 h according to the CONAFOR 2011 database. Vilchis-Frances et al. (2015) state that fires start on average between 12:00 and 15:00 hours and that 83 % last less than 5 hours in the case of the State of Mexico, and Manzo (2016) indicates that, nationally, 83 % of fires last less than 24 hours.
The satellite images used to detect hotspots come from the MODIS, AVHRR and GOES sensors, so it is important to consider the travel time of these platforms to determine whether they can detect active fires. García-Mora and Mas (2011) report that the Terra-MODIS platform is scheduled to go from north to south and cross Ecuador at 10:30 a.m. (Mexico at 9:30 a.m.), while the Aqua-MODIS platform goes from south to north and crosses Ecuador at 1:30 p.m. (Mexico at 2:30 p.m.). Vera (2005) says that the NOAA-AVHRR18 platform has a heliosynchronous orbit from north to south with a first tour through Ecuador at 7:30 a.m. and a second 12 hours later, at 7:30 p.m. AVHRR 19 crosses Ecuador twice, at 1:30 p.m. and 1:30 a.m. The GOES sensor has a geostationary orbit and monitors the national territory every 30 min; however, due to its low spatial resolution (4,000 m), it is difficult to saturate a pixel, as fires are small and short-lived.
This information allows us to deduce that the MODIS-Terra and AVHRR-18 sensors are less likely to detect hotspots or fires because of their monitoring schedule and the short duration of events.
Conclusions
Regarding the coordinates of wildfires, reported by CONAFOR, there is no good capture system. If this situation were to improve, studies that are more reliable could be made. The use of hotspots, according to detection rates, are ideal for fires exceeding 50 ha. From this perspective, it would be ideal to explore other alternatives for the detection of small active fires with images of higher spatial resolution of a public or private nature. On the other hand, the methodology used here was ideal for assessing thematic accuracy with the support of high spatial resolution images and the improvement in the scale of the cover map. Finally, this type of evaluation could serve to give certainty to the information required by a wildfire monitoring and detection program, with the objective of contributing to a more accurate determination of fire susceptibility.

