


![Especialización y competitividad de la producción de hule (Hevea brasiliensis [Willd. ex A. Juss.] Müll. Arg.) en México](/img/pt/prev.gif)


 texto em
  Inglês (pdf)
 Artigo em XML
 Referências do artigo
 Enviar este artigo por email
 Citado por SciELO
  Similares em
SciELO
Similares em
SciELO 
 Permalink
Introduction
One of the main causes of the loss of plant and animal species’ biodiversity is habitat destruction (Otavo & Echeverría, 2017). In particular, the recovery of bird diversity in disturbed spaces requires knowing more about the biology and ecology of the species; that is, their abundance, distribution and relationship with the ecosystem. This is why international efforts to conserve forest areas have increasingly focused on the restoration and recovery of ecosystems and, consequently, biodiversity (Holl & Aide, 2011).
A vast number of works have focused efforts on the restoration of the plant component, in many cases aimed only at determining tree structure and composition (Guevara-Hernández et al., 2011; Holl, Loik, Lin, & Samuels, 2000), partly because since the mid-1970s there has been a widespread belief that wildlife would reoccupy disturbed spaces after effective revegetation (Majer, 2009). Consequently, even though birds are one of the most ecologically studied faunal groups (MacGregor-Fors, Blanco-García, & Lindig-Cisneros, 2010), few studies have evaluated the subsequent effect of rehabilitation on the presence or recovery of birds. This situation has led to confusion in understanding the processes and interactions that this group has with other components of rehabilitated ecosystems (Calamari, Vilella, Sica, & Mercuri, 2018; Whytock et al., 2017).
Some studies carried out in Latin America have highlighted the importance of understanding the structural complexity of vegetation in increasing bird richness and abundance, which is reflected by the number of strata and food availability (Almazán-Núñez, Puebla-Olivares, & Almazán-Juárez, 2009; Brazeiro, Cravino, Férnandez, & Haretche, 2018; Martínez-Sánchez, Cardona-Romero, Rivera-Páez, Pérez-Cárdenas, & Castaño-Villa, 2018). In this regard, in Costa Rica, Maglianesi (2010) evaluated reforestations of Pinus oocarpa Schiede ex Schltdl. and Cupressus lusitanica Mill. as bird habitat, comparing it with a secondary native forest of Roupala glaberrima Pittier, Clethra lanata M. Martens & Galeotti, and Quercus seemannii Liebm. as dominant species, and found no significant differences between species diversity and equity. In Cuba, Arteaga (2018) evaluated changes in bird communities between a natural forest with Pinus caribaea Morelet var. caribaea and a 35-year-old plantation of the same species; the results indicated that there are no significant differences in richness and abundance, which highlights the importance of plantations in the conservation of bird diversity. On the contrary, in Uruguay, Brazeiro et al. (2018) evaluated bird richness and diversity between disturbed grasslands and grasslands reforested with Eucalyptus spp. and found that, in reforested areas, richness and diversity were reduced by up to 68 and 90 %, respectively; these changes mainly affected birds specialized in open environments, while some generalist birds and specialists in closed environments benefited.
In El Porvenir, Hidalgo, Mexico, forest remnants are dominated by Pinus cembroides Zucc.; a large plant cover area was lost due to anthropogenic pressures (overgrazing, agriculture and firewood use) that caused a high state of degradation, putting local biodiversity at risk (Ventura-Ríos, Plascencia-Escalante, Hernández de la Rosa, Ángeles-Pérez, & Aldrete, 2017). In 1998, the first forest rehabilitation actions were carried out exclusively with reforestations, establishing Pinus greggii Engelm. ex Parl. as the main species (Ventura-Ríos et al., 2017). In these actions, birds play an essential role in ecosystem dynamics because they act as seed dispersers, control pests and diseases, and are considered indicators of environmental quality (González-Valdivia et al., 2011). Despite the importance for ecosystem functioning, there are no ornithological studies in the area that estimate richness, abundance and diversity. On the other hand, estimation-comparison studies between natural stands against areas under forest rehabilitation, at different ages, are scarce in Mexico (Ortega-Álvarez, Lindig-Cisneros, MacGregor-Fors, Renton, & Schondube, 2013), and in the study area there are none. The relationship between avifauna and the rehabilitated environment is vital to evaluate the effectiveness of this strategy for biodiversity conservation purposes (Hobbs & Harris, 2001).
The objective of this work was to analyze the effect of forest rehabilitation on bird richness, abundance and diversity in areas with different-aged reforestation, and to establish the relationship of this practice with vegetation structure. Forest rehabilitation actions are expected to influence structural parameters, so that there would be a gradual recovery of these with respect to rehabilitation age, obtaining higher values at the reference site. Because vegetation structure complexity is closely associated with increased bird richness, abundance, and diversity, it would also be expected that these avifauna parameters increase sequentially with greater structural development of the vegetation.
Materials and methods
The study area is located in El Porvenir, Santiago de Anaya, Hidalgo, Mexico, between geographic coordinates 20° 28’ 16” - 20° 26’ 14” N and 98° 58’ 24” - 98° 56’ 17” W, with an elevational range of 1 800 to 2 580 m (Figure 1).
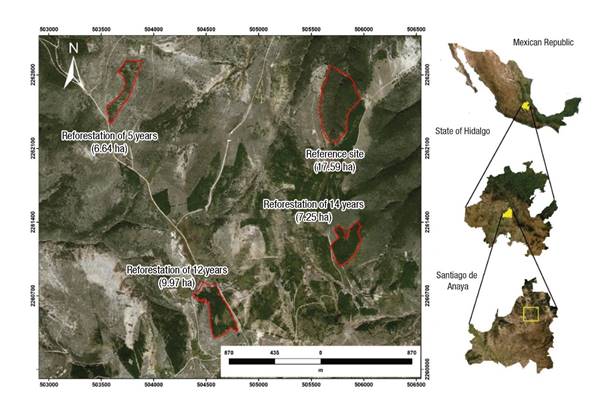
Figure 1 Location of the reference site and areas under forest rehabilitation in El Porvenir, Hidalgo, Mexico.
In 1998, the El Porvenir microbasin ecological restoration project began. The initial objective was to generate a model for improving, protecting and conserving the environment through the Sustainable Regional Development Program (PRODERS) of the Mezquital Valley, under reforestation activities and soil and water conservation works (Ventura-Ríos et al., 2017). El Porvenir is a community widely recognized in Mexico for reforestation work, since in 2005 it won the National Forest Merit Award in the Conservation and Restoration Category. The reforestation was done with exotic, introduced and native species (Casuarina sp., Cupressus sp., Eucalyptus sp., P. cembroides, Pinus patula Schiede ex Schltdl. & Cham., Pinus pseudostrobus Lindl. and P. greggii), of which P. greggii is the species with the highest growth rate and best adaptation to site conditions. The reforested area covers approximately 300 ha (Ventura-Ríos et al., 2017).
Through field trips, four study conditions were chosen for carrying out this research; three forest rehabilitation areas with P. greggii (R5 = 5 years, R12 = 12 years and R14 = 14 years), of which the reforestation age was known due to the work carried out by Ventura-Ríos et al. (2017), and a reference site (RS) that has a natural forest of P. cembroides and Juniperus flaccida Schltdl. This site was selected for being a remnant of the original ecosystem and being located less than 2 km from the chosen areas with forest rehabilitation, in addition to presenting allometric characteristics typical of a mature forest. However, the site also shows clear visual signs of anthropogenic disturbance (illegal logging, firewood extraction, hunting and grazing), even though according to the inhabitants it has not received forest management (Ventura-Ríos, 2017).
Through systematic grid sampling, five monitoring sites were established for conditions R12, R14 and SR, and only four for R5, because the area did not allow the establishment of an additional site with a minimum equidistance of 150 m between them, as recommended by Ralph et al. (1996) for monitoring birds in areas with small dimensions. Data were collected monthly during the cold-dry season (between January and June 2015), under two schemes: 1) point counts with a fixed radius of 25 m and 2) capture by constant-effort mist-netting (Gallina, 2011; Ralph et al., 1996). Birds were recorded by counting at monitoring sites with a 25 m fixed radius. To do this, the observers placed themselves in the center of each site and waited one minute before collecting data to allow the birds to get used to their presence; all species were then visually identified for 10 min (DeSante, 1986). Mist nets were also placed at each of the monitoring sites; 19 nets in total (15 12 m x 2.6 m nets and four 6 m x 2.6 m nets with 36 mm mesh width) interspersed between the monitoring sites for a similar sampling effort. The nets were kept open from 6:00 a.m. to 2:00 p.m. and were checked every 60 minutes, since the period of greatest bird activity is in the early hours of the day (Ralph et al., 1996). These techniques were used in combination as they are complementary and allow better detection of some bird species that are still, inconspicuous and silent, which makes them very difficult to record through direct observation (Bojorges, López-Mata, Tarango-Arámbula, Herrera-Haro, & Mendoza-Martínez, 2006). Visual records were made using 10 x 50 binoculars (Bushnell brand), and birds were identified using standard field guides (Howell & Webb, 2012; National Geographic Society, 2011).
Tree species were also identified at each of the bird monitoring sites, for each rehabilitation condition, and tree-size variables such as height and diameter at breast height (DBH at 1.30 m from the ground surface) were measured. Data were obtained using the point-centered quarter method (Gallina, 2011). The distance from the central point of each quadrant to the nearest tree was recorded, without taking into account a minimum diameter. For shrub and herbaceous vegetation, only the abundance at each monitoring site was quantified, using nested tables of 4 x 4 m for shrubs and 1 x 1 m for herbaceous species (Begon, Townsend, & Harper, 2006). Plant specimens were collected for later identification at species level, in the “CHAPA” Herbarium of the Colegio de Postgraduados Campus Montecillo.
To measure the structure of the vegetation, tree density (Dh) was calculated using the formula Dh = 10000/(D)2, where D = average distance. The basal area per hectare was estimated using the formula BAha = π (D2/4) * Dh, where: D = average diameter (Zarco-Espinosa, Valdez-Hernández, Ángeles-Pérez, & Castillo-Acosta, 2010). The canopy opening was calculated by taking digital hemispherical photographs (Aguirre-Salado, Valdez-Lazalde, Ángeles-Pérez, de los Santos-Posadas, & Aguirre-Salado, 2011) with a NIKON COLPIX® camera and a NIKON® FC-E8 Fisheye Converter lens.
In order to graphically describe the vegetation’s vertical structure, the formation of vertical strata of the herbaceous, shrub and tree components by condition was examined by means of the inflections of a curve generated between the number of individuals against their height (López-Toledo, Valdez-Hernández, Pérez-Farreira, & Cetina-Alcalá, 2012). Subsequently, the richness, abundance and diversity of birds in each condition were related to the formation of the strata.
Estimated richness (Sest) was calculated using smooth curves of species accumulation with the non-parametric Jacknife1 estimator (Magurran & McGill, 2011; Moreno-Ortega, 2001). The analysis was performed with the EstimateS v. 9.1 software application (Colwell, 2013).
Relative abundance was analyzed using the observed frequencies of individuals by species recorded in each condition, using the relative abundance index (Riquelme, Hinojosa, Figueroa, & González-Acuña, 2018):
Ai = n/N x 100
where,
Ai |
relative abundance of species i |
n |
number of individuals of species i |
N |
total number of individuals. |
With the values obtained, the species were classified by their frequency of observation into two categories: non-abundant (<21 individuals) and abundant (>21 individuals), based on the Curts (1993) proposal, which measures the degree to which birds use a particular habitat. Models were also constructed to determine the distribution of abundances in each condition, based on the frequencies of individuals by species. Those with the best curve trend were chosen: geometric, logarithmic and log-normal models (Magurran & McGill, 2011; Moreno-Ortega, 2001; Rocha-Ramírez, Chávez-López, Ramírez-Rojas, & Cházaro-Olvera, 2011). These analyses were carried out with the Species Diversity and Richness v. 4.1.2 software (Seaby & Henderson, 2006).
Bird diversity in each condition was calculated with the Shannon-Wiener index (Magurran & McGill, 2011) in the Species Diversity and Richness v. 4.1.2 software (Seaby & Henderson, 2006). The similarity between conditions was estimated with the Jaccard index (Moreno-Ortega, 2001) in the PAST v. 3.15 software package (Hammer, Harper, & Ryan, 2001).
The possible significant differences in richness, abundance and diversity parameters between rehabilitation conditions were determined by a permutational multivariate analysis of variance (PERMANOVA), and as a post hoc analysis paired tests with Bonferroni’s correction were applied (α = 0.05). PERMANOVA is a non-parametric test that analyzes the difference between two or more groups based on distance measurements and is widely used in ecological studies, because it allows solving the effects related to unbalanced or asymmetric sample sizes (Anderson & Walsh, 2013). The analysis considered α = 0.05 and all tests were performed under 9 999 random permutations, taking the Euclidean distance as a measure of dissimilarity. These analyses were developed in the PAST v. 3.15 software (Hammer et al., 2001).
Results
Bird richness, abundance and diversity
The richness recorded, and reported in Table 1, was 39 species of birds belonging to six orders, 21 families and 32 genera. The best represented families were: Emberizidae with five species, and Parulidae and Tyrannidae with four, while the rest of the families had fewer than two species.
Table 1 Species richness, abundance and conservation status of birds recorded in three forest rehabilitation areas with Pinus gregii (R5 = 5 years, R12 = 12 years and R14 = 14 years) and a reference site (RS) with natural forest of Pinus cembroides and Juniperus flaccida in El Porvenir, Hidalgo, Mexico.
| No. | Species | Conservation status | Family | Abundance | |||
|---|---|---|---|---|---|---|---|
| R5 | R12 | R14 | RS | ||||
| 1 | Aimophila ruficeps (Cassin, 1852) | ○ | Emberizidae | 13 | 14 | 16 | 7 |
| 2 | Aphelocoma ultramarina (Bonaparte, 1825) | ○● | Corvidae | 3 | 0 | 38 | 74 |
| 3 | Calothorax lucifer (Swainson, 1827) | ○□ ■ | Trochilidae | 0 | 1 | 0 | 1 |
| 4 | Catharus guttatus (Pallas, 1811) | ○ | Turdidae | 0 | 0 | 2 | 3 |
| 5 | Corvus corax Linnaeus, 1758 | ○ | Corvidae | 0 | 0 | 2 | 2 |
| 6 | Cyrtonyx montezumae (Vigors, 1830) | ○? | Odontophoridae | 0 | 2 | 6 | 0 |
| 7 | Empidonax sp. | Tyrannidae | 16 | 24 | 3 | 8 | |
| 8 | Eremophila alpestris (Linnaeus, 1758) | ○ | Alaudidae | 0 | 0 | 0 | 6 |
| 9 | Eugenes fulgens (Swainson, 1827) | ○□ | Trochilidae | 0 | 0 | 10 | 0 |
| 10 | Geococcyx californianus (Lesson, 1829) | ○ | Cuculidae | 1 | 2 | 1 | 1 |
| 11 | Haemorhous mexicanus (Müller, 1776) | ○ | Fringillidae | 8 | 16 | 12 | 8 |
| 12 | Icterus parisorum Bonaparte, 1838 | ○■ | Icteridae | 0 | 0 | 4 | 5 |
| 13 | Icterus wagleri Sclater, 1857 | ○ | Icteridae | 0 | 3 | 0 | 1 |
| 14 | Lanius ludovicianus Linnaeus, 1766 | ▲ | Laniidae | 0 | 0 | 0 | 0 |
| 15 | Mniotilta varia (Linnaeus, 1766) | ○ | Parulidae | 2 | 5 | 0 | 9 |
| 16 | Passerina caerulea (Linnaeus, 1758) | ○ | Cardinalidae | 0 | 1 | 4 | 4 |
| 17 | Phainopepla nitens (Swainson, 1838) | ○ | Ptilogonatidae | 1 | 0 | 0 | 0 |
| 18 | Pheucticus melanocephalus Swainson, 1827 | ○■ | Cardinalidae | 0 | 1 | 7 | 1 |
| 19 | Dryobates scalaris (Wagler, 1829) | ○ | Picidae | 1 | 0 | 2 | 3 |
| 20 | Melozone fusca (Swainson, 1827) | ○ | Emberizidae | 2 | 1 | 0 | 0 |
| 21 | Pipilo maculatus Swainson, 1827 | ○ | Emberizidae | 0 | 2 | 0 | 4 |
| 22 | Piranga flava (Vieillot, 1822) | ○ | Thraupidae | 1 | 2 | 10 | 8 |
| 23 | Piranga rubra (Linnaeus, 1758) | ○ | Thraupidae | 2 | 3 | 0 | 2 |
| 24 | Psaltriparus minimus (Townsend, 1837) | ○ | Aegithalidae | 1 | 0 | 3 | 1 |
| 25 | Pyrocephalus rubinus (Boddaert, 1783) | ○ | Tyrannidae | 7 | 6 | 0 | 7 |
| 26 | Regulus calendula (Linnaeus, 1766) | ○ | Regulidae | 0 | 0 | 14 | 2 |
| 27 | Salpinctes obsoletus (Say, 1823) | ○ | Troglodytidae | 0 | 4 | 0 | 22 |
| 28 | Setophaga coronata (Linnaeus, 1766) | ○ | Parulidae | 1 | 1 | 16 | 2 |
| 29 | Setophaga occidentalis (Townsend, 1837) | ○ | Parulidae | 2 | 24 | 0 | 10 |
| 30 | Setophaga townsendi (Townsend, 1837) | ○ | Parulidae | 15 | 0 | 1 | 4 |
| 31 | Spinus psaltria (Say, 1823) | ○ | Fringillidae | 1 | 4 | 4 | 5 |
| 32 | Spizella atrogularis (Cabanis, 1851) | ○ | Emberizidae | 5 | 8 | 24 | 14 |
| 33 | Spizella passerina (Bechstein, 1798) | ○ | Emberizidae | 0 | 2 | 1 | 1 |
| 34 | Thryomanes bewickii (Audubon, 1827) | ○ | Troglodytidae | 0 | 0 | 5 | 1 |
| 35 | Toxostoma curvirostre (Swainson, 1827) | ○ | Mimidae | 3 | 3 | 0 | 13 |
| 36 | Turdus migratorius Linnaeus, 1766 | ○ | Turdidae | 1 | 0 | 1 | 6 |
| 37 | Tyrannus couchii Baird, 1858 | ○ | Tyrannidae | 0 | 0 | 4 | 1 |
| 38 | Tyrannus verticalis Say, 1823 | ○ | Tyrannidae | 0 | 0 | 0 | 3 |
| 39 | Zenaida asiatica (Linnaeus, 1758) | ○ | Columbidae | 0 | 2 | 2 | 3 |
○Minor concern, ▲Near-threatened (International Union for Conservation of Nature [IUCN], 2019); □ Apéndice II (CITES, 2017); ? Subject to special protection (Secretaría de Medio Ambiente y Recursos Naturales [SEMARNAT], 2010); ● Endemic; ■ Semi-endemic.
The results of the Jacknife1 estimator (considering all conditions) showed an expected richness of 47 species; this means that 83 % of the potential species were recorded with the sampling effort, inferring good representativeness of the total sampled. Figure 2 graphically shows the estimated number of species for each condition: R5 = 28, R12 = 30, R14 = 32 and RS = 45. PERMANOVA showed that species richness had highly significant differences (F = 18.27; P = 0.0003) between areas under forest rehabilitation and the reference site: R5-RS (P = 0.01), R12-RS (P = 0.007) and R14-RS (P = 0.007), as well as between areas under forest rehabilitation: R12-R14 (P = 0.035).

Figure 2 Species accumulation curve using the non-parametric Jacknife estimator1 during the period January-June 2015 in three areas of forest rehabilitation with Pinus gregii (R5 = 5 years, R12 = 12 years and R14 = 14 years) and a reference site (RS) with natural forest of Pinus cembroides and Juniperus flaccida in El Porvenir, Hidalgo, Mexico.
Considering the bird richness recorded by study condition, 11 species are generalist (found in all four conditions), 10 are distributed in three conditions, 10 more are recorded only in two conditions, and eight others are exclusive to one or the other (Table 1).
The relative abundance index indicated that, at site R5, Setophaga coronata (Linnaeus, 1766) and Salpinctes obsoletus (Say, 1823) were the most abundant species with 18.6 % and 17.4 %, respectively; in R12 they were Regulus calendula (Linnaeus, 1766) and S. coronata with 18.3 % each; in R14, Aphelocoma ultramarina (Bonaparte, 1825) and Spizella atrogularis (Cabanis, 1851) with 19.8 % and 12.5 %, respectively; and in RS they were A. ultramarina with 30.5 % and Psaltriparus minimus (Townsend, 1837) with 9.1 %. The RS condition had the greatest abundance, while R5 recorded the least. The classification of species for all conditions indicates the presence of nine abundant and 30 non-abundant species: 20 non-abundant for R5, 21 non-abundant and two abundant in R12, 23 non-abundant and two abundant in R14, and 32 non-abundant and two abundant in RS. Abundance distribution analyses suggest that two conditions fit a geometric model: R5 (? 2 = 13.44 < ? 2 = 30.114; df = 19) and R14 (? 2 = 9.944 < ? 2 = 36.415; df = 24); one a logarithmic model: R12 (? 2 = 0.431 < ? 2 = 7.815; df = 3); and another a log-normal model: RS (? 2 = 1.254 < ? 2 = 9.488; df = 4). PERMANOVA showed significant differences (F = 3.689, P = 0.033) between the abundance of species in the areas under forest rehabilitation and the abundance of the reference site: R5-RS (P = 0.014) and R12-RS (P = 0.007).
The Shannon-Wiener index showed a trend in which bird diversity increased as rehabilitation age increased: H’= 2.49 (R5), H’= 2.58 (R12), H’= 2.74 (R14), H’= 2.80 (R). PERMANOVA indicated that there are significant differences (F = 6.492, P = 0.005) in the bird diversity recorded between the areas under forest rehabilitation and the reference site: R5-RS (P = 0.024), R12-RS (P = 0.008) and R14-RS (P = 0.007), as well as between areas under forest rehabilitation: R12-R14 (P = 0.038). For its part, the Jaccard index indicated that the greatest similarity occurs between the R14-RS conditions; that is, the oldest age condition and the reference site, while the minimum similarity occurred between R5 and R14.
Relationship between vegetation structure and avifauna parameters
Only three tree species were recorded in this study: P. greggii, P. cembroides and J. flaccida. In areas under forest rehabilitation (R5, R12 and R14), the dominant species was P. greggii, while in RS the other two species were recorded, with a greater dominance of P. cembroides, whose basal area represents 79.6 % of the total.
Table 2 shows the structural values in the studied conditions. The R14 area had the highest density, basal area and tree height, while the R12 area had the highest DBH. Area R5 had the greatest canopy opening, but had the lowest basal area, height and DBH values.
Table 2 Structural values in three forest rehabilitation areas with Pinus gregii (R5 = 5 years, R12 = 12 years and R14 = 14 years) and a reference site (RS) with natural forest of Pinus cembroides and Juniperus flaccida in El Porvenir, Hidalgo, Mexico.
| Condition | Density (ind·ha-1) | Basal area (m2·ha-1) | Average height (m) | Average diameter (cm) | Canopy opening (%) |
|---|---|---|---|---|---|
| R5 | 1 106 | 0.91 | 2.94 ± 0.70 | 3.24 ± 1.19 | 90.08 |
| R12 | 563 | 8.67 | 7.87 ± 2.24 | 14.01 ± 4.79 | 54.82 |
| R14 | 1 462 | 21.24 | 9.95 ± 1.47 | 13.60 ± 4.00 | 36.40 |
| RS | 722 | 6.51 | 4.09 ± 1.72 | 10.72 ± 5.39 | 62.60 |
± standard deviation of the mean
According to Table 3, 45 species were identified at the understory level, 23 of which have a shrub growth habit and the remaining 22 an herbaceous one. Of the total species, the greatest richness was concentrated in R12 (27 taxa), while the least was in R14 (19 taxa). A third of the recorded richness (33.3 %) was characteristic of secondary vegetation, represented by Mimosa aculeaticarpa Ortega, Dodonaea viscosa (L.) Jacq., Aristida adscensionis L. and Dalea bicolor Willd., species with the highest absolute abundances.
Table 3 Floristic listing and absolute abundance of understory species in three forest rehabilitation areas with Pinus gregii (R5 = 5 years, R12 = 12 years and R14 = 14 years) and a reference site (RS) with natural forest of Pinus cembroides and Juniperus flaccida in El Porvenir, Hidalgo, Mexico.
| No. | Species | Family | R5 | R12 | R14 | RS | Phase* |
|---|---|---|---|---|---|---|---|
| Shrub | |||||||
| 1 | Acourtia thurberi A. Gray | Asteraceae | 0 | 1 | 0 | 0 | Primary |
| 2 | Ageratina adenophora (Spreng.) R. M. King & H. Rob. | Asteraceae | 2 | 0 | 0 | 0 | Primary |
| 3 | Ageratina espinosarum (A. Gray) R. M. King & H. Rob. | Asteraceae | 0 | 9 | 6 | 19 | Primary |
| 4 | Amelanchier denticulata(Kunth) W. D. J. Koch | Rosaceae | 11 | 2 | 0 | 19 | Secondary |
| 5 | Anoda cristata (L.) Schltdl. | Malvaceae | 9 | 2 | 44 | 0 | Secondary |
| 6 | Berberis zimapana (Fedde) Marroq. & Laferr. | Berberidaceae | 0 | 0 | 0 | 10 | Primary |
| 7 | Bouvardia scabrida M. Martens & Galeotti | Rubiaceae | 0 | 4 | 36 | 3 | Primary |
| 8 | Brickellia pendula (Schrad.) A. Gray | Asteraceae | 0 | 7 | 2 | 0 | Primary |
| 9 | Bursera fagaroides (Kunth) Engl. | Burseraceae | 0 | 0 | 0 | 4 | Primary |
| 10 | Calea ternifolia Kunth | Asteraceae | 0 | 0 | 8 | 0 | Primary |
| 11 | Calliandra humilis Benth. | Fabaceae | 0 | 0 | 5 | 0 | Primary |
| 12 | Chrysactinia mexicana A. Gray | Asteraceae | 0 | 4 | 0 | 10 | Primary |
| 13 | Citharexylum tetramerum Brandegee | Verbenaceae | 0 | 2 | 0 | 5 | Primary |
| 14 | Dodonaea viscosa (L.) Jacq. | Sapindaceae | 4 | 2 | 0 | 51 | Secondary |
| 15 | Garrya laurifolia Benth. | Garryaceae | 0 | 0 | 1 | 0 | Primary |
| 16 | Juniperus flaccida Schltdl. | Cupressaceae | 0 | 0 | 1 | 2 | Primary |
| 17 | Karwinskia humboldtiana (Schult.) Zucc. | Rhamnaceae | 4 | 0 | 0 | 1 | Primary |
| 18 | Lantana hirta Graham | Verbenaceae | 0 | 0 | 8 | 0 | Secondary |
| 19 | Lantana velutina M. Martens & Galeotti | Verbenaceae | 0 | 0 | 0 | 3 | Secondary |
| 20 | Mimosa aculeaticarpaOrtega | Fabaceae | 33 | 1 | 13 | 51 | Secondary |
| 21 | Opuntia rastrera F. A. C. Weber | Cactaceae | 0 | 0 | 0 | 8 | Primary |
| 22 | Opuntia streptacantha Lem. | Cactaceae | 2 | 2 | 2 | 0 | Primary |
| 23 | Senna racemosa (Mill.) H. S. Irwin & Barneby | Fabaceae | 0 | 6 | 0 | 4 | Primary |
| Herbaceous | |||||||
| 24 | Acalypha monostachya Cav. | Euphorbiaceae | 6 | 5 | 0 | 1 | Primary |
| 25 | Agave salmiana Otto ex Salm-Dyck | Asparagaceae | 5 | 7 | 1 | 0 | Primary |
| 26 | Aristida adscensionis L. | Poaceae | 0 | 150 | 67 | 10 | Secondary |
| 27 | Astragalus micranthus Desv. | Fabaceae | 1 | 7 | 0 | 0 | Secondary |
| 28 | Bidens odorata Cav. | Asteraceae | 23 | 10 | 0 | 7 | Secondary |
| 29 | Bouteloua curtipendula (Michx.) Torr. | Poaceae | 0 | 24 | 6 | 4 | Secondary |
| 30 | Calylophus hartwegii (Benth.) P. H. Raven | Onagraceae | 0 | 15 | 0 | 0 | Primary |
| 31 | Commelina diffusa Burm. f. | Commelinaceae | 4 | 0 | 0 | 0 | Secondary |
| 32 | Dalea bicolor Willd. | Fabaceae | 122 | 1 | 0 | 37 | Secondary |
| 33 | Echinocactus platyacanthus Link & Otto | Cactaceae | 11 | 0 | 2 | 8 | Primary |
| 34 | Eryngium serratum Cav. | Apiaceae | 0 | 1 | 0 | 0 | Primary |
| 35 | Galium aschenbornii Schauer | Rubiaceae | 0 | 1 | 0 | 0 | Primary |
| 36 | Gibasis pulchella (Kunth) Raf. | Commelinaceae | 7 | 0 | 0 | 6 | Primary |
| 37 | Hieracium abscissum Less. | Asteraceae | 0 | 1 | 0 | 0 | Primary |
| 38 | Mandevilla karwinskii (Müll. Arg.) Hemsl. | Apocynaceae | 0 | 0 | 38 | 11 | Primary |
| 39 | Melampodium sp. | Asteraceae | 0 | 2 | 0 | 11 | Secondary |
| 40 | Pilea microphylla (L.) Liebm. | Urticaceae | 9 | 0 | 76 | 0 | Secondary |
| 41 | Salvia helianthemifolia Benth. | Labiatae | 19 | 116 | 9 | 0 | Primary |
| 42 | Salvia microphylla Kunth | Labiatae | 0 | 0 | 0 | 27 | Primary |
| 43 | Schoenocaulon officinale (Schltdl. & Cham.) A. Gray | Melanthiaceae | 0 | 7 | 0 | 0 | Primary |
| 44 | Sclerocarpus divaricatus (Benth.) Benth. & Hook. f. ex Hemsl. | Asteraceae | 4 | 0 | 0 | 0 | Primary |
| 45 | Verbena gracilis Desf. | Verbenaceae | 6 | 5 | 2 | 0 | Secondary |
In the vegetation, four vertical strata with different intervals could be recognized in all conditions. The number of strata and their upper limit were as follows: R5 with two strata and 4.35 m, R12 with three strata and 11.3 m, R14 with four strata and 12.6 m, and RS with three strata and 8.5 m. The parameters of bird richness, abundance and diversity increased as the number of strata per condition studied increased (Figure 3).

Figure 3 Relationship between bird richness, abundance and diversity, and vertical stratification of vegetation in three forest rehabilitation areas with Pinus gregii (R5 = 5 years, R12 = 12 years and R14 = 14 years) and a reference site (RS) with natural forest of Pinus cembroides and Juniperus flaccida in El Porvenir, Hidalgo, Mexico.
Discussion
The species richness trend is consistent with that found by Flores and Galindo-González (2004), who recorded greater bird richness in conserved forests than in forests under forest rehabilitation. In this study, as in ours, the structure and composition of birds were different between conditions, since there was a greater number of generalist species, which are characteristic of disturbed forests. In this regard, Gil-Tena (2010) points out that some bird species can be classified as generalists, since they have the ability to establish themselves in different and diverse ecosystems to meet their needs for food, shelter and rest.
On the other hand, the results do not coincide with the hypothesis of intermediate disturbance proposed by Connell (1978), who suggests that habitats with intermediate recovery ages increase their diversity exponentially. This study found a gradual sequence of development of both avifauna and vegetation, suggesting that rehabilitation time positively affects the parameters studied; therefore, reforestation actions in disturbed sites should be increased to favor the conservation of this faunal group. Due to its high growth rate (height, diameter and cover) and the considerable contribution of organic matter (leaf litter), P. greggii is an ideal species to create favorable microsites for the establishment of native species during initial forest stages (Gutiérrez, Méndez, Flores, Ramírez, & Gutiérrez, 2012; Gómez-Romero et al., 2012). These factors probably influenced the avifauna and vegetation parameters in the disturbed areas of El Porvenir, Hidalgo, Mexico.
If one accepts the proposal of Hill and Hamer (1998), in the sense that an undisturbed community conforms to the log-normal series, it can be argued that there is a homogeneous and equitable partition of available resources in the RS. On the other hand, in this community, the undergrowth recorded the highest number of primary species and the maximum equity with respect to the rest of the conditions (Table 3). In addition, the RS maintains a canopy with several strata that favor the presence of faunal species characteristic of conserved habitats, several of them endemic (A. ultramarina, Calothorax lucifer [Swainson], 1827, Icterus parisorum Bonaparte, 1838, and Pheucticus melanocephalus Swainson, 1827) or in some category of risk in the national and international context such as C. lucifer and Eugenes fulgens (Swainson, 1827) (CITES, 2017). The results indicate that this plant community could be in ecological equilibrium, which in turn is associated with a stable avifauna community.
On the contrary, a community with a certain level of disturbance conforms to the logarithmic series, a situation presented in R12. This suggests that such a condition is not in equilibrium and may be subject to environmental stress as a result of the incipient allometric characteristics of tree vegetation (e.g. large canopy opening and low number of strata). The fit generated for this condition is partly explained by the fact that the samplings are describing small samples from a larger community (Magurran & McGill, 2011). This makes sense, since R12 was found to have the greatest understory richness of all areas under forest rehabilitation, particularly secondary species considered weeds (Vibrans, 2018), in addition to a vertical structure under development. Due to these particularities, and under the assumptions made by McCann (2000), it is possible to state that the R12 condition favors the dominance of a low specific richness of birds in the ecosystem, concentrated in only four species (Aimophila ruficeps [Cassin, 1852], Empidonax sp., Haemorhous mexicanus [Müller, 1776] and Setophaga occidentalis [Townsend, 1837]) of the 23 recorded in this condition.
Rocha-Ramírez et al. (2011) pointed out that environments that conform to a geometric model exhibit unstable communities, a situation that occurs in R5 and R14, where there is a high dominance of some species over available resources, which promotes an imbalance in mutual ecological interactions, generating intra- and interspecific competition at all levels. These characteristics correspond to communities with modified, adverse or early recovery state environments. The above may be related mainly to R5, since it is the youngest condition and is in an initial state of recovery. However, for R14, the fit with this model does not seem to coincide with the rehabilitation age, since in addition to having the greatest number of vertical strata and the highest density, basal area and height values (Table 2), it also presents the greatest bird richness, abundance and diversity (Figure 3); therefore, it is not a condition in early recovery. The inconsistency of the R14 fit to the geometric model may be due to this condition having the smallest canopy opening, which reveals a well-developed crown cover. This situation leads to poor light entry for the development of species in the understory (Campanello, Gatti, Montti, Villagra, & Goldstein, 2011) and therefore results in a lower richness of shrub and herbaceous species. Particularly in R14, less light has benefited pioneering grasses (A. adscensionis and Bouteloua curtipendula [Michx.] Torr.), which have colonized these sites for their allelopathic effects and bunched or cespitose growth (Vibrans, 2018), displacing other species and reducing plant diversity (Alonso, Febles, Ruiz, & Achang, 2006). This in turn has simplified habitat diversity for birds, favoring the abundance of certain bird groups that characteristically use the upper (A. ultramarina) and lower strata (Spinus psaltria [Say, 1823], A. ruficeps, R. calendula and S. coronata).
Patterns in bird species diversity contrast with those recorded by Rangel-Salazar, Enríquez, and Sántiz (2009) and Almazán-Núñez et al. (2009) for other temperate and tropical forests, because they found H' values greater than 3.22. This suggests that the areas under forest rehabilitation in El Porvenir are still in the initial stages of ecological succession, as they exhibit less complexity in both richness and equity. In this way, the recorded bird diversity seems to respond to seasonal factors, since monitoring was only done during the months of January to June 2015. Ramírez-Albores (2013) suggests that topographic, climatic, seasonal and anthropogenic factors directly influence regional and local diversity, particularly the structure and composition of bird communities. Other important factors that could have influenced bird communities are the structure and composition of vegetation, because tree species in rehabilitated environments directly influence the composition and growth form of understory communities (Giorgis, Cingolani, Gurvich, Reynero, & Rufini, 2005), which in turn determine the availability of resources for wildlife (Lawton et al., 1998).
A similar scenario occurs in El Porvenir, specifically in the temperate P. cembroides forest (reference site) and areas under forest rehabilitation with P. greggii, since it was found that bird diversity is associated with plant physiognomy in the vertical plane, determined mainly by rehabilitation actions, as indicated by MacFaden and Capen (2002), Bojorges-Baños and López-Mata (2006) and Salas-Correa and Mancera-Rodríguez (2018). These authors argue that wildlife species, especially birds, tend to increase their diversity depending on the age of the stand, since the older the stand, the greater the structural complexity of the vegetation (greater number of resource strata). This is why forest rehabilitation provides resources required by birds, in quantity and quality, obtaining better natural scenarios as the disturbed forest ages (Holl & Aide, 2011).
Conclusions
This study generated information on the state of bird richness, abundance and diversity in areas under forest rehabilitation, and established the relationship of vegetation structure and composition with rehabilitation actions. The areas under forest rehabilitation evaluated tend to increase bird richness and diversity as the reforestation age increases; the presence of endemic bird species or those in some risk category are recorded in these areas. The Pinus cembroides forest had the highest values of avifauna attributes, which are associated with the complexity of the composition and structure of the vegetation. It is concluded that the conservation of bird diversity in areas under forest rehabilitation is directly related to the time factor.

