


 texto em
  Inglês (pdf)
 Artigo em XML
 Referências do artigo
 Enviar este artigo por email
 Citado por SciELO
  Similares em
SciELO
Similares em
SciELO 
 Permalink
Introduction
Wet deposition influences nutrient cycling and the distribution of pollutants in ecosystems. Many substances reaching the atmosphere react with each other and water; the products resulting from these interactions are washed away by rainfall as solutions or insoluble particles (Duarte, Gioda, Ziolli, & Duó, 2013), causing imbalances in soil composition and properties.
Precipitation in forest ecosystems is divided into throughfall, stemflow and interception loss; a classification that is important in forest hydrology studies (Lida, Tanaka, & Sugita, 2005; Yáñez, Cantú, González, & Uvalle, 2014). Throughfall refers to rainfall under the canopy; that is, the amount of water flowing through the canopy through clearings or by dripping of leaves and branches (Cantú & González, 2005). Intercepted rainfall is the part of the precipitation retained by the canopy that does not reach the forest floor and is returned to the atmosphere by the evaporation process, also called interception loss (Taghi, Attarod, & Bayramzadeh, 2013; Yáñez et al., 2014). Finally, stemflow corresponds to the fraction of rainfall that reaches the forest floor, sliding down the tree stem and branches, which is caused by precipitation intercepted by the canopy components (Staelens, De-Schrijver, Verheyen, & Verhoest, 2008). Net precipitation is the amount of rainfall that reaches the forest floor via throughfall and stemflow (André, Jonard, & Ponette, 2008; Levia & Herwitz, 2005).
The objective of this research was to compare the concentrations of micronutrients and macronutrients in the gross rainfall and in the rainwater reaching the soil by throughfall and stemflow of scrubland species; in addition, the variations of pH and electrical conductivity were analyzed. It should be noted that there is no previous studies of the chemical composition of precipitation within this ecosystem, which could generate important information that can be used in decisions and technical criteria to achieve sustainability of natural resources.
Materials and methods
Study area
The study was conducted at the Experimental Campus of the Faculty of Forest Sciences of the Universidad Autónoma de Nuevo León (24° 47' N; 99° 32' W), located in Linares, Nuevo León. The site has an area of 500 ha and elevation of 350 m. The average monthly temperature varies from 15 to 22 °C and the average annual rainfall is approximately 800 mm. The main type of vegetation is called Tamaulipan thornscrub also known as MET. The dominant soils are dark grey, lime-grey, lime-clay, deep vertisols with montmorillonite (González, Ramírez, Cantú, Gómez, & Uvalle, 2010).
Measurement of gross rainfall, throughfall and stemflow
Gross rainfall (Pi) was measured according to the methodology used by Cantú and González (2001), which is based on the establishment, at random, of four U-shaped PVC gutters in an open area without trees and adjacent to the experimental plots. Each gutter represented a collection area of 0.1 m2 (10 cm wide x 100 cm long), which was placed 1 m high above the ground surface. The gutters were connected to 20 L containers by hoses and covered with a mesh to avoid obstruction and contamination of the precipitation samples.
The throughfall samples (Pd) were collected with the same type and number of gutters already described, but located under the canopy of Acacia farnesiana (L.) Willd. (huizache), Condalia hookeri M. C. Johnst (palo Brasil), Leucaena leucocephala (Lam.) de Wit (huaje), Casimiroa greggii (S. Watson) F. Chiang (yellow chapote), and a plot composed of a heterogeneous canopy characteristic of MET. Table 1 shows the average tree measurement characteristics of each species used.
Table 1 Tree measurement characteristics of the species under study in the Tamaulipan thornscrub.
| Type of coverage | DBH (cm) | Height (m) | Crown area (m2) |
|---|---|---|---|
| Acacia farnesiana (L.) Willd. | 28.3 | 5.3 | 42.2 |
| Condalia hookeri M. C. Johnst | 9.5 | 8.5 | 13.5 |
| Casimiroa greggii (S. Watson) F. Chiang | 17.0 | 7.1 | 22.6 |
| Leucaena leucocephala (Lam.) de Wit. | 7.2 | 9.2 | 4.0 |
| Tamaulipan thornscrub | 7.0 | 7.5 | 4.5 |
The stemflow (Ef) component was measured on four trees in each of the canopies of A. farnesiana, C. hookeri and C. greggii only, because they met the diameter dimensions (>15 cm) needed to place the spiral collector. The collector is a perforated hose with a length of about 2 m, adjusted and sealed with silicone in the stem, to intercept the water that drains around the trunk and collect the sample in a 20 L container.
Chemical analysis
Rainwater samples were taken to the laboratory to determine pH and electrical conductivity (µS·cm-1), using an electrode with a potentiometer-conductivity meter (CORNING, model 542, USA). Then, the samples were filtered with Whatman paper number 1 and cooled to 4 °C to reduce microbial activity until further nutrient analysis.
Nutrient analysis
The concentrations of micronutrients (Fe, Zn, Mn and Cu) and macronutrients (K, Ca and Mg), essential for plant development, were determined in Pi, Pd and Ef. The samples were analyzed using an atomic absorption spectrophotometer (Varían, model SpectrAA-200, USA). The nitrogen (N) content was not evaluated, due to the lack of operational capacity for determination. In the case of macronutrients it was necessary to make dilutions to determine the absorption of radiation at different wavelengths according to the element analyzed, using the following suppressors in order to avoid ionization during the analysis: Calcium (Ca), solutions 1:5 with potassium chloride (KCl); magnesium (Mg), solutions 1:5 with lanthanum chloride (LaCl3); and potassium (K), solutions 1:5 with cesium chloride (CsCl).
Nutrient input
The contribution of macro and micronutrients per event was determined in the Pi, Pd and Ef of the coverages. The nutrient flows were estimated by multiplying the mean nutrient content (mg·L-1) obtained by the spectrophotometer by the corresponding volume (L) of rainwater collected in Pi and Pd, between the area occupied by the gutter (0.10 m2). For Ef, the area of the crown of each tree was considered as the precipitation collector surface, carrying out with it the necessary transformations to convert to mg·m-2 units. The average of the four replications corresponding to each sample of Pi, Pd and Ef collected was estimated per event; in order to determine the annual contribution, all the recorded averages were added together.
The net nutrient input was estimated by adding the concentrations of Pd and Ef (if recorded), according to the same principle as used by Béjar et al. (2018). The net contribution was recorded for the species A. farnesiana, C. greggi and C. hookeri; in the case of L. leucocephala and MET this sum was not considered due to the lack of stemflow, so the net value was the one found in Pd. It should be noted that the addition of Ef did not cause a significant change in the contents of the evaluated nutrients.
Statistical analysis
The data were analyzed through the statistical package SPSS version 22 (International Business Machines [IBM], 2013). The Kolmogorov-Smirnov test of normality and goodness of fit was applied, which rejected the hypothesis of normality of the data. Therefore, non-parametric tests (Kruskal-Wallis) were applied to establish significant statistical differences (P ≤ 0.05) in Pd and Ef nutrient input per event and per annual cumulative between canopy types. Non-parametric comparison tests (Kruskal-Wallis) were also applied to determine significant differences (P < 0.05) in pH and electrical conductivity (EC) values of Pi, Pd and Ef of the coverages recorded per event.
Results and discussion
Gross rainfall
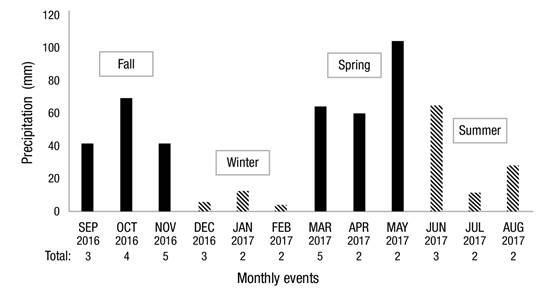
In the period September 2016-September 2017, 41 rainfall events were recorded (Figure 1), in which 508.97 mm were accumulated. The months of November and May had the highest number of events, each with five records. Seasonally, the highest precipitation was recorded in spring with 228.6 mm; in summer, autumn and winter, precipitation was 152.39, 104.89 and 23.03 mm, respectively.
Nutrient input via gross rainfall
Nutrient concentrations in Pi reflect that Ca (76.25 kg·ha-1·year-1) is the macronutrient that enters the soil more often, following in descending order K (20.40 kg·ha-1·year-1) and Mg (9.39 kg·ha-1·year-1). As for micronutrients, the highest contributions were Fe with 521.55 kg·ha-1·year-1, followed by Mn, Zn and Cu with 180.21, 130.16 and 29.10 kg·ha-1·year-1, respectively (Table 2). The trends shown by the macronutrient flows (Ca>K>Mg) via Pi coincide with those obtained by Béjar et al. (2018) and Zhang, Wang, Pan, and Hu (2016).
High Ca contents may be related to ecosystem conditions, since soils are developed on rocks of calcareous origin and, therefore, Ca is in greater mobilization on the environment, unlike the micronutrients Mn, Zn and Cu. On the other hand, Segovia et al. (2009) refer to the fact that Fe is the fourth most abundant element on the earth's crust, which follows the atmospheric route as one of the main access routes, agreeing with the results found in this research.
Nutrient input via throughfall
The results showed differences in nutrient input per event in at least one of the tree coverages, from the value of the bilateral asymptotic (P ≤ 0.05). According to Table 3, the contribution of the macronutrients Ca, K and Mn was different among the species in 17, 20 and nine rainfall events, respectively. With respect to micronutrients, Cu showed significant differences in six of the 41 events analyzed, while Fe, Mn and Zn in 18, 16 and 16 events, respectively. Likely these temporal variations are related to the addition of soil particles and atmospheric dusts, and to the biomass composition of the species at different dates. In events 26, 27, 28 and 37 in Cu and 24 and 34 in Mg the level of significance of the statistical test is not shown, due to the fact that only one of the evaluated species had accumulation of these nutrients, limiting the interspecific comparison. According to the statistics of the Kruskal-Wallis test, there are no differences (P > 0.05) between the annual input of micro and macronutrients among the five tree canopies analyzed.
Table 3 Statistical significance (P-values) of the comparison of nutrient input in the throughfall of five tree canopies (Acacia farnesiana, Condalia hookeri, Leucaena leucocephala, Casimiroa greggii and thorny scrubland) analyzed per event.
| Event | Fe | Mn | Zn | Cu | Ca | K | Mg | Precipitation (mm) | Date |
|---|---|---|---|---|---|---|---|---|---|
| P | P | P | P | P | P | P | |||
| 1 | 0.01* | 0.52 | 0.05 | 0.08 | 0.04* | 0.19 | 0.04* | 3.83 | 23/09/2016 |
| 2 | 0.06 | 0.02* | 0.05* | 0.40 | 0.58 | 0.05 | 0.61 | 15.43 | 26/09/2016 |
| 3 | 0.04* | 0.02* | 0.05 | 0.03* | 0.01* | 0.11 | 0.09 | 22.04 | 27/09/2016 |
| 4 | 0.01* | 0.01* | 0.76 | 0.01* | 0.32 | 0.01* | 0.07 | 6.60 | 01/10/2016 |
| 5 | 0.02* | 0.07 | 0.33 | 0.26 | 0.01* | 0.37 | 0.77 | 2.97 | 02/10/2016 |
| 6 | 0.62 | 0.31 | 0.17 | 0.85 | 0.23 | 0.69 | 0.53 | 47.32 | 13/10/2016 |
| 7 | 0.44 | 0.03* | 0.04* | 0.04* | 0.07 | 0.03* | 0.27 | 12.76 | 22/10/2016 |
| 8 | 0.04* | 0.31 | 0.49 | 0.05* | 0.02* | 0.76 | 0.02* | 0.69 | 04/11/2016 |
| 9 | 0.05* | 0.01* | 0.39 | 0.07 | 0.01* | 0.01* | 0.12 | 15.54 | 05/11/2016 |
| 10 | 0.22 | 0.22 | 0.17 | 0.55 | 0.14 | 0.13 | 0.52 | 0.59 | 07/11/2016 |
| 11 | 0.03* | 0.01* | 0.02* | 0.26 | 0.03* | 0.55 | 0.12 | 8.47 | 09/11/2016 |
| 12 | 0.03* | 0.02* | 0.53 | 0.73 | 0.09 | 0.18 | 0.02* | 16.17 | 14/11/2016 |
| 13 | 0.76 | 0.07 | 0.39 | 0.24 | 0.69 | 0.01* | 0.85 | 2.33 | 05/12/2016 |
| 14 | 0.32 | 0.27 | 0.69 | 0.54 | 0.24 | 0.01* | 0.64 | 3.22 | 09/12/2016 |
| 15 | 0.76 | 0.03* | 0.01* | 0.66 | 0.67 | 0.31 | 0.15 | 0.78 | 28/12/2017 |
| 16 | 0.01* | 0.01* | 0.01* | 0.01* | 0.01* | 0.01* | 0.01* | 0.72 | 06/01/2017 |
| 17 | 0.13 | 0.02* | 0.41 | 0.15 | 0.54 | 0.07 | 0.10 | 0.68 | 07/01/2017 |
| 18 | 0.17 | 0.01* | 0.01* | 0.01* | 0.01* | 0.01* | 0.01* | 11.28 | 28/01/2017 |
| 19 | 0.48 | 0.36 | 0.12 | 0.73 | 0.02* | 0.01* | 0.95 | 3.03 | 04/02/2017 |
| 20 | 0.13 | 0.04* | 0.02* | 0.22 | 0.18 | 0.01* | 0.39 | 0.99 | 25/02/2017 |
| 21 | 0.11 | 0.07 | 0.02* | 0.17 | 0.03* | 0.05* | 0.53 | 7.13 | 05/03/2017 |
| 22 | 0.02* | 0.31 | 0.01* | 0.54 | 0.07 | 0.23 | 0.52 | 7.75 | 08/03/2017 |
| 23 | 0.47 | 0.08 | 0.70 | 0.41 | 0.13 | 0.04* | 0.24 | 11.00 | 10/03/2017 |
| 24 | 0.75 | 0.19 | 0.01* | 0.19 | 0.15 | 0.01* | - | 19.88 | 11/03/2017 |
| 25 | 0.61 | 0.05 | 0.01* | 0.66 | 0.02* | 0.03* | 0.25 | 19.00 | 18/03/2017 |
| 26 | 0.02* | 0.53 | 0.48 | - | 0.17 | 0.01* | 0.93 | 56.50 | 12/04/2017 |
| 27 | 0.43 | 0.08 | 0.29 | - | 0.67 | 0.01* | 0.02* | 3.50 | 23/04/2017 |
| 28 | 0.03* | 0.20 | 0.06 | - | 0.15 | 0.01* | 0.05* | 3.00 | 04/05/2017 |
| 29 | 0.11 | 0.06 | 0.35 | 0.37 | 0.03* | 0.01* | 0.02* | 0.88 | 07/05/2017 |
| 30 | 0.06 | 0.11 | 0.20 | 0.44 | 0.01* | 0.01* | 0.11 | 1.93 | 11/05/2017 |
| 31 | 0.01* | 0.01* | 0.40 | 0.42 | 0.05* | 0.37 | 0.11 | 11.50 | 12/05/2017 |
| 32 | 0.01* | 0.01* | 0.53 | 0.47 | 0.05 | 0.06 | 0.34 | 0.99 | 23/05/2017 |
| 33 | 0.01* | 0.01* | 0.07 | 0.81 | 0.38 | 0.11 | 0.72 | 5.13 | 24/05/2017 |
| 34 | 0.01* | 0.01* | 0.05* | 0.09 | 0.07 | 0.22 | - | 80.50 | 30/05/2017 |
| 35 | 0.01* | 0.11 | 0.01* | 0.19 | 0.60 | 0.07 | 0.03* | 0.62 | 20/06/2017 |
| 36 | 0.01* | 0.11 | 0.01* | 0.09 | 0.01* | 0.08 | 0.10 | 10.90 | 26/06/2017 |
| 37 | 0.05 | 0.06 | 0.33 | - | 0.18 | 0.39 | 0.08 | 53.38 | 28/06/2017 |
| 38 | 0.88 | 0.57 | 0.47 | 0.17 | 0.10 | 0.05 | 0.36 | 10.28 | 07/07/2017 |
| 39 | 0.15 | 0.70 | 0.84 | 0.47 | 0.03* | 0.01* | 0.06 | 1.50 | 09/07/2017 |
| 40 | 0.12 | 0.21 | 0.01* | 0.55 | 0.04* | 0.01* | 0.15 | 23.13 | 04/08/2017 |
| 41 | 0.27 | 0.69 | 0.05* | 0.54 | 0.06 | 0.25 | 0.30 | 5.10 | 05/08/2017 |
*Values with significant differences (Kruskal-Wallis P ≤ 0.05) in nutrient input among species.
Figure 2 shows that A. farnesiana was the species with the highest contributions of Ca and K (72.33 and 33.10 kg·ha-1·year-1, respectively) in Pd, while the highest content of Mg was found in the plot corresponding to MET with 13.55 kg·ha-1·year-1. In general, a part of the Ca contribution via rainfall is retained by all the tree canopies, while Mg is slightly retained only in C. hookeri and L. leucocephala with contributions of 9.03 and 8.31 kg·ha-1·year-1 with respect to those thrown by Pi (9.62 kg·ha-1·year-1). This coincides with Béjar (2018), Jiménez, Calvo, and Arias (2006), and Jaramillo (2003), who describe a removal of these nutrients as precipitation passes through the canopies.

Figure 2 Contribution of macronutrients via throughfall for each plant canopy and via gross rainfall (Pi).
The concentration of K was significantly enriched by the five canopies evaluated. The average enrichments showed 1.38 times more than that recorded in Pi; therefore, K is a mobile nutrient in plants and leaches more easily. This enrichment may be an effect of chemical interactions between rain, dry deposition, exudations and canopy leaching (Návar, González, & González, 2009). Other studies have shown this same behavior; for example, Jaramillo (2003) found that K increased, when passing through the aerial part, up to 9.6 times more than the estimated amount of rainwater, variation mainly caused by foliar washing; Shen, Ren, Jenerette, Hui, and Ren (2013) found increases of about 20 times in Pd in plantations of Dimocarpus longan Lour and Acacia mangium Wild.
According to Table 4, Pd followed the same trend in micronutrient intake for all coverages analyzed: Fe>Zn>Mn>Cu. Casimiroa greggii canopy had the highest amount of Fe with 889.53 g·ha-1·year-1, MET had the highest values of Zn and Mn with 203.38 and 118. g·ha-1·year-1, respectively and, finally, A. farnesiana had the highest amount of Cu with 65.03 g·ha-1·year-1.
Table 4 Annual contribution of micronutrients via throughfall per canopy type.
| Type of coverage | Input (g·ha-1·year-1) | |||
|---|---|---|---|---|
| Fe | Mn | Zn | Cu | |
| Acacia farnesiana | 655.96 | 102.46 | 150.8 | 65.03 |
| Condalia hookeri | 613.43 | 55.5 | 130.7 | 58.31 |
| Casimiroa greggii | 889.53 | 73.13 | 160.97 | 45.1 |
| Leucaena leucocephala | 394.18 | 101.86 | 115.43 | 26.59 |
| Tamaulipan thornscrub | 342.11 | 118.93 | 203.38 | 31.64 |
| Total | 2 895.21 | 451.88 | 761.28 | 226.67 |
Nutrient input via stemflow
The contribution of calcium in Ef of the three species studied showed significant differences in nine of the 24 rainfall events analyzed, while K and Mg showed differences in six events. Cu, Fe, Mn and Zn showed differences in four, six, five and 10 rainfall events, respectively. In the case of Cu, the events 14, 23, 24, 26 and 27 were not compared due to the null contribution of two of the species evaluated, repeating this situation in event 34 in Mg (Table 5).
Table 5 Statistical significance (P values) of the comparison of nutrient contribution in the stemflow of three coverages (Acacia farnesiana, Condalia hookeri, Casimiroa greggii) analyzed per event.
| Event | Cu | Fe | Mn | Zn | Ca | K | Mg |
|---|---|---|---|---|---|---|---|
| P | P | P | P | P | P | P | |
| 13 | 0.18 | 0.08 | 0.10 | 0.08 | 0.08 | 0.08 | 0.08 |
| 14 | - | 1.00 | 0.05 | 0.05 | 0.05 | 0.05 | 0.05 |
| 15 | 0.18 | 0.18 | 0.18 | 0.18 | 0.18 | 0.32 | 0.22 |
| 16 | 0.49 | 0.08 | 0.20 | 0.34 | 0.30 | 0.57 | 0.25 |
| 17 | 0.08 | 0.04* | 0.08 | 0.30 | 0.20 | 0.05* | 0.61 |
| 18 | 0.08 | 0.03* | 0.02* | 0.02* | 0.02* | 0.02* | 0.04* |
| 19 | 0.23 | 0.06 | 0.03* | 0.03* | 0.04* | 0.23 | 0.04* |
| 21 | 0.02* | 0.02* | 0.08 | 0.02* | 0.02* | 0.04* | 0.03* |
| 22 | 0.22 | 0.03* | 0.03* | 0.03* | 0.03* | 0.03* | 0.03* |
| 23 | - | 0.62 | 0.06 | 0.03* | 0.74 | 0.07 | 0.72 |
| 24 | - | 0.15 | 0.04* | 0.04* | 0.02* | 0.03* | 0.12 |
| 25 | 0.32 | 0.20 | 0.02* | 0.04* | 0.11 | 0.12 | 0.26 |
| 26 | - | 0.38 | 0.41 | 0.11 | 0.63 | 0.38 | 0.74 |
| 27 | - | 0.86 | 0.34 | 0.08 | 0.86 | 0.34 | 0.50 |
| 28 | 0.22 | 0.08 | 0.23 | 0.09 | 0.09 | 0.08 | 0.20 |
| 30 | 0.21 | 0.11 | 0.18 | 0.34 | 0.04* | 0.15 | 0.41 |
| 31 | 0.11 | 0.02* | 0.02* | 0.10 | 0.03* | 0.12 | 0.18 |
| 33 | 0.04* | 0.03* | 0.59 | 0.55 | 0.41 | 0.30 | 0.04* |
| 34 | 0.02* | 0.32 | 0.16 | 0.05* | 0.30 | 0.15 | - |
| 36 | 0.37 | 0.07 | 0.20 | 0.19 | 0.07 | 0.08 | 0.38 |
| 37 | 0.30 | 0.57 | 0.90 | 0.75 | 0.44 | 0.93 | 0.17 |
| 38 | 0.70 | 0.44 | 0.68 | 0.42 | 0.53 | 0.45 | 0.82 |
| 40 | 0.03* | 0.14 | 0.28 | 0.02* | 0.03* | 0.02* | 0.03* |
| 41 | 0.16 | 0.46 | 0.18 | 0.03* | 0.05* | 0.23 | 0.08 |
*Values with significant differences (Kruskal-Wallis P ≤ 0.05) in nutrient input among species.
The nutrients found were lower than those deposited via Pi and Pd. According to Table 6, the macronutrient and micronutrient with the highest mean annual intake were Mg and Fe with 0.52 kg·ha-1·year-1 and 43.08 kg·ha-1·year-1, respectively. According to the results, C. greggii had the highest values of Mg, Ca Fe, Zn, Cu and Mn, and C. hookeri provided K in greater quantity.
Table 6 Contribution of macronutrients and micronutrients via stemflow per type of canopy.
| Canopy | Macronutrients (kg·ha-1·year-1) | Micronutrients (g·ha-1·year-1) | |||||
|---|---|---|---|---|---|---|---|
| Ca | K | Mg | Fe | Mn | Zn | Cu | |
| Acacia farnesiana | 0.02 | 0.01 | 0.07 | 5.66 | 0.52 | 0.47 | 0.18 |
| Condalia hookeri | 0.07 | 0.06 | 0.19 | 10.29 | 0.72 | 1.38 | 0.49 |
| Casimiroa greggii | 0.09 | 0.04 | 0.26 | 27.13 | 2.27 | 3.34 | 3.10 |
| Total | 0.18 | 0.11 | 0.52 | 43.08 | 3.51 | 5.19 | 3.77 |
Studies estimating nutrient fluxes do not routinely consider Ef analysis because it is volumetrically lower compared to Pd per event (Germer, Zimmermann, Neill, Krusche, & Elsenbeer, 2012; Zhang et al., 2016); however, in the present study, the accumulated annual contribution of nutrients via Ef is considerable, representing 0.80 and 6.4 % of macro and micronutrients, respectively, in relation to that provided by Pi. One explanation for the low concentrations of nutrients in Ef is that, during the circulation of water through the stems, there was considerable absorption by epiphytic bryophytes (mosses and lichens). These grow abundantly in the stems and trunks of trees, and contribute to the uptake and release of nutrients (Dawoe, Barnes, & Oppong, 2018; Liu, Fox, & Xu, 2003).
Net input of nutrients
The net values for macronutrients showed the order Ca>K>Mg, where the tree structure of A. farnesiana provided the maximum Ca and K contents, while the MET canopy type added more Mg. Total micronutrient contributions showed the following trend: Fe>Zn>Mn>Cu, where the highest values of Zn and Mn were deposited in the MET plot, Fe in C. hookeri, and Cu in A. farnesiana (Table 7).
Table 7 Net contribution of macro and micronutrients per type of canopy.
| Type of coverage | Macronutrients (kg·ha-1·year-1) | Micronutrients (g·ha-1·year-1) | |||||
|---|---|---|---|---|---|---|---|
| Ca | K | Mg | Fe | Mn | Zn | Cu | |
| Acacia farnesiana | 72.35 | 33.16 | 11.42 | 661.62 | 102.98 | 151.27 | 65.21 |
| Condalia hookeri | 57.47 | 28.57 | 9.09 | 623.72 | 56.22 | 132.08 | 58.8 |
| Casimiroa greggii | 66.44 | 28.68 | 9.67 | 916.66 | 75.40 | 164.31 | 48.2 |
| Leucaena leucocephala | 55.21 | 27.45 | 8.31 | 394.18 | 101.86 | 115.43 | 26.59 |
| Tamaulipan thornscrub | 67.85 | 23.78 | 13.55 | 342.11 | 118.93 | 203.38 | 31.64 |
| Total | 319.31 | 141.63 | 52.05 | 2 938.29 | 455.38 | 766.47 | 230.44 |
During the evaluation period, between the concentrations of Pi and the five coverages (Pd and Ef) analyzed, a total average of 675.16, 260.96, 857.32 and 3458.15 g·ha-1·year-1 of Mn, Cu, Zn and Fe, respectively, and 217.88, 72.45 and 328.70 g·ha-1·year-1 of K, Mg and Ca, respectively, was incorporated into the soil.
The results obtained in the present research showed variations in nutrient input between canopies, validating that many of the aspects in the nutrient cycle are directly affected by the morphology of the species and phenology (Cantú & González, 2001; Germer, Elsenbeer, & Moraes, 2006; Jaramillo, 2003; Lilienfein & Wilcke, 2004; Návar et al., 2009).
pH
The Kruskal-Wallis test showed no statistically significant differences (P > 0.05) in pH between Pd and Ef circulating through the analyzed coverages and the gross rainfall in the analyzed events.
During the evaluation period, variations were observed between the pH of Pi and the Pd of the studied species. According to the results, it is reasonable to suppose that rain, when flowing through the tree cover, recharges mineral salts deposited in the foliage, which causes pH variations in Pd with respect to Pi. The most significant change occurred in the Pd of the canopy of A. farnesiana, with an overall average of 7.19, with respect to the Pi with an average value of 6.88, while the Pd of MET and L. leucocephala showed fewer alterations.
Figure 3 shows that in event 13, the Pi had a pH of 5.65 (slightly acidic), which was lower than those determined in the Pd, where rainwater, flowing through the canopy of each species, suffered a significant change reducing acidity as a result of the dragging of cations such as K and Mn. On the other hand, in the events 32 and 35 the opposite occurred, specifically in the plot of MET it was observed that the Pd, at the moment of flowing through the canopy of the trees, had acidification with a difference of 1.4 in relation to the pH of Pi; it should be noted that both events showed precipitations less than 5 mm.

Figure 3 Variation of the pH in the throughfall of each plant canopy and in the gross rainfall (Pi). MET: Tamaulipan thornscrub.
The downward trend in pH as it passes through the canopy has also been documented in other ecosystems and has been attributed mainly to the presence of organic acids and other volatile particles in tree structures, as well as to the volume of Pd and Ef, which may have occurred in the MET plot in the events 32 and 35. For example, Jiménez et al. (2006) showed that the pH of Pi had a value of 5.58 with a slight increase as it passed through the treetops, reaching values of 5.83 in Vochysia ferruginea Mart, 5.98 in Vochysia guatemalensis Standl. and 5.96 in a secondary forest.
In a similar way, Abbasian, Attarod, Sadeghi, Van Stan, and Hojjati (2015) evaluated the nutrient input in Pd of a plantation of Picea abies (L.) Karst and a forest of Fagus orientalis Lipsky in northern Iran, and reported pH values between 7 and 7.5 for both species. These values are similar to the results for A. farnesiana and C. hookeri considered slightly alkaline, while C. greggii, MET and L. leucocephala had slight acidity. In northeastern Mexico, Cantú and González (2001) observed that the pH values of Pd in the canopies of pine (6.2), oak (6.3) and pine-oak (6.3) were more acidic than gross rainfall (6.6).
Ef recorded a total of 24 events, which were measured only in A. farnesiana, C. hookeri and C. greggii, showing mean pH values of 6.63, 6.64 and 6.45, respectively; with a slight increase in acidity compared to Pi (6.74) (Figure 4). This result coincides with that of Yáñez et al. (2014), who evaluated the hydrological properties of a fragment of MET and indicated that the pH for Pi (7.4) decreased when circulating through this precipitation redistribution pathway (Ef = 6.9), which could have been caused by the presence and dragging of organic acids and other particles present in the stem component.

Electrical conductivity
The Kruskal-Wallis test did not show significant statistical differences (P > 0.05) in the EC between the paths circulating through the analyzed coverages (Pd and Ef) and Pi in the analyzed events.
The results indicate an increase of the EC to the passage of water through the canopies in relation to that observed in Pi (59.93 µS·cm-1), due to the deposit of solids and mineral salts. The Pd with the highest mean EC value in the 41 events evaluated corresponds to C. hookeri with 191.36 µS·cm-1, followed by the canopy of MET, A. farnesiana, L. leucocephala and C. greggii with 166.73, 155.13, 129.10 and 125.34 µS·cm-1, respectively (Figure 5).

Figure 5 Behavior of electrical conductivity in throughfall for each plant canopy and gross rainfall (Pi). MET: Tamaulipan thornscrub.
The EC analysis in Ef showed a similar behavior to Pd, recording values of 56.49 µS·cm-1 in Pi, while A. farnesiana had the highest records with 219.16 µS·cm-1, followed by C. hookeri and C. greggii with 155.57 and 92.01 µS·cm-1, respectively (Figure 6). The results are similar to those found by Yáñez et al. (2014) in the MET evaluation, where they recorded values of 71.7 µS·cm-1 for Pi, 145 µS·cm-1 for Pd and 126.8 µS·cm-1 for Ef.

The dragging of cortical anions and the low cation release are responsible for the increase in electrical conductivity. Pérez, Cetina, Aldrete, Fenn, and Landois (2006) mention that the increase of the EC of Ef and Pd, with respect to Pi, can be justified by the concentration effect, because when the quantity and occurrence of rainfall events decrease there is a greater accumulation of ions in the atmosphere, which are washed away by the later rain.
Conclusions
The annual accumulation allowed detecting variations in the contributions between gross rainfall (Pi), throughfall (Pd) and stemflow (Ef), stating that the Pd pathway is the one that deposits nutrients to the soil to the greatest extent. In general, no statistical differences were found in the total annual contribution of micro and macronutrients between the five coverages in 41 rainfall events. The benefits offered by rainfall and scrub vegetation in the cycling and enrichment of nutrients to the soil have been established, allowing the proposal of conservation, restoration and use strategies for this type of ecosystem.

