


 texto en
  Inglés (pdf)
 Artículo en XML
 Referencias del artículo
 Enviar artículo por email
 Citado por SciELO
  Similares en
SciELO
Similares en
SciELO 
 Permalink
Introduction
The study of soil carbon (C) and nitrogen (N) together is very important because the two elements are related to soil fertility (Brevik, 2009; Yang, Luo, & Finzi, 2011) and quality (Brevik, 2009; Sainju et al., 2011), as well as the generation of negative environmental impacts (Elliott et al., 2009; Kassam et al., 2012). The C and N cycles interact closely and it has been established that the contribution of C is strongly related to the availability of N in the soil (Yang et al., 2011). Research indicates that soil use (Gelaw, Singh, & Lal, 2014), management practices (Wang, Wu, Zhu, & Shi, 2014) and soil and vegetation types (Fu, Shao, Wei, & Horton, 2010) influence soil organic carbon (SOC) and total soil nitrogen (Nt) contents. Accordingly, it is possible that, due to changes in land use and vegetation types, the dynamics of C and N will change, affecting their concentrations and contents in the soil.
Land-use change alters SOC and Nt because it affects the organic matter (OM) content, which is regulated by the decomposition of organic waste (Maia, Xavier, Oliveira, Mendonça, & Filco, 2008). Naturally, the amounts of C and N in the soil vary according to the amounts contributed by plant residues and the losses resulting from erosion and oxidation by microorganisms (Damacena de Souza et al., 2009). Therefore, soil OM is involved in the equilibrium of the C and N cycles; its content is stable in soils under native vegetation (Bortolon, Mielniczuk, Tornquist, Lopes, & Fernandes, 2009). The imbalance occurs when the contribution of plant residues to the soil is less than the production of biomass (Cerri, Feigl, & CerrI, 2008) and when native vegetation, such as tropical montane cloud forest, is replaced by another type of vegetation.
The replacement of native vegetation causes changes in both the dynamics of organic waste inputs and their rate of decomposition and loss (de Souza, Alves de Castro, Gomes de Souza, & de Carvalho, 2011). In Mexico, the native vegetation of the Huatusco area, Veracruz, has been replaced by agroforestry systems and coffee monoculture (Espinoza-Domínguez, Krishnamurthy, Vázquez-Alarcón, & Torres-Rivera, 2012); research results and the benefits of the systems studied are given based on the type of cover without quantifying its magnitude, a variable that can have greater impact.
Little has been studied about C and N in soils in relation to the type and density of plant cover; although it is claimed that the increase in aboveground biomass may increase carbon sequestration (Nair, 2011), the effects on C and particularly on N are unclear (Hoogmoed et al., 2012). Effects vary between species and ages of trees, and between types, conditions, depths and previous land uses (Paul, Polglase, Nyakuengama, & Khanna, 2002).
The aim of this study was to determine the concentration and content of SOC and N in the soil, as a function of the type and magnitude of the plant cover of tropical montane cloud forest systems, full sun coffee monoculture, coffee agroforestry system as a traditional polyculture and coffee agroforestry system as a commercial polyculture. This is in order to determine: a) the effect of systems with different plant cover on the concentration and content of COS and N in its total, organic, ammoniacal, nitric and mineral forms, b) the relationship between the concentrations of SOC and N in its forms, and c) the C:N ratios in each system.
Materials and methods
Study area
The study was conducted at Chapingo Autonomous University’s Eastern Regional University Center (CRUO), located in the municipality of Huatusco, Veracruz (19° 09’ N and 96° 57’ W), at an elevation of 1 334 m. The area has an (A)C(m)w”b(i’)g climate (García, 1988) with an average annual temperature of 17.2 °C and average annual rainfall of 1 745 mm. The natural vegetation is tropical montane cloud forest. The soils are Luvisols of volcanic origin with finely divided materials that present a large amount of minerals without crystallization, so there are no defined structures. The soils are incipient because the vegetation causes a microclimate of high humidity and relatively low temperature, aspects that slow down soil development (Pérez, 2004); the pH varies between 5.2 and 6.0.
Characteristics of tree and shrub covers
Tropical montane cloud forest (TMCF)
The ecosystem is located at an average elevation of 1 308 m. The preedominant species are Liquidambar styraciflua L. (American sweetgum), Meliosma alba (Schltdl.) Walp. (quiavis), Persea spp. (aguacatillo), Solanum muricatum Aiton (sweet cucumber), Chamaedorea tepejilote Liebm. (pacaya palm), orchids and ferns. For more than 50 years, the land use has not changed.
Coffee agroforestry system as a traditional polyculture (CASTP)
This system is a traditional coffee (Coffea arabica L.) plantation under shade, composed of a great diversity of native trees or natural vegetation, as well as Persea schiedeana Nees (chinene), Inga spp. (Inga) and Grevillea robusta A. Cunn. ex R. Br. (grevillea). Thirty years ago it was used as a pasture for grazing cattle, but since then the land use has changed to the CASTP system. This system is located at an average height of 1 330 m.
Coffee agroforestry system as a commercial polyculture (CASCP)
The commercial polyculture system consists of coffee with associated species that are oriented to commercialization as a productive diversification strategy. The system is 17 years old and is composed of the coffee polyculture, Macadamia integrifolia Maiden & Betche (macadamia nut) and Persea americana Mill. (avocado). The spatial arrangement consists of two rows of coffee plants alternating with a row of macadamia nut and avocado trees interspersed in the same row.
Experimental procedure
In each system, 10 possible sampling points were located, georeferenced (GPS Garmin model eTrex vista HCx armin) and spaced so as to cover the area. In the office phase, based on these 10 points, three were randomly selected and considered as repeats. Each of these three points denoted by their coordinates was the center of a 400 m2 circular area that formed the sampling unit (SU).
The plant cover of each system was characterized and its differences were determined. To do this, the number of trees, shrubs and coffee plants in each SU was counted, measuring the height with a clinometer and a level staff, and the diameter with a diameter tape. The diameter of the trees was measured at 1.30 m from ground level, and that of the shrubs and coffee plants at 15 cm from ground level.
Each circular SU was divided into four parts by drawing two lines perpendicular to each other and passing through the center. The lines divided each SU into four areas delimited by circular arcs called quadrants. The center of each quadrant was visually located and a subsample of soil was taken with an auger at depths of 0 to 10, 10 to 20 and 20 to 30 cm, forming a composite sample for each depth. A total of 36 composite samples were obtained, as a result of the use of four systems, three SUs and three depths.
For each soil sample, bulk density was determined with the probe method (Sánchez-Junco et al., 2011), and total N with the Kjeldahl method according to Official Mexican Standard NOM-021-RECNAT-2000 (Secretaría de Medio Ambiente y Recursos Naturales [SEMARNAT], 2002). SOC was determined by dry combustion, using an automatic carbon analyzer (Shimadzu TOC-5050 A, Japan), and nitrate (NO3 -) and ammonium (NH4 +) were determined by steam distillation (Bremner, 1965). Mineral N (Nmin) was obtained from the sum of the concentration of NO3 - and NH4 +, and organic nitrogen (Norg) was calculated indirectly by subtracting mineral N (Nmin) from total N (Nt). The C:N ratio was determined using SOC and Nt concentration data. The content of SOC and N in each of its forms was obtained with the concentration data and by applying the formula proposed by Ellert and Bettany (1995):
where,
ALMX |
content of SOC or N (Mg·ha-1) in each of its forms |
[X] |
concentration of SOC or N (%) in each of its forms |
ρb |
bulk density of the soil (Mg·m-3) at each depth |
Px |
depths or thickness of the stratum (m) |
Concentration and content data for each depth were subjected to an analysis of variance (ANOVA, P = 0.05) and Tukey’s multiple comparison test (P = 0.05) with the SAS version 9.4 software package (SAS Institute Inc., 2013), to determine the effect of plant covers on these variables. A Pearson correlation was also made between the variables and the effect of the systems on the C:N ratio was analyzed.
Carbon sequestered in aboveground biomass
Carbon in aboveground biomass, as an index of plant cover of tree and shrub species, was determined with allometric equations (Segura, Kanninen, & Suárez, 2006), relating height and diameter attributes with biomass content per individual. The allometric equations used for trees in the tropical montane cloud forest system, agroforestry shade trees, and coffee plants and shrub, respectively, were as follows:
log10Biomass = -0.0834 + 2.223(log10DBH)
log10Biomass = -1.113 +1.578 * log10(DBH) + 0.581 * log10(H)
where,
Y |
biomass (kg DM·individual-1) |
MS |
dry matter (kg) |
DBH |
diameter at breast height (cm) |
H |
height (m) |
After obtaining the biomass value per individual, the total number of individuals per SU was summed and extrapolated to one hectare (kg DM·ha-1). Subsequently, this result was multiplied by the factor 0.5, based on the assumption that 50 % of the total biomass of the species is carbon, as established by the Intergovernmental Panel on Climate Change (IPCC, 2003). Finally, the result was divided by 1 000 to obtain the carbon (Mg C·ha-1) in each sampling unit.
Results and discussion
Magnitude of plant covers
Table 1 shows that the magnitude of carbon sequestered in plant covers, in order from highest to lowest, was as follows: TMCF, CASTP, CASCP and FSCM. In the case of PCI, the order of magnitude from highest to lowest was TMCF, CASTP, FSCM and CASCP. In this variable there was an exchange of position between the FSCM and CASCP covers with respect to the order of magnitude of the carbon sequestered. This exchange occurred because the number of coffee plants (137), their diameter (6.15 cm) and height (2.22 m) were greater in the FSCM system than in CASCP (58 plants with an average diameter of 2.31 cm and an average height of 1.16 m). This order was not reflected by the use of allometric equations, although they also consider the diameter and height of coffee plants and the diameter of trees. The fundamental difference was that the sequestered carbon of the 11 trees of the CASCP system was greater (13.73 Mg·ha-1) than that of the 137 plants of the FSCM (without trees).
Table 1 Average measurement characteristics of the trees, shrubs and coffee plants in each system of the Huatusco area, Veracruz.
| System | NT | TH (m) | DBHT (m) | NS | SH (m) | SD (m) | TN | PCI (m) | CS (Mg·ha-1) |
|---|---|---|---|---|---|---|---|---|---|
| TMCF | 43 | 11.43 | 0.174 | 54 | 4.04 | 0.076 | 97 | 101.73 | 356.60 |
| CASTP | 13 | 8.96 | 0.232 | 79 | 2.24 | 0.057 | 91 | 36.43 | 43.69 |
| CASCP | 11 | 5.04 | 0.121 | 58 | 1.16 | 0.023 | 69 | 8.32 | 14.24 |
| FSCM | 0 | 0.00 | 0.000 | 137 | 2.22 | 0.061 | 137 | 18.73 | 6.29 |
TMCF = tropical montane cloud forest, CASTP = coffee agroforestry as a traditional polyculture (coffee under traditional shade), CASCP = coffee agroforestry as a commercial polyculture (coffee with shade from avocado and macadamia nut trees), FSCM = full sun coffee monoculture, NT = number of trees, TH = average tree height, DBHT = average diameter at breast height of trees, NS = number of shrubs, SH = average shrub height, SD = average shrub diameter, TN = average value of total number of trees and shrubs, PCI = plant cover index, CS = carbon sequestration of trees and shrubs.
Average concentration values of C and N in soil
Table 2 shows that, in general, the order of magnitude of the mean concentrations of SOC, Nt and Norg in the systems, ordered from highest to lowest, is TMCF, CASTP, CASCP and FSCM, which was the same order according to the carbon sequestered. In the TMCF and CASTP systems, the concentrations of these variables at the three depths were statistically similar (P > 0.05), except for SOC at a depth of 0 to 10 cm.
Table 2 Type of plant cover and concentrations of organic carbon and nitrogen at three soil depths in the Huatusco area, Veracruz.
| Variable | System | Depth | |||||
|---|---|---|---|---|---|---|---|
| 0-10 cm | 10-20 cm | 20-30 cm | |||||
| Pr > f | Mean value | Pr > f | Mean value | Pr > f | Mean value | ||
| SOC (%) | TMCF | 0.0001 | 13.94 a | 0.0010 | 10.02 a | 0.0005 | 6.72 a |
| CASTP | 10.01 b | 8.32 a | 7.02 a | ||||
| CASCP | 3.86 c | 3.19 b | 2.19 b | ||||
| FSCM | 4.30 c | 3.34 b | 2.26 b | ||||
| Nt (mg·kg-1) | TMCF | 0.0002 | 10 400.00 a | 0.0144 | 6 500 a | 0.0001 | 4 733.30 a |
| CASTP | 7 300.00 a | 5 167 ba | 4 600.00 a | ||||
| CASCP | 3 133.30 b | 3 000 b | 1 866.70 b | ||||
| FSCM | 3 000.00 b | 2 367 b | 1 566.70 b | ||||
| Norg (mg·kg-1) | TMCF | 0.0002 | 10 357.70 a | 0.0147 | 6 466 a | 0.0001 | 4 712.90 a |
| CASTP | 7 273.10 a | 5 146 ba | 4 578.80 a | ||||
| CASCP | 3 115.00 b | 2 979 b | 1 845.50 b | ||||
| FSCM | 2 981.10 b | 2 348 b | 1 546.80 b | ||||
| NH4 + (mg·kg-1) | TMCF | 0.0163 | 25.37 a | 0.0067 | 18.53 a | 0.0610 | 14.83 a |
| CASTP | 9.27 b | 8.03 b | 9.90 a | ||||
| CASCP | 11.13 b | 12.37 ba | 12.37 a | ||||
| FSCM | 9.27 b | 10.50 b | 8.63 a | ||||
| NO3 - (mg·kg-1) | TMCF | 0.3668 | 16.90 a | 0.0780 | 15.30 a | 0.1550 | 5.60 a |
| CASTP | 17.67 a | 12.90 a | 11.27 a | ||||
| CASCP | 7.23 a | 8.80 a | 8.83 a | ||||
| FSCM | 9.63 a | 8.07 a | 11.23 a | ||||
| Nmin (mg·kg-1) | TMCF | 0.0420 | 42.27 a | 0.0007 | 33.83 a | 0.9684 | 20.43 a |
| CASTP | 26.93 a | 20.93 b | 21.17 a | ||||
| CASCP | 18.37 a | 21.16 b | 21.20 a | ||||
| FSCM | 18.90 a | 18.56 b | 19.87 a | ||||
TMCF = tropical montane cloud forest, FSCM = full sun coffee monoculture, CASTP = coffee agroforestry as a traditional polyculture (coffee under traditional shade), CASCP = coffee agroforestry as a commercial polyculture (coffee with shade from avocado and macadamia nut trees). SOC = soil organic carbon, Nt = total nitrogen, Norg = organic nitrogen, NH4 + = ammonium, nitrates, NO3 - = nitrates, Nmin = mineral nitrogen. For each variable, the mean values with the same letter on the columns are not statistically significant for Tukey’s test (P = 0.05).
In the case of SOC, there are differences in concentrations by type of plant cover (P < 0.05), which is consistent with what was found by Novara, La Mantia, Barbera, and Gristina (2012). Powers (2004) states that the contribution of plant residues has a great influence of the transfer of carbon from vegetation to soil, which could explain about 50 % of the differences observed in the concentration of SOC between various uses and soil types. Probably, the density of the plant cover also influenced the concentrations, since the radiation that reached the soil could be uneven, degrading in a differential way the organic matter by photochemical oxidation, as stated by Gallo, Porras-Alfaro, Odenbach, and Sinsabaugh (2009).
In the case of Nt, the plant cover had an effect on the concentrations of the element. This effect may be related to the microbial communities present in the soil of each system; Ewing, Southard, Macalady, Hartshorn, and Johnson (2007) state that the greater the plant cover the larger the microbial communities that, in turn, recycle nitrogen more efficiently than open space microorganisms. On the other hand, the concentration of Nt decreased with depth in all systems, coinciding with what was found by Heluf and Negassa (2006).
In the TMCF, the concentration of NH4 + at the three depths was higher than those of NO3 -, which seems to indicate that nitrification is not very active in these soils. This may be due to the fact that the TMCF had less aeration. According to Malavolta (2006), the nitrification process occurs under conditions of good soil aeration, necessary for the functioning of nitrifying bacteria, even with acid pH as in the soils of these systems. The high rate of ammonification can also be a product of the high contents of SOC and, therefore, of organic matter. Among the CASTP, CASCP and FSCM systems, the ammonium and nitrate concentrations were more homogeneous.
C and N content in soil
Table 3 shows that the order of magnitude from highest to lowest of the systems, based on SOC, Nt and Norg contents, was TMCF, CASTP, CASCP and FSCM, which coincides with the order of magnitude of plant cover according to carbon sequestration. The contents of these elements decreased as the depth increased.
Table 3 Type of plant cover and organic carbon and nitrogen contents at three soil depths in the Huatusco area, Veracruz.
| Variable (Mg·ha-1) | System | Depth | |||||
|---|---|---|---|---|---|---|---|
| 0-10 cm | 10-20 cm | 20-30 cm | |||||
| Pr > f | Mean value | Pr > f | Mean value | Pr > f | Mean value | ||
| SOC | TMCF | 0.0001 | 98.780 a | 0.0006 | 75.997 a | 0.0004 | 54.553 a |
| CASTP | 82.300 a | 70.340 a | 58.390 a | ||||
| CASCP | 39.483 b | 31.670 b | 21.410 b | ||||
| FSCM | 37.317 b | 31.757 b | 21.880 b | ||||
| Nt | TMCF | 0.0001 | 7.340 a | 0.0383 | 4.910 a | 0.0002 | 3.846 a |
| CASTP | 5.986 a | 4.370 ba | 3.853 a | ||||
| CASCP | 3.033 b | 2.986 ba | 1.866 b | ||||
| FSCM | 2.766 b | 2.246 b | 1.483 b | ||||
| Norg | TMCF | 0.0001 | 7.310 a | 0.0385 | 4.886 a | 0.0002 | 3.826 a |
| CASTP | 5.966 a | 4.353 ba | 3.836 a | ||||
| CASCP | 3.013 b | 2.966 ba | 1.843 b | ||||
| FSCM | 2.746 b | 2.230 b | 1.463 b | ||||
| NH4 + | TMCF | 0.0344 | 0.017 a | 0.0030 | 0.014 a | 0.0889 | 0.012 a |
| CASTP | 0.007 b | 0.006 b | 0.008 a | ||||
| CASCP | 0.011 ba | 0.012 a | 0.012 a | ||||
| FSCM | 0.008 ba | 0.010 ba | 0.008 a | ||||
| NO3 - | TMCF | 0.5307 | 0.012 a | 0.0323 | 0.012 a | 0.1507 | 0.004 a |
| CASTP | 0.015 a | 0.011 a | 0.009 a | ||||
| CASCP | 0.007 a | 0.008 a | 0.009 a | ||||
| FSCM | 0.008 a | 0.007 a | 0.011 a | ||||
| Nmin | TMCF | 0.2820 | 0.030 a | 0.0180 | 0.025 a | 0.6000 | 0.016 a |
| CASTP | 0.023 a | 0.017 b | 0.018 a | ||||
| CASCP | 0.017 a | 0.021 ba | 0.021 a | ||||
| FSCM | 0.017 a | 0.017 b | 0.019 a | ||||
TMCF = tropical montane cloud forest, FSCM = full sun coffee monoculture, CASTP = coffee agroforestry as a traditional polyculture (coffee under traditional shade), AFCPC = coffee agroforestry as a commercial polyculture (coffee with shade from avocado and macadamia nut trees). SOC = soil organic carbon, Nt = total nitrogen, Norg = organic nitrogen, NH4 + = ammonium, nitrates, NO3 - = nitrates, Nmin = mineral nitrogen. For each variable, the mean values with the same letter on the columns are not statistically significant according to Tukey’s test (P = 0.05).
The results showed that the TMCF soil obtained more SOC, although statistically the content was similar (P > 0.05) in the CASTP system. This does not coincide with what was reported by Callo-Concha, Krishnamurthy, and Alegre (2002), who found that, at 1 m of soil depth, the primary forest sequestered 98.78 t·ha-1 of SOC against 113.54 t·ha-1 of SOC for coffee + shade. However, the results did coincide with the findings of Corral-Fernández, Parras-Alcántara, and Lozano-García (2013), who affirm that high SOC values may be due to the amount of litter and dead roots on the surface and the modification of environmental conditions under the trees, such as temperature variation, the shade effect, and differences in rainfall, which slow down mineralization and intensify humification. The greater magnitude of the plant cover and, therefore, the amount of organic waste contributed by the systems increased the SOC, especially at depths of 0 to 10 and 10 to 20 cm; this behavior is similar to that reported by Delgado, Alliaume, García, and Hernández (2006), who indicate that the effect only occurs in horizons A and B.
In the case of Nt, the lowest contents were found in the FSCM and CASCP systems; the lower plant cover caused a decrease in Nt content coinciding with Aranguren, Escalante, and Herrera (1982), who, in a study of a shaded coffee plantation, indicated that the flow associated with leaf litter fall from trees was 86 kg of N·ha-1·year-1, while the contribution of coffee litter was 28 kg of N·ha-1·year-1. The low content in the FSCM could also be due to a progressive depletion of Nt reserves, after the establishment of the plantations. According to Sadeghian, Mejia, and Arcila (2007), the amounts removed in coffee plantations with full sun exposure may exceed 120 kg·ha-1·year-1 of N.
The order of magnitude of the concentrations and contents of SOC, Nt and Norg (Tables 2 and 3) is the same, especially in the 0 to 10 cm and 10 to 20 cm layers. This order corresponds to the magnitude of the plant cover ordered from highest to lowest (TMCF, CASTP, CASCP and FSCM). According to Delgado et al. (2006), the plant cover effect occurs mainly in horizons A and B. In the case of NH4 +, this order was altered, since the CASTP system had the lowest content and concentration. With respect to NO3 - and Nmin, the contents and concentrations were statistically similar (P > 0.05) in the four systems at the three depths, with the exception of Nmin at a depth of 10 to 20 cm, where the content and concentration were higher in the TMCF.
Stratification of carbon and nitrogen contents
Table 4 shows that the order of magnitude of the percentages of SOC, Nt and Norg in each depth was not the same, denoting a different dynamic due to the effect of plant cover. The percentage of SOC, Nt and Norg accumulation occurred mostly in the 0 to 10 cm layer in all systems.
Table 4 Stratification of the organic carbon (SOC), total nitrogen (Nt) and organic nitrogen (Norg) contents in the soil of four systems in the Huatusco area, Veracruz.
| Depth | Variable | TMCF | FSCM | CASTP | CASCP | TMCF | FSCM | CASTP | CASCP |
|---|---|---|---|---|---|---|---|---|---|
| (cm) | (Mg·ha-1) | (% in relation to the total) | |||||||
| 0 -10 | SOC | 98.783 | 39.483 | 82.300 | 37.317 | 43.074 | 42.655 | 38.999 | 41.028 |
| 10 - 20 | 75.997 | 31.670 | 70.340 | 31.757 | 33.138 | 34.214 | 33.331 | 34.915 | |
| 20-30 | 54.553 | 21.410 | 58.390 | 21.880 | 23.787 | 23.130 | 27.669 | 24.056 | |
| Total | 229.333 | 92.563 | 211.030 | 90.954 | 100.000 | 100.000 | 100.000 | 100.000 | |
| 0-10 | Nt | 7.340 | 2.766 | 5.986 | 3.033 | 45.599 | 42.586 | 42.130 | 38.461 |
| 10 -20 | 4.910 | 2.246 | 4.370 | 2.986 | 30.503 | 34.582 | 30.753 | 37.870 | |
| 20-30 | 3.846 | 1.483 | 3.853 | 1.866 | 23.897 | 22.831 | 27.116 | 23.669 | |
| Total | 16.096 | 6.496 | 14.210 | 7.886 | 100.000 | 100.000 | 100.000 | 100.000 | |
| 0-10 | Norg | 7.310 | 2.746 | 5.966 | 3.013 | 45.620 | 42.650 | 42.147 | 38.517 |
| 10 - 20 | 4.886 | 2.230 | 4.353 | 2.966 | 30.497 | 34.627 | 30.750 | 37.921 | |
| 20-30 | 3.826 | 1.463 | 3.836 | 1.843 | 23.881 | 22.722 | 27.101 | 23.561 | |
| Total | 16.023 | 6.440 | 14.156 | 7.823 | 100.000 | 100.000 | 100.000 | 100.000 | |
TMCF = tropical montane cloud forest, FSCM = full sun coffee monoculture, CASTP = coffee agroforestry as a traditional polyculture (coffee under traditional shade), AFCPC = coffee agroforestry as a commercial polyculture (coffee with shade from avocado and macadamia nut trees).
The best system was the TMCF as it obtained the highest SOC, Nt and Norg content values. Regarding the contents in the TMCF, the SOC losses in FSCM, CASCP and CASTP were 136.77, 138.37 and 18.30 Mg·ha-1, representing 59.64, 60.34 and 7.98 %, respectively, while those of Norg were 9.53, 8.20 and 1.86 Mg·ha-1, representing 59.81, 51.18 and 11.65 % in the same order of systems. From the above, it can be inferred that the system with the greatest negative impact was the FSCM followed by the CASCP and CASTP.
Correlation coefficients
Table 5 shows the Pearson correlation coefficients (r) for the 36 concentration data. High positive linear correlation (r > 95 %) was observed between the concentrations of the variables SOC, Nt and Norg, and intermediate positive correlation (r > 60 %) between the concentrations of Nmin with SOC, Nt, Norg, NH4 + and NO3 -, and between NH4 + with Nt and Norg. The high and intermediate correlations coincide with Conant, Paustian, Del Grosso and Parton (2005), who mention that there is a close link between the C and N cycles, mainly in the accumulation of these elements in soil organic matter in temperate and subtropical climates.
Table 5 Pearson correlation coefficients (r) for 36 concentration values of organic carbon and nitrogen in the soil.
| Variable | SOC | Nt | Norg | NH4 + | NO3 - |
|---|---|---|---|---|---|
| Nt | 0.963 | ||||
| Norg | 0.963 | 1.000 | |||
| NH4 + | 0.544 | 0.624 | 0.623 | ||
| NO3 - | 0.417 | 0.336 | 0.334 | 0.117 | |
| Nmin | 0.642 | 0.641 | 0.639 | 0.743 | 0.751 |
SOC = soil organic carbon, Nt = total nitrogen, Norg = organic nitrogen, NH4 + = ammonium, NO3 - = nitrates, Nmin = mineral nitrogen.
Carbon:nitrogen ratio
Figure 1 shows the C:N ratios for soil depths of 0 to 10, 10 to 20 and 20 to 30 cm. There is no trend in the behavior of the ratio based on the magnitude of the plant cover of each system, given by the carbon sequestered (TMCF>CASTP>CASCP>FSCM). Tukey’s test (P = 0.05) showed that there were no significant differences due to the effect of the systems on the C:N ratio for each depth.
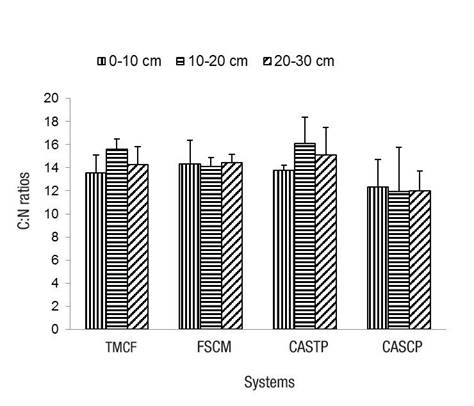
Figure 1 C:N ratios in soils with plant cover of tropical montane cloud forest (TMCF), full sun coffee monoculture (FSCM), coffee agroforestry as a traditional polyculture (CASTP) and coffee agroforestry as a commercial polyculture (CASCP) at three soil depths. There were no significant differences due to the effect of the systems on the C:N ratio for each depth (Tukey, P > 0.05).
In general, it can be noted that the CASCP system, the most altered of the two agroforestry systems with respect to introduced species, had a lower C:N ratio (12.00) than the FSCM (14.29), TMCF (14.48) and CASTP (15.00) systems. Veum, Goyne, Motavalli, and Udawatta (2009) state that a higher C:N ratio indicates a delay in mineralization processes, while a lower C:N ratio denotes a more advanced mineralization process. Also, Parfitt, Yeates, Ross, Mackay, and Budding (2005) indicate that C:N values exhibit a strong negative relationship with N mineralization. According to Watt and Palmer (2012), variation in the C:N ratio can only be attributed to climate, soil type and plant cover; therefore, due to the close location of the systems, the changes were caused by the magnitude of the plant cover of the TMCF, FSCM, CASCP and CASTP systems. The results also coincide with those of Smal and Olszewska (2008), who found that soils with native vegetation had higher C:N ratio values than other types of cover.
Conclusions
The magnitude of the concentrations and contents of C and N in the soil correspond to the magnitude of the plant cover, regardless of type. The tropical montane cloud forest and the agroforestry coffee system as a traditional polyculture had the highest concentrations and contents of SOC, Nt, Norg and NH4 +. Agroforestry systems (with trees) were better at storing C and N than a coffee monoculture system, and the C:N ratio was similar in the systems. The study shows evidence that the magnitudes of plant cover affect the behavior of soil organic carbon and nitrogen, the contents of which are related to soil quality and environmental impact in the generation of greenhouse gases. Therefore, it is important that studies of the effect of systems on soil C and N also consider the magnitude of plant cover.

