


 texto en
  Inglés (pdf)
 Artículo en XML
 Referencias del artículo
 Enviar artículo por email
 Citado por SciELO
  Similares en
SciELO
Similares en
SciELO 
 Permalink
Introduction
Site quality can be defined as the productive capacity of a particular site for the growth of trees of a given species in response to the totality of existing environmental conditions; it commonly refers to the volume of wood a stand produces in a rotation forest (Diéguez et al., 2009; Skovsgaard & Vanclay, 2008). Site quality assessment methods are divided into direct and indirect approaches. Direct methods are based on observations of dominant or co-dominant height; this variable is unaffected by stand density and is a fundamental component in growth and yield models (Pyo, 2017; Seki & Sakici, 2017). On the other hand, indirect ones use the relationships between canopy species, the characteristics of undergrowth vegetation, topographic, climatic and edaphic factors, and the chemical composition of foliage (Chen, Klinka, & Kabzems, 1998; Wang, 1998).
To characterize the forest productivity of the stands, the dominant height expected at a certain age is used and is called the site index (SI) (Martín-Benito, Gea-Izquierdo, Del Río, & Cañellas, 2008). Modeling dominant height and SI is an important tool for classifying the productivity of forest lands and defining management strategies in the application of silvicultural treatments (López-Sánchez, Álvarez-González, Diéguez-Aranda, & Rodríguez-Soalleiro, 2015; Quiñonez-Barraza et al., 2015). One of the most commonly used methods for generating SI curves is the guide curve, which characterizes the height status to determine the current average condition; in contrast, dynamic equations estimate dominant height as a function of current and future age and height (Tamarit-Urias et al., 2014). Dynamic equations are based on the algebraic difference approach (ADA) and generalized algebraic difference approach (GADA). In the ADA method, a parameter of the equation is considered site-specific. Depending on the site-dependent parameter, anamorphic or polymorphic curves are obtained (Bailey & Clutter, 1974). In the GADA equations, two parameters are site-specific and generate families of polymorphic curves with multiple asymptotes (Cieszewski & Bailey, 2000).
Dummy variable (DV) and mixed-effects model (MEM) approaches have been applied in ADA and GADA equations to model dominant height and SI (De los Santos-Posadas, Montero-Mata, & Kanninen, 2006; Nigh, 2015; Tamarit-Urias et al., 2014; Wang, Borders, & Zhao, 2007); results have shown ability to predict and project height as a function of age. In the DV approach, global and local parameters are generated, and in the MEM approach, parameters are fixed and random for each tree or plot. These approaches fit global (common) and specific (local) parameters simultaneously, but differ in the form of estimation (Wang, Borders, & Zhao, 2008). The former is characterized by the addition of dummy variables to the parameter that explains the effect of the tree or plot; it considers local parameters as fixed, but different for each tree or plot. On the other hand, the MEM approach provides a mean response if only the fixed parameters and a specific response per sampling unit, which together form the mixed-effects parameters, are considered. These are estimated by defining a variance-covariance matrix in the model structure (Calama & Montero, 2004; Fang & Bailey, 2001).
In the state of Michoacan, Mexico, Pinus pseudostrobus Lindley is the most important forest species in economic terms, which is why commercial forest plantations have been established that represent a component in timber production (López-Upton, 2002; Sáenz-Romero et al., 2012). Therefore, it is necessary to develop accurate silvicultural techniques for the planning and execution of sustainable forest management activities. In this context, the objective of the research was to fit and compare dynamic dominant height and SI equations with the DV and MEM approaches for P. pseudostrobus in commercial forest plantations in Nuevo San Juan Parangaricutiro, Michoacan, Mexico.
Materials and methods
Study area
The study was conducted in commercial forest plantations of P. pseudostrobus in Nuevo San Juan Parangaricutiro, Michoacan, located between 19° 34’ - 19° 25’ N and 102° 17’ - 102° 00’ W. The total area of the plantations is 12 ha, distributed in the communities of Pario, Huerekutini, Tejamanil I and Tejamanil II. The climate is humid temperate, average annual temperature is 18 °C and average annual rainfall is 1 600 mm (García, 1988). The most abundant soil groups are Andosols, Regosols and Phaeozems. The vegetation is typical of a temperate climate; species that stand out in the arboreal component are Pinus devoniana Lindl., P. montezumae Lamb., P. douglasiana Martínez, P. leiophylla Schiede ex Schltdl. & Cham., P. pseudostrobus Lindl., Quercus laurina Bonpl., Q. castanea Muhl., Q. rugosa Neé, Abies religiosa Kunth Schltdl. et Cham., Arbutus xalapensis Kunth, Cornus disciflora Sessé & Moc., Tilia mexicana Schltdl., Alnus acuminata H. B. K. and Alnus jorullensis Kunth (García-Espinoza et al., 2016).
The database comes from 41 dominant and co-dominant trees aged 26 and 28 years. The trees were felled to obtain cross-sections to 0.3 m, 0.6 m and 1.3 m in length and sections between 2.5 m and 3.3 m up to the total height. Height-age data were obtained with the stem analysis methodology. The sample was obtained at different elevations and exposures to cover the study locations.
Dominant height and site index equations
The base equation was developed by Chapman- Richards (Richards, 1959), which is flexible and has been used to generate SI and height increase curves in relation to age (Cañadas-L et al., 2018; Pyo, 2017; Quiñonez-Barraza et al., 2015; Rodríguez-Carrillo, Cruz-Cobos, Vargas-Larreta, & Hernández, 2015). The equation is represented as:
where
|
height |
|
age |
|
parameter representing the horizontal asymptote |
|
growth rate |
|
change rate |
|
Euler's mathematical constant |
Preliminarily, the ADA1 equation (equation 1) with global and local parameters was fitted so that the database was symmetrical in the growth trajectories, which allowed estimating the height of each tree until 28 years of age. The fitted parameters were different from zero (P < 0.00001) and the coefficient of determination was 99.61 %. The age-symmetrical database was used for fitting the dynamic equations. Descriptive statistics including mean, minimum and maximum values and standard deviation for height-age in the four communities are shown in Table 1.
Table 1 Descriptive statistics of the height-age database of 41 trees sampled in commercial forest plantations of Pinus pseudostrobus in Nuevo San Juan Parangaricutiro, Michoacan, Mexico.
| Community | Variable | Minimum | Maximum | Mean |
|---|---|---|---|---|
| Pario | A | 1.00 | 28.00 | 11.98 ± 8.59 |
| H | 0.30 | 31.20 | 13.42 ± 9.39 | |
| Huerekutini | A | 1.00 | 28.00 | 11.21 ± 8.56 |
| H | 0.30 | 29.38 | 12.42 ± 9.38 | |
| Tejamanil I | A | 1.00 | 28.00 | 11.22 ± 8.39 |
| H | 0.30 | 34.76 | 14.33 ± 10.41 | |
| Tejamanil II | A | 1.00 | 28.00 | 10.78 ± 8.51 |
| H | 0.30 | 34.39 | 13.56 ± 10.12 |
A = age (years); H = height (m); ± standard deviation of the mean.
The ADA1 equation represented anamorphic SI curves with the site-dependent
asymptote parameter (
Modeling approaches
The local parameter of each equation was adjusted with the DV approach to obtain an estimator for each tree; for example, equation 1, according to Wang et al. (2008), was represented as:
where the local parameter (
In the MEM approach, a random-effect formulation was used in each tree, which assumed fixed and random effects. The general structure of the models according to Fang and Bailey (2001) was as follows:
where
|
dynamic function |
|
|
|
|
|
|
|
|
|
age in years of tree |
|
base age in years |
|
dimension equal to the number of parameters with fixed effects (global) |
|
vector of the error term, which was assumed with the property: |
The local random-effect parameter was
In MEMs, the random parameter can be obtained through a calibration process for
an independent sample; a calibrated response requires height measurements for
k trees. The random parameter (
where
|
scalar matrix of random effect variance |
|
matrix of partial derivatives with respect to the mixed parameters |
T |
transposed matrix |
|
scalar matrix of variance within each tree |
|
difference between observed and predicted height, using the fixed-effects equation parameters (Ercanli, Kahriman, & Yavuz, 2014; Jiang & Li, 2010) |
Fitting and evaluation of equations
The DV-formulated equations were fitted by maximum likelihood (ml) with the optimx package, under the nlminb method of the statistical program R (R Core Team, 2017). For the MEM approach, the equations were fitted by maximum likelihood of the nlme package (Pinheiro, Bates, DebRoy, & Sarkar, 2013) in R, except for equation 4 which was fitted by ml with the SAS NLMIXED procedure (SAS Institute Inc., 2014) to achieve convergence of the fixed and random parameters. All the algorithms that allowed searching for the most efficient parameters for the GADA equation with MEM were tested in the SAS software; the Gauss local optimization method gave the highest value in likelihood and the lowest in the average of the random parameter.
The accuracy of the fitted equations by the DV and MEM approaches was evaluated with the log-likelihood (LL) and Akaike information criterion (AIC) statistics; models with the highest LL values and lowest AIC ones were considered the most efficient (Akaike, 1979; Schwarz, 1978; Wang et al., 2008). In addition, the coefficient of determination (R2), the root mean square error (RMSE) and absolute average bias were included, estimated with the residual values of the fitted equations.
Visual analysis is one of the most efficient ways to compare models and detect possible systematic discrepancies (Rojo-Alboreca, Cabanillas-Saldaña, Barrio-Anta, Notivol-Paíno, & Gorgoso-Varela, 2017); therefore, the IS curves were plotted and then superimposed on the observed data. Similarly, the evolution of the bias was analyzed by age categories for the fitted dynamic equations.
The potential problem associated with correlation in height measurements in each tree was not corrected because the structure of the random-effects equations allows the variance-covariance matrix to be represented appropriately, and it is possible to control the specific variation at tree level, which counteracts the autocorrelation effect (De los Santos Posadas et al., 2006; Jerez-Rico, Moret-Barillas, Carrero-Gámez, Macchiavelli, & Quevedo-Rojas, 2011). Other studies have shown that the use of a structure to correct autocorrelation generates little gain in fitting; furthermore, estimated structure parameters are not used in practice (Nord-Larsen, 2006; Wang et al., 2007, 2008).
Results and discussion
Table 2 shows the estimators and standard errors of the global parameters for the DV approach and the fixed ones for MEM. All parameters were different from zero (P < 0.0001). The means of the local and mixed parameters were similar in each fitted equation; the values ranged from 21.71 to 23.76 and the variance from 4.21 to 9.59, respectively (Table 3).
Table 2 Parameters and standard errors of the fitted dynamic equations (algebraic difference [ADA] and generalized algebraic difference [GADA]) of dominant height of Pinus pseudostrobus with the dummy variable (DV) and mixed-effects model (MEM) approaches.
| Equation | MA | Parameter | Estimate | SE | T | Pr > |t| |
|---|---|---|---|---|---|---|
| ADA1 | DV |
|
0.0846 | 0.0026 | 32.3987 | <0.00001 |
|
|
1.4660 | 0.0294 | 49.9292 | <0.00001 | ||
| MEM |
|
23.6931 | 0.4860 | 48.7556 | <0.00001 | |
|
|
0.0845 | 0.0035 | 23.8595 | <0.00001 | ||
|
|
1.4646 | 0.0407 | 36.0047 | <0.00001 | ||
|
|
1.7913 | 0.0975 | 18.3702 | <0.00001 | ||
|
|
9.4095 | 1.7237 | 5.4586 | <0.00001 | ||
| ADA2 | DV |
|
33.3855 | 0.3637 | 91.7950 | <0.00001 |
|
|
1.4776 | 0.0279 | 53.0446 | <0.00001 | ||
| MEM |
|
23.7308 | 0.4428 | 53.5917 | <0.00001 | |
|
|
33.2124 | 0.4101 | 80.9942 | <0.00001 | ||
|
|
1.4857 | 0.0336 | 44.2634 | <0.00001 | ||
|
|
1.3869 | 0.0719 | 19.2725 | <0.00001 | ||
|
|
7.7919 | 2.1989 | 3.5434 | <0.00001 | ||
| ADA3 | DV |
|
36.3964 | 0.5833 | 62.3996 | <0.00001 |
|
|
0.0672 | 0.0025 | 26.8284 | <0.00001 | ||
| MEM |
|
23.7666 | 0.3365 | 70.6316 | <0.00001 | |
|
|
35.6968 | 0.6906 | 51.6920 | <0.00001 | ||
|
|
0.0700 | 0.0032 | 21.7437 | <0.00001 | ||
|
|
1.8990 | 0.2253 | 8.4320 | <0.00001 | ||
|
|
4.3609 | 0.8992 | 4.9256 | <0.00001 | ||
| GADA | DV |
|
4.1259 | 0.0704 | 58.5697 | <0.00001 |
|
|
-0.4242 | 0.0477 | 8.8958 | <0.00001 | ||
|
|
0.0868 | 0.0026 | 33.2023 | <0.00001 | ||
| MEM |
|
21.7156 | 3.8264 | 5.6800 | <0.00001 | |
|
|
4.1242 | 0.0835 | 49.3900 | <0.00001 | ||
|
|
-0.4234 | 0.0565 | 7.4900 | <0.00001 | ||
|
|
0.0868 | 0.0031 | 28.1600 | <0.00001 | ||
|
|
1.3877 | 0.0797 | 17.4100 | <0.00001 | ||
|
|
7.6689 | 1.7419 | 4.4000 | <0.00001 |
MA = modeling approach; SE = standard error of the parameter;
Table 3 Fitting statistics of the dynamic dominant height equations (algebraic difference [ADA] and generalized algebraic difference GADA]) of Pinus pseudostrobus with the dummy variable (DV) and mixed-effects model (MEM) approaches.
| Equation | MA | LL | AIC | R2 | RMSE |
|
|
|
|---|---|---|---|---|---|---|---|---|
| ADA1 | DV | -1 134.84 | 2 355.69 | 0.9817 | 1.3376 | 0.1046 | 23.6918 | 9.5933 |
| MEM | -1 181.24 | 2 454.48 | 0.9816 | 1.3420 | 0.1051 | 23.6930 | 9.1331 | |
| ADA2 | DV | -1 014.74 | 2 115.47 | 0.9858 | 1.1796 | 0.0823 | 23.7273 | 7.9792 |
| MEM | -1 106.50 | 2 305.00 | 0.9857 | 1.1833 | 0.0813 | 23.7307 | 7.6480 | |
| ADA3 | DV | -1 169.47 | 2 424.94 | 0.9806 | 1.3797 | 0.0929 | 23.7496 | 4.6453 |
| MEM | -1 200.11 | 2 492.23 | 0.9804 | 1.3855 | 0.0890 | 23.7665 | 4.2102 | |
| GADA | DV | -1 015.04 | 2 118.07 | 0.9858 | 1.1809 | 0.0705 | 23.7680 | 7.8159 |
| MEM | -1 106.55 | 2 225.10 | 0.9866 | 1.1470 | 0.0715 | 21.7124 | 7.5299 |
MA = modeling approach; LL = log-likelihood; AIC = Akaike information criterion; R2 = coefficient of determination; RMSE = root mean square error,
According to the comparison of the fitting of the modeling approaches with ADA equations, the ADA2 equation (equation 2) with DV obtained the maximum value in LL (-1 014.74) and the lowest in AIC (2 115.47). On the other hand, the GADA equation (equation 4) with DV presented values of -1 015.04 and 2 118.07, in the LL and AIC, respectively, which were similar to those obtained for ADA2 (Table 3). In the equations with DV, the local parameters were totally independent in comparison to MEM, where the random parameters were added to the fixed parameter. This explained the favorable results for DV in terms of LL and AIC, which can be considered as a modified version of LL to take into account the effect of the number of model parameters, even if the same results are obtained in terms of goodness-of-fit (Wang et al., 2008).
In general, the ADA equations with DV were relatively higher than those fitted with MEM. In the ADA equations, the R2 value was higher (98.58 %) and the RMSE one lower (1.17 m) in the ADA2 equation (equation 2) with DV, although with MEM it had the lowest bias. On the other hand, the MEM-fitted GADA equation (equation 4) had the highest R2 value (98.66 %) and the lowest RMSE one (1.14 m); however, the bias was lower with the DV approach (Table 3).
Figure 1 shows that the distribution of local and mixed parameters resembles a normal one and that it was similar for DV and MEM. The random MEM parameters for the ADA group showed a normal distribution with a different degree of kurtosis, and the mean values were close to 0 (−7.32×10⁻¹¹, −9.09×10⁻¹⁶, 7.31×10⁻¹¹ for ADA1, ADA2 and ADA3), while GADA had a value of -0.0030 with the Gauss optimization method (Figure 2). The condition of obtaining a normal distribution of the random parameters with zero mean and known variance is an aspect that must be considered; if this does not happen, it could be a reason to use DV, since in this approach there are no considerations about local parameters, as they are independent of each other and there are no restrictions on the values they can take (Nigh, 2015; Verbeke & Molenberghs 2000; Wang et al., 2008).
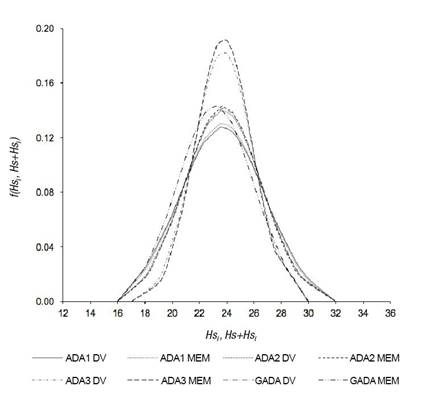
Figure 1 Normal distribution function of the local (Hs
i
) and mixed (
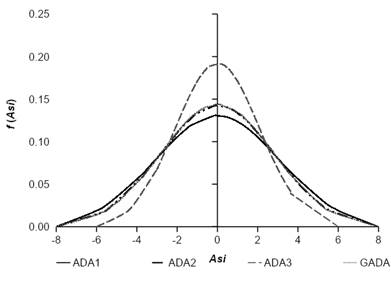
Figure 2 Normal distribution function of the random parameters (As i ) of algebraic difference (ADA) and generalized algebraic difference (GADA) equations with mixed-effects models (MEM).
Figure 3 shows the families of dominant height growth curves with the modeling approaches and the ADA and GADA equations. The SI categories were symmetrical: 18, 22, 26 and 30 m at a base age of 20 years.
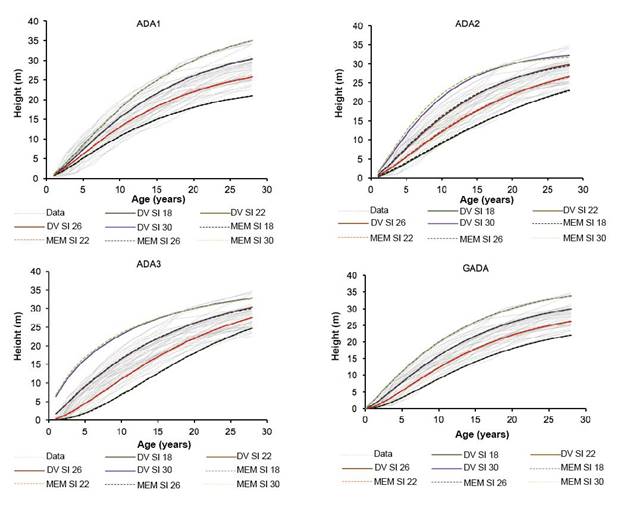
Figure 3 Families of dominant height growth curves of Pinus pseudostrobus for the site index (SI) categories 18, 22, 26 and 30 m, from the fitted algebraic difference (ADA) and generalized algebraic difference (GADA) equations with the dummy variable (DV) and mixed-effects model (MEM) approaches.
At ages from one to 10 years, an underestimation of the dominant height was observed with the curves obtained from the ADA1 equation (equation 1), while for ADA3 (equation 3) an overestimation was observed. The ADA2 (equation 2) and ADA3 equations generate polymorphic curves, and GADA (equation 4), polymorphic with different asymptotes. The use of polymorphic models has been suggested in the literature to adequately represent the age-height relationship (Álvarez, Ruiz, Rodríguez, & Barrio, 2005; Kahriman, Sönmez, & Gadow, 2018; Tewari, Álvarez-González, & García, 2014); however, ADA3 on the 30-m SI curve showed a disarticulation on the basis of the data trend. The trajectories of the GADA-generated curve families better described dominant height growth behavior for the SIs, at the base age of 20 years. The SI values estimated with GADA with DV for the communities of Pario, Huerekutini, Tejamanil I and Tejamanil II were 34, 32, 37 and 36 m, respectively. The commercial forest plantations of Pario and Huerekutini are located in the northeast of Nuevo San Juan Parangaricutiro and have similar topographic characteristics with slopes of 11 to 20 %, while Tejamanil I and Tejamanil II are located in the southwest and slopes vary from 12 to 23 %.
The dynamic equations based on the Chapman-Richards model had results similar to those reported by Pacheco, Santiago, Martinez, and Ortiz (2016), who indicated that the ADA2 and GADA equations were more accurate; however, the latter better described the data and covered the dominant height of P. montezumae with greater amplitude; Quiñonez-Barraza et al. (2015) generated curve families with the GADA equation used in this study, which adequately described the growth of the dominant height of Pinus species in mixed-species stands of Durango. Similarly, González, Cruz, Quiñonez, Vargas, and Nájera (2016) selected the a GADA equation because it presented better goodness-of-fit to predict height growth of P. pseudostrobus.
Figure 4 shows that the trend of the average bias by age category for the equations was similar between modeling approaches and that the highest values occurred in the two-year category. The distribution of bias was higher in the six- to 14-year categories with ADA3 (equation 3), while the values were homogeneous for ADA1 (equation 1), ADA2 (equation 2) and GADA (equation 4).
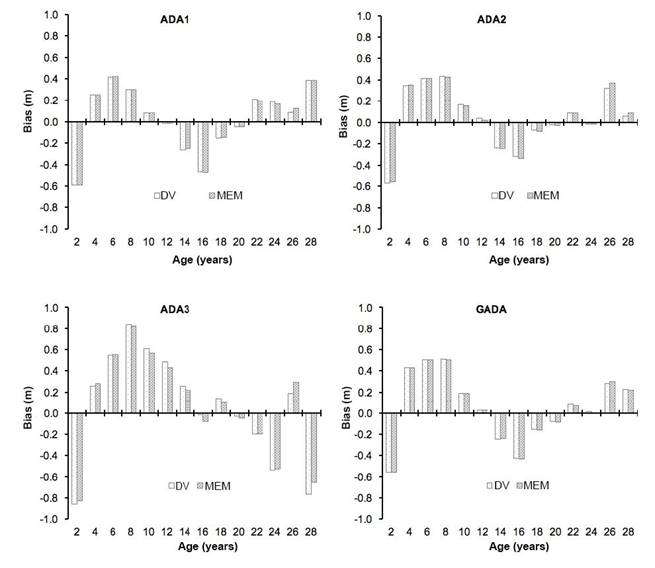
Figure 4 Average bias by age category of the fitted algebraic difference (ADA) and generalized algebraic difference (GADA) equations for Pinus pseudostrobus with the dummy variable (DV) and mixed-effects model (MEM) approaches.
The GADA equation with DV and MEM better described the growth in dominant height; in addition, it presented the greatest efficiency in the fitting statistics. In forest modeling, these approaches have allowed the development of accurate equations with parameters unique to a tree or plot (Jerez-Rico et al., 2011; Pyo, 2017; Sharma, Subedi, Ter-Mikaelian, & Parton, 2015; Tamarit-Urias et al., 2014), which coincides with the results of this study. Although the results of the modeling approaches were similar, the GADA equation with the DV approach had the greatest accuracy; therefore, it is considered that it can be used in the description of the dominant height growth of P. pseudostrobus for the commercial forest plantations studied. The results were similar to those found by Wang et al. (2007, 2008), who concluded that DV and MEM had an almost equivalent yield for dominant height and SI for Pinus tadea L. According to Nigh (2015), a GADA model presented better results with the DV approach for Picea engelmannii Parry ex Engelm. On the other hand, in biomass studies for Pinus massoniana Lamb., both approaches were statistically accurate; however, the use of MEM was more efficient (Fu, Zeng, Tang, Sharma, & Li, 2012).
Conclusions
The dummy variable and mixed-effects modeling approaches were statistically accurate for the algebraic difference (ADA) and generalized algebraic difference (GADA) equations and allowed modeling dominant height growth and generating site index families for P. pseudostrobus. Results suggest that the ADA2 polymorphic equation adequately describes the growth pattern and projects maximum height growth in a rotation forest; however, the GADA equation satisfactorily covered the dominant height growth trajectories and had the highest accuracy with the dummy variable approach. Therefore, the use of the GADA equation with the dummy variable approach allows classifying the productive potential of commercial forest plantations in Nuevo San Juan Parangaricutiro, Michoacan, which have higher site index values in the Tejamanil I and Tejamanil II communities, and lower values in Pario and Huerekutini.

