


 texto en
  Inglés (pdf)
 Artículo en XML
 Referencias del artículo
 Enviar artículo por email
 Citado por SciELO
  Similares en
SciELO
Similares en
SciELO 
 Permalink
Introduction
Trees in public and private forests are often in an advanced and unmanaged state of maturity and therefore pose a risk to goods and people (Koeser & Smiley, 2017). Despite this, a high percentage of the users of green areas (urban forest, peri-urban or camping areas) are convinced that all trees, regardless of their age, location and, in particular, their health, should be kept intact for the benefits they bring. Unfortunately, users do not consider the high cost of preserving them due to the lack of maintenance (Hauer, Vogt, & Fischer, 2015; Ryder & Moore, 2013), or, more importantly, the danger of protecting and conserving individuals at risk of failure (Harris, Clark, & Matheny, 2003). Various forest and park agencies have developed monitoring programs focused especially on recreational areas in order to provide a safe environment for visitors and property (United States Department of Agriculture [USDA], 2014).
The degree of risk of a tree is characterized by structural instability, the size or part of the tree at risk of failure, and its location relative to people or material goods, which are known as targets (Matheny & Clark, 1994). Trees with failure potential include: dead or decaying trees; dead parts attached to living trees (stumps or branches); and trees that are unstable because of a defect in their structure. In this sense, the term "defect" refers to any perceptible characteristic in the tree that contributes to the weakening of its structure and the increase in its potential to fail (Meilleur, 2006). A risk event can cause damage to property, or injure or kill people, especially when the tree obstructs a critical viewing radius, as occurs on highways (Dunster, Smiley, Matheny, & Lilly, 2013).
Tree risk assessments are based on identifying and assessing structural condition to assess failure potential (Matheny & Clark, 2009). The magnitude of the damage caused will depend on the tree species, and the size and location of the defect(s); age is a factor that increases risk. The presence of co-dominant trunks (multiple leaders), large branches arising near the same level in a trunk and branches with weak joints are the most frequent causes of branch breakage (Meilleur, 2006). Leaning individuals may or may not be considered hazardous, depending on the origin of their defect (Dunster et al., 2013); that is, a tree that has grown leaning for most of its life will form compression or tension wood in the trunk, depending on the species (Meilleur, 2006), and a strong root system to compensate for the lean; however, trees that grew vertically, but were subsequently bent by wind, root rot or competition, will have a damaged or unbalanced anchorage system and little resistance to support their own weight (Harris et al., 2003). Other factors that may reduce stability are wood decay fungi (Luley, Nowak, & Greenfield, 2009) and insects that feed on living and dead tissues (Vogt, Hauer, & Fischer, 2015).
Several methods have been developed to evaluate risk trees in order to guide professionals (arborists, urban foresters and maintenance personnel) in the proper inspection of a tree (Bellet-Travers, 2010) and in the identification of factors that influence the perception of risk (Koeser, Klein, Hasing, & Northrop, 2015). In this sense, the present study aimed to identify the defects in trees and the risk they pose in San Juan de Aragon Forest, one of three parks of greatest environmental importance for Mexico City.
Materials and methods
Study area
The study was conducted from April to July 2014 in the park called San Juan de Aragon Forest (BSJA for its initials in Spanish), located in northeastern Mexico City (19? 27?#8242; 32?#8243; N and 99? 04?#8242; 17?#8243; W). In 2008, 55 years after its creation, the BSJA was declared an area of environmental value (Gaceta Oficial de la Federación, 2018); despite this, there is no formally published information on cultural management activities such as fertilization and irrigation. Currently, the forest has 114 ha of wooded areas and other vegetation, divided according to use and infrastructure into 14 sections, of which 10 were included in the present research (B, C, E, F, G, H, J, K, L and M) (Saavedra-Romero et al., 2016) (Figure 1). For each section, a sampling intensity of 2.5 % was applied, recommended by Schreuder, Ernst, and Ramírez-Maldonado (2004), resulting in 28 circular study plots of 0.1 ha. The geoposition of each plot was recorded and all trees within its boundaries were numbered clockwise, starting from the north. The species of each individual was recorded, and the diameter at breast height (DBH) and total height (m) were obtained with a measuring tape and a Haga altimeter, respectively. In the office, the slenderness index (SI) was determined using the formula SI = Height/DBH (Dunster et al., 2013).

Tree defect identification and risk assessment
The methods of Matheny and Clark (1994, 2009) and Dunster et al. (2013) were used to identify and assess trees with failure potential in the BSJA. Each tree in the study plots was visually inspected upwards (root/root collar/trunk/branches/foliage) and with a 360° displacement to obtain a complete perspective of the individual; structural defects were identified by the codes established by the authors. This activity was carried out only once.
Matheny and Clark method
The method considers three factors to estimate the potential risk of a tree: a) failure potential, defined based on the magnitude of the structural defects identified; b) size of the defective part, with the larger the size the higher the damage potential rating; and c) target rating based on the period of use of the area adjacent to the tree evaluated. Each factor was scored from 1 to 4 (Matheny & Clark, 1994, 2009). At the end, the points assigned to each factor were added together to obtain the risk rating (RR), with 12 being the maximum value and 3 the minimum.
Dunster method
This method included two factors. The first was the likelihood of failure, based on the importance of the structural defects identified in the field, as well as the weather conditions prevailing at the time of the evaluation. The second factor was the likelihood of impacting a target, taking into account the occupancy rate of the area. Based on this, scores from 1 to 4 were assigned (Table 1; Figure 2). Once the likelihood of failure and the likelihood of impacting a target were determined, the combined probability of both factors was obtained by means of a matrix, shown in Table 2, to characterize the consequences of the risk.
Table 1 Components evaluated in the identification of trees with failure potential based on the Dunster et al. (2013) method.
| Rating | Likelihood of failure | Likelihood of impacting a target | |||
|---|---|---|---|---|---|
| Category | Defect types | Weather conditions | Category | Occupancy rate | |
| 1 | Improbable | Epicormic shoots and surface cracks | Failure not likely under normal or severe weather conditions in a specified timeframe | Very low | Rare The target zone is not commonly used by people (e.g. isolated trails) |
| 2 | Possible | Surface wounds, oozing, leader branch or other dead branches, included bark | Failure could occur, but not in normal weather conditions | Low | Occasional The target zone is occupied by people or targets infrequently |
| 3 | Probable | Presence of basidiocarps, trunk and branch girdling | Failure likely under normal conditions | Medium | Frequent The target zone is occupied for a large portion of a day or week (does not consider human harm) |
| 4 | Imminent | Cavities affecting more than 50% of the trunk circumference, advanced rot, exposed roots, cankers, deep cracks, tumors, lean and inadequate tapering | Failure can occur in the near future and in any weather condition | High | Constant The target is present nearly all the time, 24 hours a day, seven days a week (considers human harm) |
Figure 2 Examples of likelihood of failure categories based on the type of defect present: improbable (1), possible (2), probable (3) and imminent (4).
Table 2 Combined likelihood matrix for the likelihood of a tree failure impacting a specific target (Dunster et al., 2013).
| Likelihood of failure | Likelihood of impacting target | |||
| Very low | Low | Medium | High | |
| Imminent | Unlikely | Somewhat likely | Likely | Very likely |
| Probable | Unlikely | Unlikely | Somewhat likely | Likely |
| Possible | Unlikely | Unlikely | Unlikely | Somewhat likely |
| Improbable | Unlikely | Unlikely | Unlikely | Unlikely |
Subsequently, the consequences generated by tree failure and impact were categorized according to the value of the target and the damage to it (monetary or otherwise), as follows: a) negligible (low-value property damage or disruptions that can be replaced or repaired; does not involve personal injury); b) minor (low to moderate property damage, or small disruptions to traffic or communication lines); c) significant (property damage of moderate to high value, considerable disruption or personal injury); d) severe (serious personal injury or death, damage to high-value property or total disruption of activities). Finally, to compare the risk by both methods, a RR per tree, section and species was obtained, adding together the values of the combined likelihood (A + B) and of the generated consequences. Table 3 indicates the four final risk categories obtained: low, moderate, high and extreme. For the analysis, a database was created in MS-Excel, which was analyzed with nonparametric statistics by means of the Kruskal-Wallis range test, using the SAS® program (Statistical Analysis Software Inc., 2015).
Table 3 Matrix used to generate the final risk rating (RR) based on the components probability of failure, probability of impacting a target and consequences (Dunster et al., 2013).
| Probability of failure + Probability of impact | Consequences | |||
| Negligible | Minor | Significant | Severe | |
| Very likely | Low | Moderate | High | Extreme |
| Likely | Low | Moderate | High | High |
| Somewhat likely | Low | Low | Moderate | Moderate |
| Unlikely | Low | Low | Low | Low |
Results and discussion
Out of a total of 760 trees assessed, the most frequent species were: Casuarina equisetifolia L. (23.6 %), Grevillea robusta A. Cunn. ex R. Br. (17.2 %), Hesperocyparis lusitanica Mill. (13.6 %), Eucalyptus camaldulensis Dhnh. (12.0 %) and Schinus molle L. (9.7 %); these species made up 76.2 % of the total. The remaining percentage was represented in order of decreasing importance by Fraxinus uhdei (Wenz.) Lingelsh, Acacia retinodes Schltdl., Cupressus sempervirens L., Tamarix gallica L. and Ligustrum lucidum Aiton. The most frequent diameter class was from 7.6 to 15.1 cm (31.7 %) (Figure 3A). The dominant category regarding height included trees from 5.1 to 10.0 m (44.9 %) (Figure 3B), while the most frequent slenderness index ranged from 26 to 75 (61.7 %) (Figure 3C). The mean of the forest mensuration variables was 24.03 cm in diameter, 11.14 m in height and 58.25 in SI.
Figure 3 Distribution of diameter (A), height (B) and slenderness index (C) classes of the trees evaluated in San Juan de Aragon Forest, Mexico City.
Based on these figures, most of the trees were small, possibly due to their recent planting or because site conditions have not been favorable for optimal development, and although there are large individuals, their frequency was low. Although the SI is used to determine plant quality in nurseries, its use has been extended to other phenological stages in order to determine trunk stability. Low slenderness values are associated with conical (tapered) trees (Villar-Salvador, 2003), which are more resistant to strong winds and mechanical damage (Arias, 2004). Tree instability increases with slenderness indices greater than 80, while those exceeding an index of 100 are extremely unstable (USDA, 2014); however, even values of this magnitude are considered normal in juvenile phases, but after 10 years one would expect a value of less than 80, otherwise there would be very thin trees that could break easily (Pérez-González, Domínguez-Domínguez, Martínez-Zurimendi, & Etchevers-Barra, 2012). In the present study, 76 % of the trees had an acceptable slenderness value.
Structural defects
Figure 4 shows the 14 types of structural defects identified in 292 trees; that is, 38.4 % of the individuals presented some type of defect, with the most frequent being: lean (18.8 %), cankers (15.4 %), epicormic shoots (14.4 %), dead branches (9.9 %), tumors (9.2 %) and cavities (6.1 %).
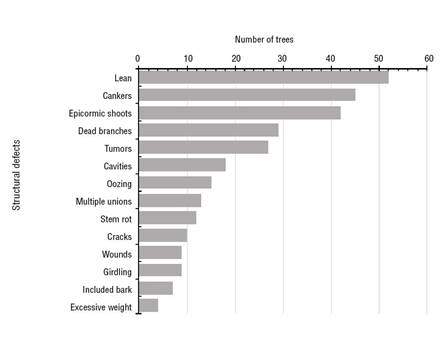
Figure 4 Frequency of the types of structural defects in 292 trees in San Juan de Aragon Forest, Mexico City.
Leaning is perhaps the most common example of an unbalanced tree, a product of its life history, growth patterns and genotype; a tree with a lean greater than 10° may be unstable, so it should be periodically monitored, but if its lean exceeds 40° and at the same time hangs over a target, then the target should be moved, or the tree in question should be felled (Pokorny, 1992). In the BSJA, some trees showed a critical lean angle; however, they were found in sites of occasional use. According to a study by Jim and Zhang (2013), leaning and crooked trees are one of the most frequent defects in Hong Kong.
Epicormic shoots turned out to be the third most frequent character. These shoots originate from latent buds, tend to grow on the trunk, root collar or in branches and often their development is stimulated by sudden exposure to light (Meier, Saunders, & Michler, 2012) or as a consequence of chronic stress; therefore, shoots are considered a tree survival strategy (Bellingham & Sparrow, 2003). In the short term, these shoots can replace dead branches or those that were pruned during management activities, which creates an excellent appearance; however, despite their rapid growth, their adventitious origin propitiates a weak union with the tree (bark-wood) (Pallardy, 2008), being likely that the excess weight in the future results in premature failure, causing severe material and economic damage.
Dead branches were also common, especially in the upper part of the crowns, and although their incidence was low, immediate removal is justified when they are found in areas of frequent use (Sreetheran, Adnan, & Azuar, 2011). Crown cleaning and reduction pruning, in exceptional cases, should be applied as soon as possible.
The presence of tumors in the lower part of the trunk and root collar were also frequent and although they are proven to limit tree growth and productivity (Escobar, Leslie, McGranaham, & Dandekar, 2002), they are rarely considered a physiological health and structural problem (Meilleur, 2006).
A unique process in trees is their ability to compartmentalize; this phenomenon includes the activation of four walls that limit wood decay and discoloration within the tree (Shigo, 1984). Occasionally, these walls cannot contain the decay (Martínez-Trinidad & Islas-Rodríguez, 2010), forming cavities and areas with incipient or advanced rotting. This situation increases with the presence of cankers, a very common defect in the study area, as they limit wound closure (compartmentalization capacity) and increase risk (Meilleur, 2006). Wood decay in a living tree in a park could cause branch or trunk breakage during adverse weather conditions, turning the tree into an element of risk for people (Kulhavy, Unger, Hung, Wu, & Sun, 2014).
Defects by section and species
Table 4 reports the proportion of trees with defects in each assessed BSJA section. Sections B and H in the northwest and south of the forest, respectively, had the highest percentage of trees with structural defects. It is important to note that all sections had leaning trees. A leaning tree with a major defect in the lower part of the trunk is more susceptible to fail, due to structural imbalance and accentuated weakness in the trunk or root. In some trees, the oblique growth may be natural, whereas in others the development was inadequate, due to the presence of shallow soils and a poor anchoring system (Pokorny, 1992).
Table 4 Trees with structural defects (%) in each of the sections of San Juan de Aragon Forest, Mexico City.
| Section | Lean | Fork | Multiple unions | Included bark | Excessive weight | Cracks | Stem rot | Cavities | Oozing | Dead branches | Cankers |
|---|---|---|---|---|---|---|---|---|---|---|---|
| B | 3.08 | - | 1.71 | 0.68 | 0.34 | 0.68 | 1.71 | - | - | 7.19 | 3.08 |
| C | 3.77 | - | 1.03 | - | 0.68 | - | 0.34 | - | 0.34 | 6.51 | 0.34 |
| E | 0.68 | - | 1.71 | - | - | - | - | - | 0.68 | 0.34 | 8.22 |
| F | 0.68 | - | - | - | - | 0.34 | 0.34 | 2.05 | - | 1.37 | 0.34 |
| G | 3.08 | - | - | 1.03 | - | - | - | - | - | 4.11 | 1.37 |
| H | 2.40 | 0.34 | - | - | - | 0.34 | 1.37 | 2.05 | 2.40 | 6.16 | 2.74 |
| J | 1.03 | - | - | - | 0.34 | 0.34 | - | 1.03 | - | 4.45 | 2.05 |
| K | 2.74 | - | - | - | - | 1.71 | - | 0.34 | 1.37 | 0.68 | - |
| L | 0.34 | - | - | 0.68 | - | 0.34 | 0.68 | 0.34 | 1.71 | 1.71 |
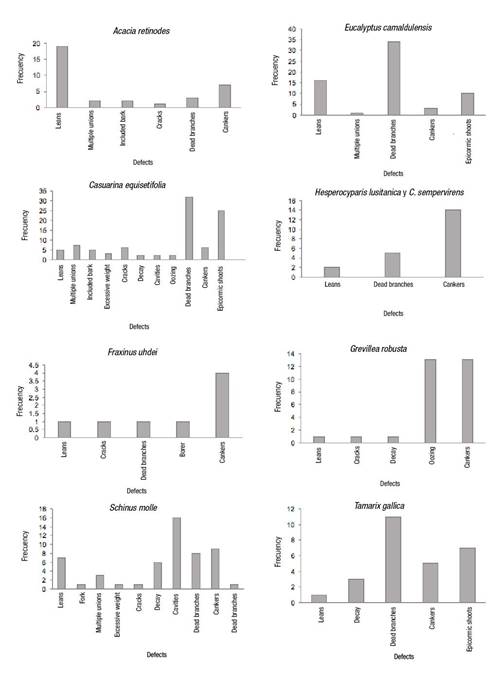
Each tree species showed its own defects, as illustrated graphically in Figure 5; for example, C. equisetifolia and S. molle had the highest number with 23.97 and 17.81 %, respectively, which could be an indicator that these genotypes are not suitable for BSJA conditions, while H. lusitanica, C. sempervirens and F. uhdei could be candidates for future plantations, although species diversification will have to be considered. The most common defects were dead branches in Casuarina, Eucalyptus and Tamarix, and leaning trees in Acacia.
Risk rating
Figure 6 shows that the most frequently assessed tree ratings were 7 and 8. For the Matheny and Clark method, trees rated ≤8 were included in low risk (83.9 %), 9 in moderate (14.7 %), and 10 in high (1.3 %). Based on the third component of the Dunster method (the consequences of a tree or part failure), 88.17 % of the trees presented low risk, 11.3 % moderate risk, and 0.68 % high risk. The extreme category was not represented.
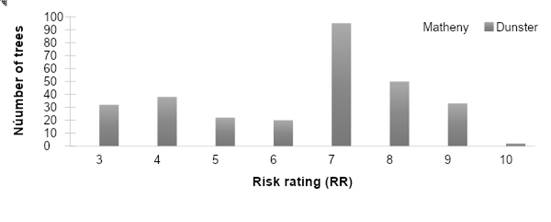
Figure 6 Frequency histograms of the RRs of the trees in San Juan de Aragon Forest, Mexico City, evaluated with the Matheny and Clark (1994, 2009) and Dunster et al. (2013) methods.
Risk rating by species and section
Based on the Kruskal-Wallis range test, the risk rating showed significant differences among species; however, for both methods, all were grouped at low risk (Table 5).
Table 5 Risk rating by tree species based on the Matheny and Clark (1994, 2009) and Dunster et al. (2013) methods.
| Species | Matheny and Clark method | Dunster method | |||
|---|---|---|---|---|---|
| Median | Range | Species | Median | Range | |
| Eucalyptus camaldulensis | 6 | 113.83 a | Eucalyptus camaldulensis | 5 | 101.35 a |
| Casuarina equisetifolia | 6 | 118.31 a | Tamarix gallica | 5 | 118.98 ab |
| Hesperocyparis lusitanica | 6 | 119.10 ab | Hesperocyparis lusitanica | 7 | 126.15 abc |
| Tamarix gallica | 6 | 122.05 ab | Casuarina equisetifolia | 7 | 130.04 bc |
| Grevillea robusta | 7 | 153.88 bc | Grevillea robusta | 7 | 164.50 bcd |
| Schinus molle | 7.5 | 175.64 c | Acacia retinodes | 7 | 168.60 cd |
| Acacia retinodes | 7.5 | 182.62 c | Schinus molle | 8 | 174.59 d |
Different letters indicate significant differences according to the Kruskal-Wallis range test (P < 0.0001).
Regarding the sections, and according to Table 6, only section K (southwest) had a moderate risk rating (9 rating); all the other sections had a low rating. It should be noted that this section and sections E and F have the highest influx of users, who engage in activities such as hiking along unauthorized trails, having picnics and just resting, so it is recommended to carry out constant monitoring to identify any change in the condition of the trees.
Table 6 Risk rating by section based on the Matheny and Clark (1994, 2009) and Dunster et al. (2013) methods.
| Matheny and Clark method | Dunster method | ||||
|---|---|---|---|---|---|
| Section | Median | Range | Section | Median | Range |
| C | 5 | 99.15 a | G | 6 | 113.17 a |
| H | 5 | 101.68 a | J | 6 | 114.48 a |
| G | 6 | 113.13 ab | C | 6.5 | 118.42 a |
| J | 6 | 114.34 ab | H | 7 | 122.20 a |
| B | 7 | 135.64 bc | B | 7 | 132.56 a |
| L | 7 | 176.23 cd | L | 7 | 142.50 ab |
| F | 8 | 206.67 d | E | 7 | 172.61 bc |
| K | 8.5 | 207.60 d | F | 8 | 203.90 c |
| E | 8.5 | 216.05 d | K | 9 | 217.08 c |
Different letters indicate significant differences according to the Kruskal-Wallis range test (P < 0.0001).
Based on the methods used, the tree species and sections evaluated had a low risk rating (≤8), with the exception of section K, where the risk was moderate; therefore, the likelihood of loss is low. In numerical terms, the values obtained by the Matheny and Clark method were higher due to the influence exerted by the diameter of the defective part.
It is important to note that the study was conducted at a specific time and that the structural conditions of the trees and the weather can change drastically in a different timeframe. While it is important to identify the potential risk posed by trees already established within the city, according to Hauer et al. (2015) and Vogt et al. (2015), proactive maintenance would provide a longer useful life of the tree resource. Properly planted and maintained trees will provide greater benefits and increase the value of the urban forest.
Conclusions
The procedures for tree risk identification and assessment applied to San Juan de Aragon Forest in Mexico City allowed rating the main structural defects in the park’s trees in a simple way. The most frequent defects were leaning trees, cankers, dead branches in the upper crown, tumors, cavities and epicormic shoots. Casuarina equisetifolia and Schinus molle were the species with the highest number of defects. The highest percentage of trees with defects was found in sections B and H. Most of the trees had a low risk rating for goods, services and human lives. The section with the highest risk rating was K. This information is relevant to decision-makers wishing to implement preventive measures that can mitigate potential tree damage to the infrastructure and injury to the population in urban areas.

