


 text in
  English (pdf)
 Article in xml format
 Article references
 Send this article by e-mail
 Cited by SciELO
  Similars in
SciELO
Similars in
SciELO 
 Permalink
Introduction
Forest inventories are one of the tools capable of evaluating the condition of forest ecosystems and of helping decision-making regarding actions or policies for the adaptation or mitigation of climate change effects.
Qualitative and quantitative data collection provides inputs for the estimation of aerial biomass and stored carbon. In this sense, biomass estimation parameters have traditionally been obtained by collecting data in situ by manually measuring distinctive characteristics of the physiognomy of trees, such as diameter at breast height, total height and crown diameter.
As technology and new knowledge have evolved in areas such as remote sensing and geographic information systems, we have tried to complement parameters through digital data capture techniques to facilitate the collection and management of information (Calders et al., 2014; Liang et al., 2014a; Yépez & Lozano, 2014).
The objective of this contribution was to evaluate the accuracy of portable LIDAR technology and photogrammetry (photo-reconstruction) in the generation of point clouds, to estimate aerial biomass in an urban forest. The study was carried out under the assumption that these techniques are useful to extract forest parameters efficiently and accurately, with values similar to those obtained with the traditional forest method.
Materials and methods
Study area and field data collection
The experiment was conducted in an urban forest at the Instituto Tecnológico y de Estudios Superiores de Monterrey, Nuevo León, Mexico. The forest consists mainly of ash (Fraxinus americana L.) trees and evergreen oak (Quercus fusiformis Small). The polygon comprises an area of 3 500 m2 (Figure 1), which was selected based on the concentration of Quercus trees with diameter at breast height greater than 7 cm and trying to avoid the “noise” generated by people or vehicles in the point clouds.
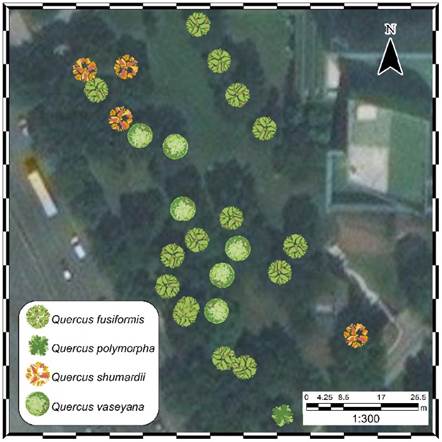
Figure 1 Study area (3 500 m2) in an urban forest at the Instituto Tecnológico y de Estudios Superiores de Monterrey (Nuevo León, Mexico) and Quercus species to evaluate remote sensors in the estimation of aerial biomass parameters.
Obtaining data using the traditional forest method
Total height (TH), crown diameter (CD) and diameter at breast height (DBH) of each tree were obtained using laser rangefinder (LaserAce 3D model), measuring tape and diametric tape, respectively. The north-south and east-west measurements of the CD were averaged and DBH was measured at a height of 1.3 m.
Obtaining data with portable LIDAR
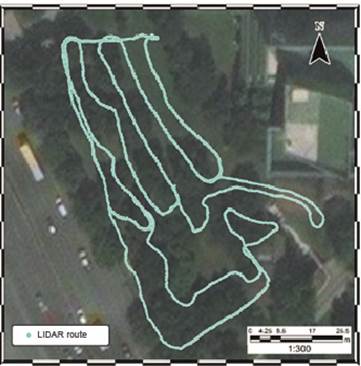
We used a portable LIDAR (GeoSlam model Zeb-1) that has a maximum range of 30 m and accuracy of ±0.1 % with a scanning rate of 43 200 points·s-1. LIDAR is a sensor that emits a laser beam towards a target and measures the return time to estimate the distance between the instrument and the object; if the position of the instrument is known with precision, it is possible to build a point cloud that represents the illuminated object in three dimensions (Dassot, Constant, & Fournier, 2011). Bosse, Zlot, and Flick (2012) present details of the design and operation of the sensor. The survey consisted of six transects with a total distance of 910 m (Figure 2). The existing infrastructure in the area was avoided in the trajectory.
Obtaining data using photogrammetric technique
Normal (RGB) and infrared (IR) color images at ground and aerial level with overlap of 70 % were captured. Two optical sensors were used for ground level: 1) an 18.1 megapixel digital camera with focal length adjustment (FOV) of 73.7, CMOS sensor and NIKKOR glass lens, and 2) a 12-megapixel action camera, FOV of 94.4, CMOS sensor with the adaptation of a 5 megapixel lens that allows the sensor of the action camera to detect the electromagnetic energy of the near infrared. The transmittance of the lens is in the ranges of 400 to 560 nm and 688 to 740 nm. In total, 577 RGB and 526 IR images were obtained. The routes for capturing images were made in two phases shown in Figures 3a and 3b for RGB, and Figures 3c and 3d for IR. For aerial images, the action camera was placed on a drone with a stabilization system to ensure vertical images. Two flights were scheduled; one with RGB lens and other with IR lens. Prior to the flight, the plan was designed (Figure 3e) regarding a period of 1 s between each image (overlap of 70 %) and flight height of 40 m. A total of 861 RGB aerial images were taken and 490 IR images.
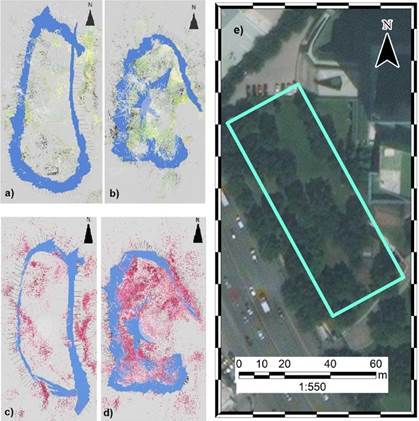
Figure 3 Routes in an urban forest at the Instituto Tecnológico y de Estudios Superiores de Monterrey (Nuevo León, Mexico), to obtain aerial biomass parameters using the photogrammetric technique: normal color photo-reconstruction (PR) at ground level (a and b), infrared color PR at ground level (c and d) and PR of normal and infrared color aerial image (e).
Generation and post-process of point clouds
The process was carried out using the following: 8 Gb RAM, Intel Core i7 processor, Windows 7, Nvidia GeForce 9600 video card, with the Agisoft PhotoScanTM photoreconstruction program. This application allows to generate three-dimensional objects, from images with different points of orientation (Li, Chen, Zhang, & Jia, 2016). The structure-from-motion (SFM) technique was used with high alignment precision and medium quality geometry detail. The groups of images were aligned by common points, determining the position of the cameras in each image, which generated a dense cloud of points for each sensor and data type. Georeferencing was carried out using a differential GPS (Ashtech, model ProMark500), obtaining four geodetic points. These were corrected with the local station Mty2 of the National Active Geodetic Network (RGNA, Red Geodésica Nacional Activa). From these data, the point cloud record of the portable LIDAR was recorded and used as a reference in the alignment of the photo-reconstructed clouds.
The isolated points of the main cloud were removed semi-automatically for scanning and photo-reconstruction (PR) techniques. The cloud was divided into two classes (trees and soil) detecting geometric features such as linear (1D), flat (2D) or three-dimensional (3D) through 10 scales, from 5 cm to 50 cm in diameter. In this way, the points were discriminated by comparing all the scales, generating a dichotomous classification (Brodu & Langue, 2012).
Forest parameters
Once the point clouds were segmented into the two classes of interest (trees and soil), the points corresponding to the category "trees" were isolated to proceed with the generation of forest parameters required for the comparison of the procedures (Trochta, Krůček, Vrška, & Král, 2017).
When extracting the points corresponding to the trees, an information vacuum was generated, so the Inversed Distance Weighted (IDW) interpolation algorithm was used, which uses the position of the existing points around the gaps to predict the position of new points. IDW assumes that positions of the existing points will have more influence on a new predicted point and that it will decrease as the points are farther away.
Establishing the central coordinates of trees
For the assignment of the central points of tree bases, their positions on the XY axes were first determined, using the median of the coordinates of all the points present in a cross section at 60 cm above the ground level. The Z axis was assigned in the coordinate determined by the median of the five points closest to the point cloud corresponding to the land.
Obtaining total height, crown diameter and diameter at breast height
Total height (TH) was determined automatically with each point cloud, from the vertical distance between the lowest point and the highest part of the tree. On the other hand, using a flat convex projection, the area that enveloped the tree crown from an orthogonal projection was estimated using the convex envelope algorithm (Trochta et al., 2017). Subsequently, the crown diameter (CD) was estimated using the convex area (A) in the following equation:
The automatic estimation of DBH was done through tree point subsamples located between the heights of 1.25 m and 1.35 m above the base. The random transformation of Hough (Chen & Chung, 2001) was used to search the center of each point that makes up the subsample, where the center of the most frequent circle is selected through interactions as the resulting center (Xu & Oja, 1993). In the FR point clouds from a UAV, due to the absence of information from the DBH (the tree canopy obstructed the vision of the trunk) an indirect estimation was made from the photogrammetric parameters of TH and CD. For this operation the equation of sessile oak (Quercus petraea L.), developed by Balenović, Seletković, Pernar, Ostrogović, and Jazbec (2012), was applied:
Aerial biomass
Quercus allometric equations studied in the literature, are shown in Table 1. The databases consulted corresponded to the measurement, reporting and verification system (MRV) of the Comisión Nacional Forestal (CONAFOR), as well as to the base data from the Mexican Carbon Program (Rojas-García, De Jong, Martínez-Zurimendí, & Paz-Pellat, 2015). The equations corresponding to the species of the region such as oak, oak-pine and pine-oak forests, and with a high value of R2 (>0.85) were considered for this study. Afterwards, the aerial biomass was estimated using the values obtained automatically by DBH generated by the use of LIDAR, PR at ground and aerial level (UAV). We detected the cases in which the difference between the traditional forest method (TFM) and the methods studied was greater than 25 %, and manual measurements were made to reduce errors caused by noise. The relationship between the measurements acquired through the different methods, with respect to the data collection by TFM in situ (P = 0.05), was obtained through regression models.
Table 1 Allometric equations to estimate the aerial biomass of Quercus in northern Mexico.
| Species | Equation | Author |
|---|---|---|
| Quercus polymorpha | 0.092(DBH2.448)] / [0.092(DAP2.448)] | Rojas-García et al. (2015) |
| Quercus spp. | [0.089(DBH2.5226)] / [0.089(DAP2.5226)] | Návar (2009) |
| Quercus spp. | [e-2.874(DBH2.631)] / [e-2.874 (DAP2.631)] | Návar-Cháidez (2010) |
| Quercus spp. | [e-2.754(DBH2.574)] / [e-2.754 (DAP2.574)] | Návar-Cháidez (2010) |
| Quercus spp. | [0.010702(DBH3.05082)] / [0.010702(DAP3.05082)] | Rodríguez, Jiménez, Aguirre, Treviño, y Razo (2009) |
| Quercus spp. | [0.038424(DBH2.82139)] / [0.038424(DAP2.82139)] | Rodríguez et al. (2009) |
| Quercus spp. | [0.45534(DBH2)] / [0.45534(DAP2)] | Aguirre y Jiménez (2011) |
| Quercus spp. | [0.0202(DBH2.6480)] / [0.0202(DAP2. 6480)] | Návar (2009) |
| Quercus spp. | [0.0768(DBH2.4416)] / [0.0768(DAP2.4416)] | Návar (2009) |
Results and discussion
A total of 26 Quercus trees were sampled. The dominant species was Q. fusiformis with 15 trees (57.7 %), followed by Q. vaseyana Buckl. (23.1 %), Q. shumardii Buckl. (15.4 %) and Q. polymorpha Schltdl. & Cham. (3.8 %).
Point clouds generated
DBH, TH and CD by the TFM measurements were made in 3 h. With portable LIDAR, the number of points generated amounted to 39.4 million (Figure 4); the time of data collection in the field was 40 minutes.
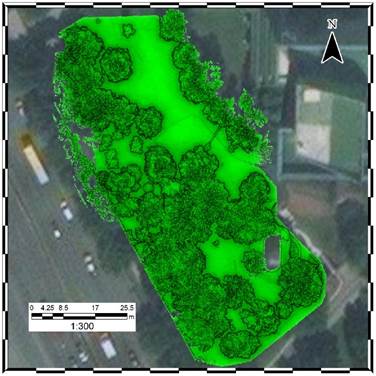
Figure 4 Point cloud from portable LIDAR, for the measurement of forest parameters in an urban forest.
The number of cloud points generated with photo-reconstruction (Figure 5) varied from 6 to 22 million depending on the size and number of images obtained by each type of sensor (RGB and IR) and by type of sampling (at ground and aerial level) (Table 2). The estimated time of collection averaged 30 minutes at ground level and 5 to 10 minutes at aerial level.
The time spent in data collection decreased by 90 % with the portable LIDAR, 83 % with the optical sensors at ground level and 97 % when placing the sensors on a UAV.
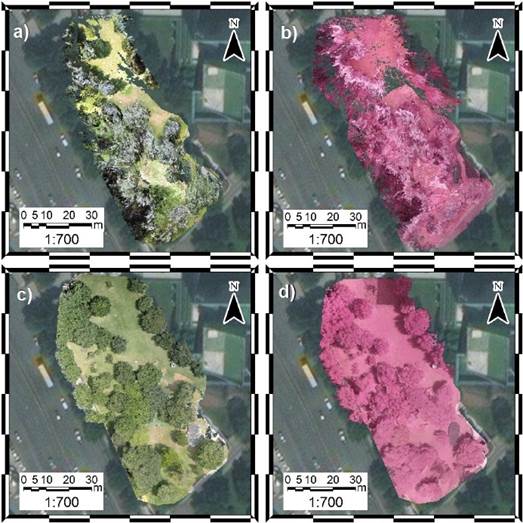
Figure 5 Point clouds for the measurement of forest parameters in an urban forest: a) Normal color photo-reconstruction (PR) at ground level, b) Infrared color PR at ground level, c) PR of normal color aerial image and d) PR of infrared color aerial image.
The level of cloud geolocation, in which the portable LIDAR was taken as reference, averaged 0.05 m of spatial accuracy in XYZ. Table 2 shows the mean square errors reported by each type of point cloud.
Table 2 Number of points generated with the methods of photo-reconstruction (PR) and mean squared error (MSE).
| Point cloud | Number of points | MSE |
|---|---|---|
| Normal color PR at ground level | 22 405 651 | 0.13 |
| Infrared color PR at ground level | 9 887 539 | 0.20 |
| PR of normal color aerial image | 12 138 416 | 0.08 |
| PR of infrared color aerial image | 6 332 972 | 0.10 |
The precision balance for the generation of the classification filter between soil and trees was 98.34 %. An example is shown in Figure 6. When making the test classification, 1.12 % of the 10 000 points belonging to the soil class actually corresponded to the class of trees; while 1.66 % of the 10 000 test points of the tree class were misclassified. Results of this filter were used for all the point clouds since they had geometric characteristics similar to the cloud with which it was generated.
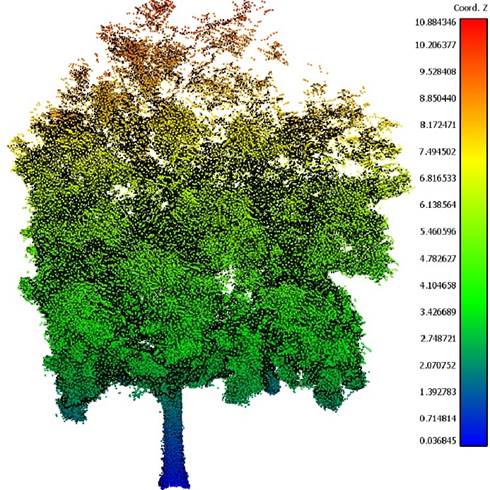
Figure 6 Point cloud (isolated) of a tree. The points were obtained from the classification of the entire cloud. Colors indicate elevation above the ground.
As for the PR at ground level, values of R2 = 0.824 were obtained in RGB and R2 = 0.745 in IR. The reduction in the accuracy of these methods lies in four main factors. The first is the difficulty of the algorithm to identify the variations of intensity that define tree crowns on the images. This occurs because trees, unlike solid objects, have a large number of holes between their leaves and branches, which are covered by bottom objects such as fences, buildings and, in most cases, the sky. To reduce the noise of this source, semi-automatic masks were created for each image; that is, the areas not corresponding to the area of interest for PR were delimited in order to minimize the noise caused by these pixels. Secondly, the shadows caused by the density of the canopy make it difficult to identify and classify points (to the category of interest) automatically. Another factor is the presence of trees smaller than 7 cm of DBH and shrubs, which produced a lot of noise points. Finally, the variation of the distance between the camera and the target generates different densities of points along the cloud, which improves or worsens the results in variable areas depending on the positions to obtain the images.
The PR on a drone had the lowest R2 values of the study (R2 = 0.653 for RGB and R2 = 0.667 for IR). The main limitation of this methodology was the lack of information for an adequate reconstruction of DBH to derive the missing parameters due to occlusion.
The development of algorithms and computer programs for the automatic detection of forest parameters from 3D point clouds is recent (Liang et al., 2014a; Liang et al., 2014b; Moskal & Zheng, 2012; Seidel, Albert, Ammer, Fehrmann, & Kleinn, 2013) and is in constant improvement. Its application has proven to be efficient with the corresponding validation of the traditional methodology (Yépez & Lozano, 2014).
Forest parameters of remote sensors
DBH, TH and CD values were obtained for each tree, and semi-automatically, with the portable LIDAR and PR methods, both at ground level and on a UAV. Results are shown in Table 3. The DBH generated with remote sensors that showed greater difference with those obtained through TFM were PR of normal color aerial image (8.74 cm) and PR of infrared color image (8.60 cm); the minor differences were recorded with the infrared color PR at ground level (0.03 cm) and portable LIDAR (0.24 cm). With respect to TH, the greatest differences in measurement were for normal color PR at ground level (0.60 m) and portable LIDAR (0.36 m), and the smallest difference was obtained with the infrared color PR at ground level (0.08 m). For CD, the greatest differences were found for normal color and infrared color PR at ground level with 0.99 and 0.65 m, respectively, while the PR measurement of infrared color aerial image was the same as that obtained with the TFM.
Table 3 Forest parameters of 26 Quercus trees, obtained with the traditional forest method and remote sensing.
| Method | DBH (cm) | Total height (m) | Crown diameter (m) |
|---|---|---|---|
| Traditional forest method | 36.76 | 8.28 | 9.51 |
| Portable LIDAR | 37.00 | 7.92 | 9.18 |
| Normal color PR at ground level | 35.73 | 8.88 | 8.52 |
| Infrared color PR at ground level | 36.73 | 8.37 | 8.86 |
| PR of normal color aerial image | 28.02 | 8.46 | 9.45 |
| PR of infrared color aerial image | 28.16 | 8.42 | 9.51 |
DBH: diameter at breast height, PR: photo-reconstruction.
In Mexico, the presence of equations that allow the estimation of the DBH from TH and CD, for Quercus, it is non-existent; therefore, the use of equations obtained from measurements in other parts of the world was used (Balenović et al., 2012). This is reflected in a low precision of the estimation, which generated an underestimation of the aerial biomass estimated by means of data obtained from the UAV.
Estimation of aerial biomass
Aerial biomass was estimated with TFM data through the eight allometric equations existing in the region for Quercus. A comparison was made by student t-tests (P = 0.01), to determine if there were statistically significant differences between the results of each equation. Based on this analysis, the equation of greater similarity with the rest was found. According to Table 4, the formulas of Aguirre and Jiménez (2011) and Rojas-García (2015) had the highest number of coincidences.
Cuadro 4 Characteristics of allometric equations used in the estimation of aerial biomass of the genus Quercus.
| Species | State | Ecosystem | R2 | Sample size | Author |
|---|---|---|---|---|---|
| Quercus polymorpha | Nuevo León | Pine-oak forest | 0.90 | 16 | Rojas-García et al. (2015) |
| Quercus spp. | Nuevo León | Oak-pine forest | 0.95 | 32 | Aguirre and Jiménez (2011) |
Aerial biomass values obtained with each of the remote sensing methods were compared against TFM values through simple, quadratic and cubic linear regressions; the simple linear regression model was selected since it offered better adjustment and was the only method that had significance (P < 0.001). Results are shown in Table 5. Portable LIDAR had the best relation with 94.53 % followed by the normal color PR at ground level with 82.48 %. On the other hand, according to Table 6, there is an important variation in the calculation of aerial biomass, since the values at ground level determinations were doubled compared to those obtained in the aerial PR (379 t in the PR of normal color aerial image up to 650 t with portable LIDAR); at ground level, the biomass also varied from 13 to 30 t with respect to the TFM.
Table 5 Simple linear regression of the different methods compared to the traditional forest method, to obtain the aerial biomass of Quercus trees.
| Method | Equation | R2 (adjusted %) | Standard deviation of waste |
|---|---|---|---|
| Portable LIDAR | y = -20.90 + 1.041 x | 94.53 | 62.55 |
| Normal color PR at ground level | y = 45.43 + 0.8378 x | 82.48 | 95.04 |
| Infrared PR at ground level | y = -95.49 + 1.112 x | 74.55 | 140.69 |
| PR of normal color aerial image | y = -47.74 + 0.6594 x | 65.30 | 117.84 |
| PR of infrared color aerial image | y = -29.85 + 0.6496 x | 66.76 | 112.46 |
PR: photo-reconstruction. The P values of the model and the linear term, for each method, were less than 0.001.
Table 6 Aerial biomass (averages of 26 Quercus trees) estimated with the six methods evaluated.
| Method | Biomass (t) |
|---|---|
| Traditional forest method | 637.92 |
| Portable LIDAR | 650.03 |
| Normal color PR at ground level | 621.64 |
| Infrared color PR at ground level | 616.37 |
| PR of normal color aerial image | 379.35 |
| PR of infrared color aerial image | 384.56 |
Limitations of the data collection route design
One of the key aspects for obtaining quality results in the estimation of aerial biomass is a good planning of the route to be traveled, for which, depending on the sensor to be used, specific factors must be considered: 1) the distance between the sensor and the sample, 2) the overlap of images to have an effective PR and 3) the spatial location of the trees. The results indicated that, due to the design of the route followed with portable LIDAR and the PR at ground level (RGB and IR), data could not be obtained (points in the case of the LIDAR or images in the case of PR) of all the faces of the trunks of the trees studied, since the conditions of the land and the objects obstructed the visualization. In addition, to ensure the desired overlap between images, there were differences in the distance between one shot and another, in the height and angle that were caused by the irregularity of the land.
The use of optical sensors at ground level generated greater obstruction in the upper parts of tree crowns, especially in areas where the information needed to generate the 3D structure could not be obtained, due to the position of the camera and the angle when taking pictures. A similar effect occurred in the central zone of the study area, where the lateral faces of the tree crowns were not distinguished because of a higher density of contiguous trees. Another factor that caused errors in the reconstructions of the trunks were tree canopy shadows and the presence of trees with DBH < 7 cm and shrubs.
A positive aspect of aerial images is the cost reduction and its simplicity of use; however, the measurement of tree trunks is difficult, so the estimate is made from TH and CD.
Limitations of optical sensors
The resolution of each sensor affected the quality and density of points. Such effect was observed in the images captured with the infrared lens. Due to the characteristics of the lens, at ground level, the maximum resolution with IR represented a reduction of 60 % of the total number of points in comparison with the RGB data, while in the 3D reconstruction generated on a UAV, the resolution with IR was reduced 50 % (Table 2). The resolution of the cameras for obtaining the color and infrared images impacted on the amount of data generated in the point clouds when carrying out the photogrammetric process; denser clouds were obtained with the color images compared to those obtained with the infrared camera.
Extensive use of the terrestrial LIDAR
One of the advantages of using the portable LIDAR was to obtain the three-dimensional structure of the trees. Regarding the use of this method in more extensive or complex areas, the most important factor in this study was the design of the data collection route to obtain a point cloud of all facets of the trees. Another important element is time of data collection; the presence of a very dense canopy with a large number of leaves may limit data record beyond the trunk and the main branches of the trees, although this will depend on the objectives of the study.
All systems have their limitations, the portable LIDAR only measures the distance from the sensor to the object; it does not measure the intensity of the signal that returns to the sensor or the number of returns of the signal, conditions that would facilitate the classification of the point cloud. The technical aspects of LIDAR (distance to objects and resolution of the point cloud) are beyond the control of the analyst because they are fixed characteristics of the system used. Terrestrial sensors (both normal and infrared color) do not allow obtaining information from the top of tree crowns, while sensors on a drone cannot obtain data on the dimensions of the main trunk. Some of these limitations are relatively easy to correct; we can design a mission that obtains land and air data simultaneously and generate a more complete point cloud.
Conclusions
Height, crown diameter and diameter at breast height (DBH) of each tree were obtained semi-automatically with the portable LIDAR and photo-reconstruction (PR) methods, both at ground level and from an unmanned aerial vehicle (UAV). Portable LIDAR was the most accurate alternative (R2 = 0.945) to estimate the aerial biomass, taking as reference the estimation through the traditional forest method (TFM). In contrast, PR of normal color aerial image showed the poorest results (R2 = 0.653), due to the impossibility of measuring the DBH. The time spent in data collection with sensors decreased more than 80 % in relation to the TFM. Portable LIDAR technology and optical sensors are low cost alternatives for obtaining point clouds and have the potential to generate forest application data.

