


 texto en
  Inglés (pdf)
 Artículo en XML
 Referencias del artículo
 Enviar artículo por email
 Citado por SciELO
  Similares en
SciELO
Similares en
SciELO 
 Permalink
Introduction
The alteration of the earth’s surface, due to human actions, has generated changes in land uses on Earth. For this reason, the characterization of land cover and land use is key to understanding anthropic-environmental interactions at different spatio-temporal scales (Müller & Munroe, 2014). Spatial patterns and their changes have significant implications when analyzing, for example, water balance, climate change, deforestation, sedimentation, loss of biodiversity, and biogeochemical processes of the Earth (DeFries & Eshleman, 2004).
In recent decades, accelerated world population increase has been observed, accompanied by the intensification of agricultural activities and expansion of the agricultural frontier (Eitzinger, Orlandini, Stefanski, & Naylor, 2010). These structural transformations have caused the alteration of hydrological processes (Breuer et al., 2009; Fohrer, Haverkamp, Eckhardt, & Frede, 2001; Li, Liu, Zhang, & Zheng, 2009), imbalances in carbon and nitrogen cycles (Murty, Kirschbaum, Mcmurtrie, & Mcgilvray, 2002; Post & Kwon, 2000) and losses of species and ecosystems at high rates, despite efforts to conserve biological diversity (Pettorelli et al., 2016).
In Argentina, particularly in the Pampean Region, there has been an agriculturalization process characterized by the increase of agricultural areas in traditional livestock use areas. This process began in the 1960s and has accelerated dramatically during the last 20 to 25 years, sustained mainly by structural economic changes and the incorporation of the technological package associated with the cultivation of genetically modified soya (soybean in Argentina) (Manuel-Navarrete et al., 2009). These changes strongly impact the structure and functioning of ecosystems, are perceived at different scales (Baldi, Guerschman, & Paruelo, 2006; Guerschman, Paruelo, & Burke, 2003; Lara & Gandini, 2014) and generate alterations in productivity patterns, stability and sustainability (Viglizzo, Roberto, Lértora, Gay, & Bernardos, 1997).
The availability and use of satellite images have allowed the analysis of large areas, acquiring information at very different temporal and spatial scales (Horning, Robinson, Sterling, Turner, & Spector, 2010). The use of these images is associated with the description of land cover /land uses, by characterizing the heterogeneity of the landscape and its spatial pattern (Cabello & Paruelo, 2008; Paruelo, 2008). Such application is based on the response forms of the Earth's surface elements at different wavelengths of the electromagnetic spectrum (Chuvieco, 1990), although often one of the main limitations is the scarce field information or its inadequate capture. In this context, several spectral indices derived from remote sensors have been proposed as estimators of vegetation presence and condition, based on the observation of spectral signatures of typical leaf reflectance. In these, the energy reflected in the visible range of the spectrum is very low, due to the high absorption of photosynthetically active pigments, with maximum absorption at blue (470 nm) and red (670 nm) wavelengths; almost all of the near infrared radiation (NIR) is scattered (reflected and transmitted) with very little absorption, due to the mesophyll structure of leaves (Solano, Didan, Jacobson, & Huete, 2010). As a result, the contrast between red and NIR responses is a sensitive measure of the vegetation amount, with maximum differences over dense and minimal vegetation where there is little or no cover (Solano et al., 2010). One of the most widely used spectral indices is the Normalized Difference Vegetation Index (NDVI), which is a linear estimator of the fraction of absorbed photosynthetically active radiation intercepted by vegetation (fAPAR) (Wang et al., 2004). From the data provided by satellite sensors of high temporal resolution (short revisit time, i.e. MODIS), hypertemporal series of NDVI can be constructed, from which it is possible to extract valuable information about the vegetation phenology (Reed, Schwartz, & Xiangming, 2009). In this way, it is possible to use differences in seasonal patterns to characterize various types of vegetation (summer crops, winter crops, perennial vegetation, etc.). On the other hand, the available cover mapping and land use on a large scale (Blanco et al., 2013; Eva et al., 2004) show inconsistencies due to their continental approximation and are insufficient to be applied on a more detailed scale. In this sense, the objective of this study was to develop a methodology to characterize land use in the upper creek basin of Del Azul in Buenos Aires, Argentina, by means of medium spatial resolution images from Landsat and MODIS satellites.
Materials and methods
Study area
The upper creek basin of Del Azul (Figure 1) is located in the center of the province of Buenos Aires, Argentina, between 59° 48’ - 60° ° 0’ W and 37° 01’ 48’’ - 37° 09’ 36’’ S, draining an area of 1 024 km2. This basin originates towards the South in the town of Chillar (60 km south of the city of Azul); its main tributaries are Videla stream with an area of 120 km2 and Santa Catalina stream with 140 km2.
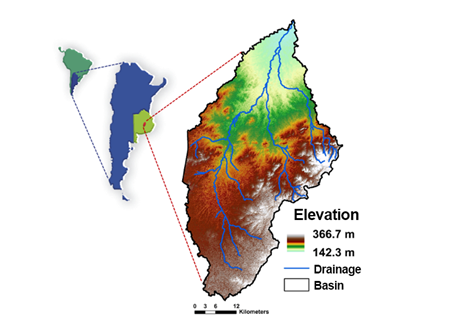
Figure 1 Upper creek basin of Del Azul located in the center of the province of Buenos Aires, Argentina.
The altitude in the basin varies from 142 to 367 m. The highest part, located towards the southeast, is on the Tandilia’s System, where slopes are greater than 6 %. Towards the northwest, the basin is transformed into a transitional plain, in the medium-low sector, with slopes of less than 1 %. The basin limits to the North with the city of Azul, to the West with the city of Olavarría, to the East with the city of Tandil and to the South with the town of Chillar. Mean annual rainfall is 913 mm. The highest rainfall occurs in the spring-summer period with a monthly average of around 100 mm, and the lowest occurs in autumn-winter with a monthly average of 50 mm. December to March are the months with the highest temperatures with an average of 20 °C, while from June to August are the months with the coldest temperatures with an average of 8 °C.
Satellite data
Two sources of medium spatial resolution satellite images were used, contributed by the National Aeronautics and Space Administration (NASA). First, we used a time-series of 23 NDVI-MODIS images from the product MOD13Q1, scene h13v12 (https://lpdaac.usgs.gov/dataset_discovery/modis/modis_products_table/mod13q1) that included one year of data, from May 2015 to May 2016. Although it does not adjust to the calendar year, this time window allows obtaining information on the growing seasons of land cover in the southern hemisphere; for example, the beginning of the growth of winter season crops such as wheat and the end of the harvest of summer crops such as soybeans and corn can be appreciated. This data set consists of 16-day compositions with the maximum NDVI values estimated at a spatial resolution of 250 m. Additionally, two Landsat 8 images (one for winter and one for summer) were used from Path/Row 225/086 (https://landsat.usgs.gov/landsat-8). Only the reflective bands (blue, green, red, near infrared and two medium infrared bands) having a spatial resolution of 30 m were used, while the thermal bands were rejected. This selection of spectral bands is due to the fact that covers to be identified show a greater dynamic range in the reflective bands and not in the thermal bands (Lara & Gandini, 2014).
Classifying and obtaining land cover
From the time series of NDVI-MODIS images, an unsupervised classification was made using the ISODATA (Iterative Self-Organizing Data Analysis) algorithm, which makes the partition of an n-dimensional image into a number of conglomerates according to the established parameters. In general, the process begins with a number of random centroids and, subsequently, each of the pixels is assigned to that conglomerate whose centroid is closest, in terms of the Euclidean distances. This is an iterative process in which the means (centroids) are recalculated and the pixels are reclassified with respect to the new means. The process continues until the number of pixels in each class changes less than the proposed change threshold or until the configured maximum number of iterations is reached (Tou & Gonzalez, 1974).
In this procedure we considered 50 iterations, a tolerance threshold of 5 % and maximum standard deviation of 1. In this way, 15 classes were generated, from which the mean value of NDVI was obtained for each of the 23 dates contemplated in the temporary series. The average values correspond to the phenological signatures, which were associated, based on the annual behavior, to each one of defined land cover and land uses: soybean, corn, double wheat-soybean cultivation systems, grassland (natural and cultivated) and mixed areas (Figure 2). For example, crops were associated with classes that had one or two periods of strong growth and a period with low NDVI values. To discriminate between crops, the unimodal curves with maximum values of NDVI in February were classified as soybeans, and those that showed a similar pattern, but with the maximum values of NDVI in January and February were classified as corn. Those classes that showed a maximum during September-October (characteristic of winter crops) and, in addition, a maximum in February, were categorized as wheat-soybeans. On the other hand, classes that did not have a unimodal or bimodal average pattern were classified as grassland and mixed areas. Grassland, which include cultivated perennial grassland and natural grassland, were characterized by maintaining an average value of NDVI greater than 0.4 throughout growing season; while mixed areas correspond to an average seasonal value of less than 0.4. The latter correspond to urban areas, bodies of water and rocky outcrop areas with active vegetation.
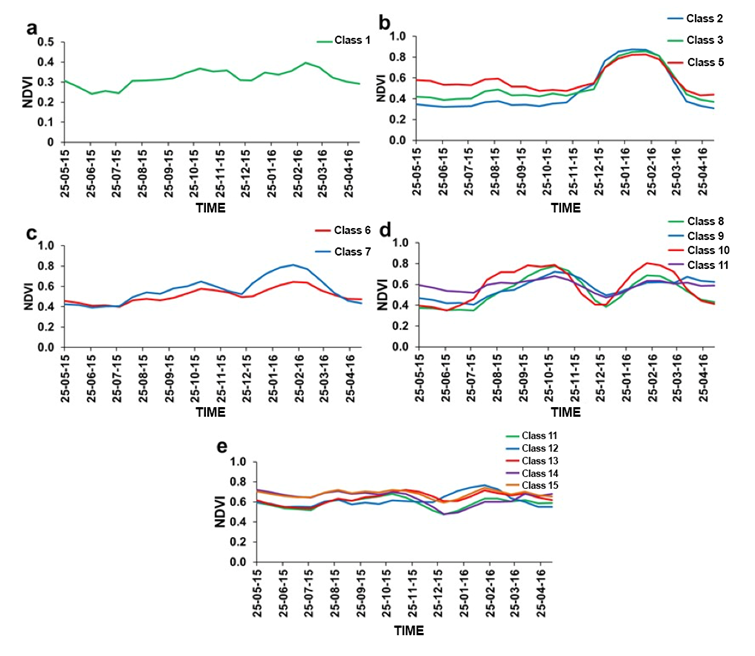
Figure 2 Seasonal curves of the Normalized Difference Vegetation Index (NDVI) from May 2015 to May 2016 for each of the 15 classes resulting from the unsupervised classification, scene h13v12 from the MODIS satellite. a) mixed area, b) soybean, c) corn, d) wheat-soybean and e) grassland.
Probably the mixed areas that did not differentiate from the MODIS images are associated with mixed pixels at that scale, which would make it difficult to find pure pixels to differentiate between covers (Lara & Gandini, 2016). For this reason, in order to discriminate the areas, two Landsat 8 images (winter and summer season) were used in a combination 7, 6, 4, which allows to penetrate atmospheric particles, smoke and haze (Figure 3). Subsequently, the two data sources were merged, resampling the classification made with MODIS images previously, at a spatial resolution of 30 m to obtain the final map of land cover and land uses of the upper creek basin of Del Azul.
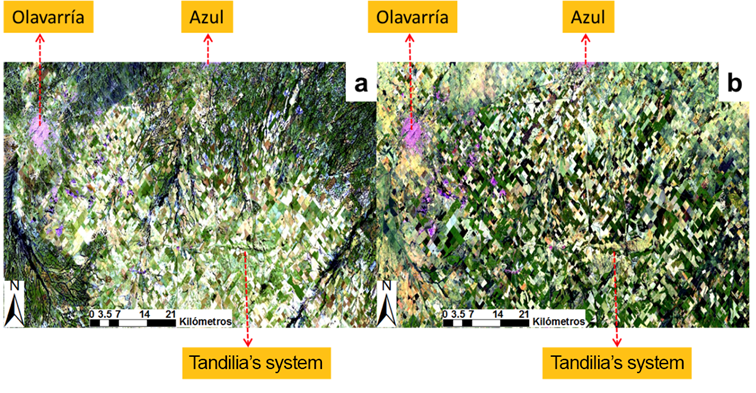
Figure 3 Landsat 8 images used. (a) Winter season, August 15, 2015. (b) Summer season, January 22, 2016. Path/Row 225/086. Composition of RGB bands: 7, 6, 4. The vegetation appears in dark green; urban areas are gray, greenish blue or purple; water is black or dark blue; and rocky outcroppings appear in red or yellow.
Validation of the cover map
The final cover map was validated regarding independent verification points to the classification process, taken during the 2015-2016 agricultural campaign. We used the Kappa statistic (Congalton, 1991) which, based on a confusion matrix, takes into account commission errors (or inclusion) and errors of omission (or exclusion); the classification is more accurate the closer it is to a value of 1. The equation for the Kappa statistic is as follows:
where,
N = |
total number of reference pixels |
xii = |
number of observations in row i and column i |
xi+ = |
marginal total of row i |
x+i = |
marginal total of column i |
r = |
number of rows in the matrix |
Nominally, the value of the index varies between -1 and 1, but the following scale can be considered to assess a classification: 0.05 to 0.20 = very low accuracy; 0.20 to 0.40 = low accuracy; 0.40 to 0.55 = reasonable accuracy; 0.55 to 0.70 = good accuracy; 0.70 to 0.85 = very good accuracy; 0.85 to 0.99 = excellent accuracy; and 0.99 to 1 = perfect accuracy.
Results and discussion
Figure 4 shows the final map of land cover and land uses of the upper creek basin of Del Azul, Argentina. The map was obtained from the combination of medium spatial resolution images, to discriminate crop types and grassland areas based on their characteristic phenological patterns. Table 1 indicates the area covered by each of the land uses; the double wheat-soybean crop system is the most widespread, representing 39.4 % (40 470.4 ha) of the study area. The sum of the areas covered by all agricultural uses reaches 81.5 %, which reflects the magnitude of the agriculturalization process in the region, taking into account that the natural vegetation was natural grassland (Matteucci, 2012). Although there are no official data, agricultural statistics of the Ministerio de Agroindustria de Argentina (Sistema Integrado de Información Agropecuaria [SIIA], 2016) reflect to a certain extent, the predominance of the same crops in the 2015-2016 campaign for the department of Azul, such as soybean (124 700 ha), wheat (132 110 ha) and corn (43 300 ha); it must be taken into account that in these data there are areas of agricultural use that are external to the study area.
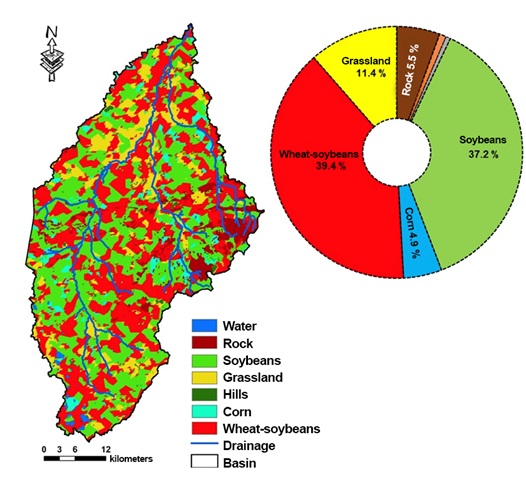
Figure 4 Final map of land uses in the upper creek basin of Del Azul (Buenos Aires, Argentina) for the period 2015-2016, using MODIS and Landsat 8 images
Table 1 Area covered by land uses in the upper creek basin of Del Azul in Argentina
| Land use | Study area | ||
|---|---|---|---|
| (ha) | (%) | ||
| Rock | 5 694.32 | 5.55 | |
| Forest | 903.15 | 0.88 | |
| Water | 593.19 | 0.58 | |
| Soybeans | 38 171.65 | 37.20 | |
| Corn | 5 043.80 | 4.92 | |
| Wheat-soybeans | 40 470.43 | 39.44 | |
| Grassland | 11 725.06 | 11.43 | |
| Total | 102 601.6 | 100 | |
In general, the cultivated areas are in the highest part of the basin, since there predominate soils of greater suitability and with few restrictions for agricultural activity, although in recent years, the advance of crops has also occurred on areas of traditional livestock use (Lara & Gandini, 2014). Grassland (which include natural and cultivated grassland) are associated, mainly, with the rocky outcroppings of the Tandilia’s system and in low areas of the basin. Probably, the areas close to the rocky outcrops represent areas of natural grassland where it is not possible to till the soil, while those located in low areas of the basin represent, mostly, cultivated grassland that are usually used in areas with drainage and salinization limitations. The current methodology did not allow to obtain a clear separation in the phenological signatures of these grasslands, due to the overlap of the start and end dates of growing seasons was frequent.
The map of land uses showed good success levels, with a total accuracy of 88.9 % and a Kappa coefficient of 0.86. According to Table 2, the lowest precision of the producer corresponded to the uses of corn and soybeans with values of 69.9 and 76.0 %, respectively. Precisely, the greatest confusion in the classification occurs between these two uses, which is to be expected since their phenological signatures are similar (Figure 2). In spite of this, the accuracy of the final map, obtained from a methodology based on phenological signatures derived from NDVI and without field information, satisfactorily represented the spatio-temporal patterns of the main uses of the basin in a given period. Undoubtedly, the combination of data obtained at a higher spatial resolution contributed to achieving greater precision.
Table 2 Confusion matrix for the map of land uses of the upper creek basin of Del Azul, Argentina, in the period 2015-2016. The diagonal contains the correctly classified pixels (5 240) and the errors are located outside the diagonal; along the horizontal are commission (inclusion) errors and along the vertical are errors of omission (exclusion).
| Classified data | Field data | ||||||||
|---|---|---|---|---|---|---|---|---|---|
| Water | Rock | Soybeans | Grassland | Wheat-soybeans | Corn | Forest | Total | User accuracy (%) | |
| Water | 532 | 0 | 0 | 0 | 0 | 0 | 0 | 532 | 100 |
| Rock | 0 | 486 | 0 | 0 | 0 | 0 | 0 | 486 | 100 |
| Soybeans | 0 | 0 | 1 258 | 0 | 48 | 177 | 0 | 1 483 | 84.83 |
| Grassland | 0 | 0 | 0 | 735 | 0 | 0 | 14 | 749 | 98.13 |
| Wheat-soybeans | 0 | 0 | 65 | 0 | 1 689 | 0 | 0 | 1 754 | 96.29 |
| Corn | 0 | 0 | 331 | 0 | 0 | 412 | 0 | 743 | 55.45 |
| Forest | 2 | 0 | 0 | 14 | 0 | 0 | 128 | 144 | 88.89 |
| Total | 534 | 486 | 1 654 | 749 | 1 737 | 589 | 142 | 5 891 | |
| Producer accuracy (%) | 99.62 | 100 | 76.05 | 98.13 | 97.23 | 69.95 | 90.14 | ||
| Total accuracy: (5 240 / 5 891) * 100 = 88.95 % | |||||||||
| Kappa statistic = 0.86 | |||||||||
The methodology developed has the advantage of being relatively fast and replicable with few inputs, to be used in different regions in order to map the most representative uses; however, it has the disadvantage that the annual behavior of the uses to be discriminated must be known a priori, which could be avoided by taking field data in pure pixels to obtain the phenological signature.
The characterization of land cover and land uses represents one of the essential inputs for the monitoring and management of natural resources at different scales, such as semi-distributed hydrological modeling (Arnold et al., 2012); however, in Argentina it is usually one of the missing information in departmental or regional management bodies. Therefore, when strategies of sustainable management of natural resources are required at a local scale, the existing large-scale procedures (Blanco et al., 2013; Eva et al., 2004) are deficient, and that is when the methodology developed in this study can provide useful tools. On the other hand, in regions of great dynamism of land uses, such as the one analyzed here, the methodology would allow to evaluate and monitor cover changes and, in particular, of the agricultural frontier, practically in real time.
Conclusions
The methodology developed in this study allowed the characterization of the land cover and land uses of the upper creek basin of Del Azul, Argentina, using phenological signatures derived from NDVI-MODIS time series. The mixed areas that could not be differentiated were categorized from Landsat 8 images, to improve the accuracy of the final map. The classification method used is a valid alternative when precise field data are not available, but requires knowledge about the seasonal behavior of the covers to be mapped. In this way, the proposal presented can be applicable and reproducible in different regions and scales, becoming a valuable tool for monitoring changes in land use at the local and regional scales.

