


 text in
  English (pdf)
 Article in xml format
 Article references
 Send this article by e-mail
 Cited by SciELO
  Similars in
SciELO
Similars in
SciELO 
 Permalink
Introduction
Land use studies and change of vegetation cover, as well as its dynamics over time, are essential for the sustainable management of natural resources (Memarian et al., 2012). Vegetation cover is essential in the global dynamics of the planet: plants absorb and recycle nutrients such as carbon dioxide, nitrogen, sulfur and phosphorus that are in the atmosphere, retain water and transpire. Forests play an important role in the conservation of the environment, since they regulate water currents, have a moderating effect on the global and local climate, and favor the conservation of soils preventing erosion; in addition, they are home to numerous species of plants and animals (Secretaría de Medio Ambiente y Recursos Naturales [SEMARNAT], 2009) . However, human activities have altered the original uses of the land, modifying the natural landscape and, consequently, the functioning of the ecosystems (Zepeda, Nemiga, Helgueras, & Madrigal, 2012). The land uses associated with anthropic activities, such as agriculture and grazing, have a deep influence on the change of the ecological, hydrological and atmospheric regulation processes of the planet. Therefore, the study of spatial and temporal dynamics of land uses is important (Martínez-Santiago, Alvarado-Segura, Zamudio-Sánchez, & Cristobal-Acevedo, 2017), but even more, to know their trends and projections to suggest interventions that reduce or slow down degradation.
A useful tool for modeling projection and trends of land use change are the Márkov chains (Eastman, 2012; Levin, Peres, & Wilmer, 2009; Memarian et al., 2012). In these, the transition to a next state depends on the current state of the system, regardless of the route to achieve it. The model considers the random variable of states and the parameter t (time) as discrete variables; in this way, it is possible to determine the probability with which the process can enter a certain state (Bedoya & Barrera, 2006). The method is convenient for modeling the change in land use when changes and processes in the landscape are difficult to describe.
Márkov chains simulate the prediction of the state of a system for a given time, from two preceding states (Eastman, 2012). This means that the modeling does not take into account the explanatory and descriptive variables, but is based exclusively on the analysis of the system internal dynamics. One limitation of the algorithm is the need to have the same categories in the time series, so that the disappearance or appearance of some class prevents applying the method (Paegelow, Teresa, & Minor, 2003). Markov models have been widely used in studies on land cover change at various spatial scales (Sanchayeeta & Southworth, 2012); according to Memarian et al. (2012), models are easy to create with minimum data requirements and are based on a transition matrix.
In the case of Mexico, Markov chains have been used in migration studies (Garrocho, Jiménez-López, & Álvarez-Lobato, 2016), demographic projections (Partida, 1989), financial investments (Torres, Gaytán, & Tinoco, 2017), livestock diseases (Rojas, Barajas, Riemann, & Franti, 1993) and air quality (Hoyos, Lara, Ortíz, López, & González, 2009). In the case of land use change studies, recent cases are known in Texcoco (Pérez, Valdez, Moreno, González, & Valdez, 2012), Morelia (López, Bocco, & Mendoza, 2001) and Hidalgo (Reynoso, Valdez, Escalona, de los Santos, & Pérez, 2016). The purpose of the present study was to analyze the land use change in the micro-watershed of Zoquiapan in the period 1989-2009, through the Stochastic Márkov chains process, to estimate the trend of land use change in the year 2020 and find the transition matrix of the stable state. According to the proposed territorial ecological order made by Lomas-Barrié, Terrazas-Domínguez, and Tchikoué-Maga (2005), Zoquiapan covers a portion of the Park known as Parque Nacional Zoquiapan y Anexas, which has serious problems of ecological imbalance, environmental degradation, as well as a low sustainability of the environment.
Materials and methods
Study area
The study area included the micro-watershed of Zoquiapan of the Parque Nacional Zoquiapan, located in the 18th hydrographic region of the river Balsas over the watershed of the river Atoyac. The micro-watershed is located at the extreme UTM coordinates 2137115 to the North, 2122190 to the South, 544888 to the East and 532075 to the West; it has an area of 8 087 ha in the municipalities of Ixtapaluca, Chalco and Tlalmanalco in Estado de México, as well as in Tlahuapan and San Salvador el Verde in Puebla.
The micro-watershed has complex relief and heights that vary from 2 400 to 4 642 m, which means a gradient of more than 2 000 m. The volcanic origin is dominant with extrusive igneous class deriving in deep andosol soils, but it is possible to find very thin soils like lithosols in some small surfaces. The dominant climates are semi-cold of the temperate group with fresh and long summer. The annual rainfall varies from 1 000 to 1 500 mm, while the mean temperature ranges between 10 and 14 °C, although it is possible to find places with 5 to 10 °C (Instituto Nacional de Estadística y Geografía [INEGI], 2009 , 2013, 2014).
The above characteristics are reflected in the dominant land uses. According to the Instituto Nacional de Estadística, Geografía e Informática (INEGI, 2005) there are seven categories: fir forest, pine forest, pine-oak forest, induced grassland, fir forest with secondary vegetation, montane grasslands and agricultural uses. The management program of the same year shows that four vegetation associations predominate: association of fir Abies religiosa (Kunth) Schltdl. & Cham., association of Alnus firmifolia Fernald, association of Pinus hartwegii Lindl. and association of P. hartwegii-A. firmifolia.
Projection and probability of land use change in Zoquiapan
The analysis began with two satellite images of different dates, corresponding to the Landsat sensor (available at http://glcf.umd.edu/). The images with the best quality and low cloudiness were those of March 21, 2009 and March 7, 1989, both with a resolution of 25 m. The images were processed with the software IDRISI© (Eastman, 2012), where a false color combination was first made using bands 1, 2 and 3. Later, an unsupervised classification was made with the same number of previously known classes: forest, grassland and agricultural use. The process was repeated for both images with the care of having the same area of the studied area, resolution and number of classes. The forest class consisted of tree species such as fir, pine, oak and their associations. The grassland class refers to vegetation communities predominating pastures with few trees and shrubs that can be produced by the clearing of wooded land. It is also possible to find montane grasslands, predominating Lupinus montanus Kunth, Agrostis, Festuca and Muhlenbergia. The agricultural class refers to rain-dependent agricultural activities for annual production, known mainly as maize under rainfed conditions.
Following the methodology of Eastman (2012) the Markovian transition estimator was applied in the software IDRISI© in order to know the transition matrix of land uses in the micro-watershed of Zoquiapan, regarding the period 1989-2009, to project the use of soil in the year 2020 with an error of 5 %. According to Levin et al. (2009), when i and j are two states of a Markov chain, the probability will be given by P(X n+1) = j(X n = 1), denoted by pij(n, n+1) which represents the transition probability from state i at time n, to state j at time n+1. These probabilities are known as one-step transition probabilities. When the probabilities pij(n, n+1) do not depend on n, it is said that the chain is stationary or homogeneous in time. For simplicity, such situation is assumed so that the one-step transition probabilities are written as pij. For example, by varying the indices i and j over the set of states {0, 1, 2} we obtain the transition probability matrix as follows:
The input (i, j) of this matrix is the transition probability (ij); in other words, the probability of moving from state i to state j in a unit of time. A state is stable when there are no changes in the system; that is, equilibrium is reached. A possible way to obtain the stable state of the system is to repeat the calculations iteratively for each period in order to find the one that has those probabilities that remain constant or do not change .
When the Markov chains are applied, first we have to check whether the chain reaches the steady state. Since the observations that are generated are dependent, we have to wait for the chain to stabilize. This means that a certain number of iterations must be run as a “warm-up period” in the chain and then estimate their seasonality and convergence. In order to have an idea of a stationary state is being reached; the simplest thing is to make some graphs. For example, averages of some function of interest could be plotted, such as
Results and discussion
Projection and probability of land use change in Zoquiapan
Figure 1 shows the satellite images of the years 1989 and 2009, where it is observed that the dominant land use is forest followed by grassland and agricultural use. This was also found by Virgen-Cobos (2016), who points out that the associations of species in the Zoquiapan Forest Station are fir, pine, pine-Alnus firmifolia, pine-oak and pine-fir.
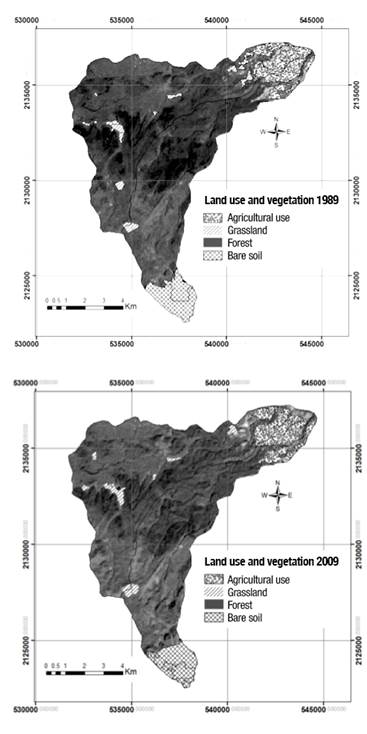
Figure 1 Classification of land use and vegetation in the micro-watershed of Zoquiapan, based on the satellite images of 1989 (top image) and 2009 (bottom image).
In Figure 1, the use of bare soil refers to the area without vegetation cover (203 ha), near the Iztaccíhuatl volcano. According to the results, in the 20 years studied, the agricultural area was reduced 1.86 ha; that is to say, it remained practically the same in the period 1989-2009. It should be noted that in the first year there were 522 hectares that corresponded to 6.45 % of the surface area. In terms of grassland, the surface area was also reduced 88.63 ha, going from 208.3 ha, which corresponded to 2.5 % of the micro-watershed of Zoquiapan, to 119.7 ha. The use of forest land, consequently, increased its surface area by practically 90.5 ha, as shown in Table 1.
Table 1 Surface occupied by land use and vegetation in the micro-watershed of Zoquiapan in the years 1989 and 2009.
| Soil use | 1989 | 2009 | Difference 1989-2009% | |||
|---|---|---|---|---|---|---|
| ha | % | ha | % | ha | % | |
| Agricultural use | 523.78 | 6.47 | 521.91 | 6.45 | -1.86 | -0.02 |
| Grassland | 208.39 | 2.57 | 119.76 | 1.48 | -88.63 | -1.09 |
| Forest | 7 052.37 | 87.22 | 7 142.87 | 88.32 | 90.49 | 1.11 |
| Bare soil | 302.60 | 3.74 | 302.60 | 3.75 | 0 | 0 |
| Total | 8 087.16 | 100.00 | 8 087.16 | 100.00 | 0 | 0 |
The results are similar to those obtained a few years ago. According to the analysis on land use change carried out by Lomas-Barrié et al. (2005), in general, the vegetation cover remained unchanged during the period from 1977 to 2000. The vegetation covers that were best maintained were the mixed forest, grassland and Abies forest. For its part, the Mexican Civil Council for Sustainable Silviculture (CCMSS, 2008) indicated that, in the period 2000-2007, agriculture in the area of influence of the park Izta-Popo lost 28 hectares of agricultural area, approximately, and that changes in land use were detected in only 1.35 % of the surface. In this way, with the results obtained in this study, it is possible to point out that the area of Zoquiapan has not had any aggressive change in land use since 1977, year of the first studies with satellite images.
According to Villegas, Muñoz, Muñoz, Gallo, and Ponce (2011), due to the legal practices of conservation of protected natural areas, transformation rates are low compared to unprotected areas. The micro-watershed of Zoquiapan is located within two subzones of management of the National Park: recovery subzone and preservation subzone (SEMARNAT, 2013). In these subzones, some of the unauthorized activities related to the modification of vegetation cover are the following: opening trails, gaps or roads; forest harvesting, except for scientific collection and domestic use; build public and private works; damage, cut and mark trees, except for scientific research activities; extract living or dead flora and fauna, as well as other biogenetic elements, except for self-consumption or scientific collection; livestock, including grazing; carry out hunting or exploitation activities of wild flora and fauna species without authorization, except for the use of natural resources for self-consumption purposes.
Another factor for which there is a low probability of land use change is the constant reforestations during the analysis period. According to the Manifestation of Environmental Impact of the Management Program for the Harvesting of Dead Trees, a reforestation was done in the year 2004 of the order of 10 ha and it was proposed to reforest 65.4 ha for the year 2006 (Universidad Autónoma Chapingo, 2005). Subsequently, in April 2010, and following a technical study due to the environmental contingency of the National Park Izta-Popo, Zoquiapan y Anexas, the SEMARNAT indicated the execution of reforestation work. This was done with native species at random, with homogeneous distancing that avoided competition between them and with forest density of 1 600 plants·ha-1; the clearings smaller than 100 m2 were also reforested. It is worth mentioning that this study proposed reforestation for three consecutive years in 325 ha (Tejada-Nichols, 2010).
Table 2 shows the results of the transition by type of dominant land use. The transition matrix analyzes the information of the years 1989 and 2009, to be used later in the projection for the year 2020. The above regarding that the conditions external to the analysis remain similar to those observed. According to the matrix, it is observed that the probability of the forest remaining as such by 2020 is 94 % (in 5 613 ha). The probability that grassland is maintained is 88 % (in 874 ha), while that of the agricultural area is 91 % (in 284 ha). That suggests that there are high probabilities that current uses will remain; that is, if we continue with the current trend, we can expect that the dominant vegetation covers will be maintained by the year 2020.
Table 2 Probability of change or permanence between land uses in the micro-watershed of Zoquiapan for the year 2020.
| Soil use | Forest | Grassland | Agricultural |
|---|---|---|---|
| Forest | 0.9454 | 0.0546 | 0.0000 |
| Grassland | 0.0556 | 0.8875 | 0.0569 |
| Agricultural use | 0.0000 | 0.0900 | 0.9100 |
With respect to the changes, they are not projected from an agricultural use to the forest or vice versa. This can be attributed to the conservation of the majority of the surface analyzed. The population near the area of Zoquiapan recognizes the value of forest ecosystems in the provision of environmental services. On the other hand, the change of use from agricultural land to grassland is the most likely, with 9 % for 324 ha. This may be explained when an agricultural plot is abandoned, because a process of ecological succession begins and the land is initially covered by grass.
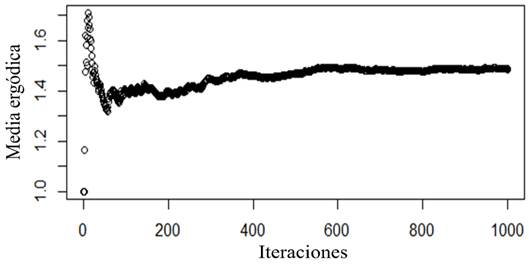
Figure 2 shows the behavior of the ergodic average; it is observed that the stable period is reached after the 400 iterations. The estimation of the ergodic average averages the states of the Márkov chain (forest, grassland or agriculture) every 10 iterations and graphs them to make visible the moment in which these states converge and stop changing. The values shown in Table 2 come from the stable state, which was reached after 600 iterations in the ergodic average.
As pointed out a few years ago by Orantes and Musálem (1982), who considered 50-year-old trees in their study, the experimental field of Zoquiapan has trees of medium to high quality with heights of more than 20 m. Over the years and in accordance with the conservation efforts made in the area, in this study it was found that the vegetation covers have remained practically unchanged. However, the region is susceptible to forest fires (Castañeda, Endara, Villers, & Nava, 2015; Rodríguez Trejo, 2001) and even to clandestine logging and pest attacks (SEMARNAT, 2013).
Considerations for forest management of the micro-watershed of Zoquiapan
The forest area analyzed is within the subzones of preservation and public use of the National Park Iztaccíhuatl-Popocatépetl, where forest harvesting is not allowed, except for scientific collection and domestic use. However, there is a manifestation of environmental impact that allows selective felling of dead trees with the purpose of maintaining phytosanitary conditions of the forest (Universidad Autónoma Chapingo, 2005). In this sense, it is recommended to reforest with native species to maintain the vegetation cover, because it is an area susceptible to water erosion due to the factor that is pending that is higher than 26 %. It is also recommended to make firebreaks and implement forest cleanup and sanitation plans. The conservation of the area is a priority, since in the ravines the blue juniper (Juniperus monticola fo. compacta Martínez), is distributed, a species under special protection in accordance with the NOM-059-SEMARNAT-2010 (SEMARNAT, 2010).
The grassland area is located in the public use subzone of the National Park Iztaccíhuatl-Popocatépetl, where livestock is not allowed. However, this activity, although of low impact, it is carried out, so it is necessary to establish a grassland management program by means of restoration and recovery of the vegetation cover.
In the agricultural areas, the slope is moderate so it is recommended to implement soil and water conservation practices, such as conservation tillage, terraces, contour furrowing and rotation of crops. It should be noted that the agricultural area is not within the limits of the National Park Iztaccíhuatl-Popocatépetl .
A problem that has not been eradicated is the extensive livestock farming that causes overgrazing, affecting natural regeneration. An alternative could be the definition of suitable agroforestry areas for such activity and promote a sustainable management that considers the carrying capacity. The exclusion of grazing areas requires enclosing areas conducive to natural regeneration. According to Serrada (2003), soil compaction is a factor that hinders natural regeneration, since it prevents contact of the seed with the mineral soil and proper rooting. The presence of organic waste, leaf litter and twigs also avoid the contact of the seed with soil, as well as the presence of the dense herbaceous cover that, in addition, causes competition between species. The favorable conditions for natural regeneration can be created by soil improvement actions that reduce their compaction, such as scarification and controlled burning.
On the other hand, it is suggested to reforest with native species those areas with low forest density, to increase it up to 1 600 plants per hectare. The growth of forests leads to an increase in interception rates and a greater infiltration of moisture in soils; also, a balanced structure of the stands provides habitat for wildlife, contributing to the increase in biodiversity.
According to Aguirre (1997) it is important to keep dying trees, dead trees and large fallen trees to preserve the species associated with them, which can be distributed in a fraction of the stand forming copses. It also indicates the prevention of forest fires by reducing the accumulation of combustible materials and the use of firebreaks, black lines, pruning, clearing, thinning or prescribed burns.
Finally, it is important that the Forest Station of Zoquiapan continues with its fundamental objectives of teaching, research, conservation and, above all, sustainable management of natural resources.
Conclusions
According to the results, for 2020, the areas covered by forests within the micro-basin of Zoquiapan will have a low probability of land use change. The aforementioned as long as the efforts that so far are made to conserve the site continue. Areas covered with grassland and used for agricultural activities also have a low probability of change. Specifically, and considering the results of the transition matrix as stable state, the probabilities of permanence of land uses are 94 % for forest, 88 % for grassland and 91 % for agricultural activities. The method applied is able to capture the behavior of land uses in recent years for the study region.

