


 texto en
  Inglés (pdf)
 Artículo en XML
 Referencias del artículo
 Enviar artículo por email
 Citado por SciELO
  Similares en
SciELO
Similares en
SciELO 
 Permalink
Introduction
Chest-height trunk diameter (CHD) and height (Ht) are the two main variables measured in forestry inventories, both being required measurements in decision-making in forest plantation management as well as for research on growth modeling, characterization of stand structure, estimation of timber yield and to determine the predominant height with the purpose of evaluating site quality (Costas & Rodríguez, 2003; Huang, Titus, & Wiens, 1992; Lappi, 1997).
While height is difficult to measure and prone to measurement errors, diameter is easily, accurately and economically measured. Therefore, it is very important to evaluate the degree of precision this relationship has in different tree species. Several non-linear functions have been used to relate trunk diameter and height of forestry stands (Juárez et al., 2006; Pece et al., 2006; Prodan, Peters, Cox, & Real, 1997; Vibrans, Moser, Oliveira, & Macaneiro, 2015). The local equations used to describe CHD-Ht relationships are not complex like equations E1 to E10 in the research of Trincado and Leal (2006), taken from several literature reports. However, different seasonal and forest stand conditions have led to a situation in which a single diameter-height equation would not fit all conditions, in such a way that an individual relationship must be fit according to differential development of individual forest land. However, this process requires huge amounts of data and is very costly (Schröeder & Álvarez-González, 2001). Thus, these models must be of a local nature and should be fit individually to each tree stand growing under very particular environmental conditions of age, soils, climates, slope and exposures. What this suggests is that the extrapolation of general relationship is of limited value because the curves change according to a particular combination of such conditions e. g. low and high tree densities tend to produce respectively larger and smaller diameters for similar heights (Costa, Schroder, & Finger, 2016; López et al., 2003).
Therefore, the objective of this research was to find a mathematical function that best relates diameter at chest height (
Materials and methods
Study area
The private commercial forestry plantation is located in the municipality of Tlapacoyan, State of Veracruz, Mexico. The elevation ranges from 822 to 881 m and the geographic coordinates are 19° 56’ 40” North latitude and 97° 15’ 42” West longitude (Google Earth©, 2011) (The mention of a trademark brand is not an endorsement either by the authors or the National Autonomous University of Mexico). The site belongs to the neovolcanic axis province and its topography is a volcanic sierra with non-steep hillsides. Winds travel freely from east to west bringing with them oceanic moisture, that with time has proven strategic for the distribution of low and medium forest. The soil is a luvic Andosol, derived from igneous extrusive rock (volcanic ash, basalt, siliceous toba) and presents an argillic horizon; its cation exchange capacity is about 250 cmol·kg-1 of clay and its base saturation is around 50 %. The climate is (A)Cf, semi-hot and humid, with rainfall from 2 000 to > 2 500 mm per year and monthly temperatures from 16 °C in January to >32 °C in June, with annual means between 20 °C to 22 °C (García 1981; Instituto Nacional de Estadística, Geografía e Informática [INEGI], 2009). The natural vegetation was a perennial subtropical forest, deforested a long time ago for coffee plantations and mostly grassland. The cattle enterprise was abandoned several years ago and converted into a commercial forest plantation.
Tree species under study
The owner of the mixed forest in which the study took place used to cover the demand for cedar (Cedrela odorata [L.]) timber with trees growing naturally in pastures. In this region the development of red cedar plantations has been slow over the last few decades because cedar trees grow slowly. This being the case, the forest producer instead of establishing a cedar plantation opted for wild avocado (Cinnamomum sp.) and the fast-growing M. azedarach, known locally as piocho. The use of P. chiapensis has received some promotion by local government offices and along with M. azedarach are two species for reforestation available in government nurseries. On the above basis, the owner of the plantation decided to use these three forest species to convert his land from grassland to a commercial forest. The three tree species under study have been described in detail in the literature: Wild avocado (Cinnamomum sp.) by Lorea-Hernández (1997); Chiapas white pine (P. chiapensis) by Sistema de Información para la Reforestación (SIRE), Comisión Nacional Forestal (CONAFOR), and Comisión Nacional para el Conocimiento y Uso de la Biodiversidad (CONABIO) (2015); and White cedar or piocho (M. azedarach) by SIRE, CONAFOR and CONABIO (2015a).
Establishment and management of trees
After seed scarification and conditioning, seedlings were started in a nursery by planting in black plastic bags filled with 1.5 kg of a mixture of sand, clay and cow manure, which were irrigated as needed and allowed to germinate and grow under light shade until they reached a height of 25 to 28 cm just before planting in March 2010 (Jarillo-Rodríguez et al., 2013). The three species were established in association within the same area, one row planted with P. chiapensis and M. azedarach and the next with Cinnamomum sp. only, and so on; distance between rows was 3.0 m. Spacing between trees within the P. chiapensis/M. azedarach row was 2.5 m and 5.0 m in the Cinnamomum sp. row.
The planting grid had a Cinnamomum tree in the center of a square with opposite corners formed by two M. azedarach and two P. chiapensis trees. The arrangement took into account the future use of the trees. As M. azedarach grows more rapidly than the other two, it will be harvested between 11 and 13 years of age (Gaillard, Pece, Juárez, & Ríos, 2002; Patil, Mutanal, & Patil, 2012) leaving more space for the growth of P. chiapensis, which because of its intermediate rate of growth will be harvested between 12 and 22 years of age (Domínguez, 1986; Fierros-Mateo, De los Santos-Posadas, Fierros-González, & Cruz-Cobos, 2017; Rodríguez-Acosta & Arteaga-Martínez, 2005) or more (Sánchez & del Castillo, 2001) . Finally, the most space was left for Cinnamomum sp., as conventional wisdom in the region indicates that it reaches commercial size by the age of 25 to 35 years.
Statistical analysis
Height (Ht, m) and chest-height trunk diameter (CHD, cm) data were gathered in August, 2013. For Ht, a 6 m ladder was used to climb to a height that allowed its measurement aided with a 30 m measuring tape. For this, the tape’s 0-mark was lifted to the highest tip of the trunk by attaching it to a long pole and then the remaining tape lowered down to the base of the trunk and height recorded to the nearest centimeter. Visualization of the tape’s 0-mark at the tip of the tree was done with 10x binoculars. The measurement of CHD was done at
Data were transferred to a spreadsheet, and the following descriptive statistics obtained: Number of observations, minimum and maximum values, mean, standard deviation, coefficient of variation, standard error of the mean, skewness and kurtosis. The distributions of data were considered to significantly (P ≤ 0.05) depart from normality if the absolute value of the ratios skewness/standard error of skewness (S/SES) and kurtosis/standard error of kurtosis (K/SEK) were larger than two (Joanes & Gill, 1998).
Twenty-two models, thirteen with two parameters and nine with three parameters, were compared to determine which one best described the diameter-height relationship (Table 1). These models are the same ones tested by Osman, Idris, and Ibrahim (2013), and were chosen after the reports of Moore, Zhang, and Stuck (1996); Sharma (2009); and Zhao, Mason, and Brown (2009). However, the 1.3 m intercept was not included. The assumption to include the intercept is that it assures that total height equals breast height (1.3 m) when diameter equals zero. However, the trunk diameter at 1.3 m height does not exist if the diameter value is non-existent; furthermore, the assumed 1.3 m-intercept is unnecessary to correctly predict height from diameter. In Table 1, ‘y’, ‘x’ and ‘exp’ correspond to height (H, m), chest-height trunk diameter (D, cm) and the base of the natural logarithms, while ‘a’, ‘b’, and ‘c’ are equation parameters.
Table 1 Non-linear regression models compared in the present study that relate the diameter at breast height and height of a certain species.
| Model | Equation | Parameters | Model | Equation | Parameters |
|---|---|---|---|---|---|
| M1 | y = a*xb | 2 | M12 | y = (a*x)/(b + x) | 2 |
| M2 | y = a*eb/x | 2 | M13 | y = x2/(a + b*x)2 | 2 |
| M3 |
|
3 | M14 | y = (a + b/x)-2.5 | 2 |
| M4 | y = x2/(a + b*x + c*x2) | 3 | M15 | y = (a + b/x)-8 | 2 |
| M5 | y = a*xb + c*x | 3 | M16 | y = a*[1 + (1/x)]-b | 2 |
| M6 | y = (a*x2)/(x + b)2 | 2 | M17 | y = ea + b/x | 2 |
| M7 | y = x2 / (a + b*x)2 | 2 | M18 | y = a*[ln(1/x)]b | 2 |
| M8 | y = (a + b/x)-5 | 2 | M19 |
|
3 |
| M9 | y = a*(1 + e-b*x)c | 3 | M20 | y = a/(1 + b-1*x-c) | 3 |
| M10 | y = ea + (b/(x + 1)) | 2 | M21 |
|
3 |
| M11 |
|
3 | M22 | y = xa/[b + (c*xa)] | 3 |
The parameters of the equations were estimated by least squares using the Marquardt-Lavenberg iteration (Marquardt, 1963), under the assumption that the errors in the data were normally distributed, and then parameter estimation was equivalent to using the maximum likelihood principle (Silvert, 1979).
Data analyses was performed using GraphPad Prism version 6.07 for Windows (GraphPad Software, 2015; the mention of a trademark brand is not an endorsement either by the authors or the National Autonomous University of Mexico), according to Motulsky and Christopolous (2003). Outlier elimination was done according to the ROUT method, as proposed by Motulsky and Brown (2006), with the only purpose to improve fit. The software calculates the Akaike’s information criterion (AIC) as:
where
N |
number of observations |
K |
number of parameters |
SS |
sum of squares of the vertical distances of the points from the curve |
It also calculates the adjusted coefficient of determination (
In order to determine which model had on average the best fit, their AIC values within each tree species were converted to ranks, and then a two-way non-parametric analysis of variance was performed. A sum of ranks comparison between the model with the lowest sum of ranks (control) and the other models was done with Dunnett’s test (1964). A combination of PROC RANK and PROC ANOVA of SAS was used for this analysis (Statistical Analysis System [SAS], 2013).
Results and discussion
Mean height was higher in M. azedarach, followed by P. chiapensis and Cinnamomum sp. The coefficient of variation values followed a reverse order, while the standard errors of the means were very low (0.06-0.07) due to the large number of observations (Table 2). Skewness was negative in the three species and absolute values of the ratios were larger than two, so height distributions had a peak significantly (P < 0.05) skewed to the right. Kurtosis was negative for Cinnamomum sp. and positive for the other species. In Cinnamomum sp. the ratio was < 2, so the distribution was platykurtic, showing a flat peak. In P. chiapensis and M. azedarach both ratio absolute values were much larger than two, indicating a narrow or leptokurtic peak.
Table 2 Descriptive statistics for tree height and chest-height trunk diameter in three forest species growing in a semi-hot and humid environment in the piedmont area of the Mexican Eastern Sierra Madre in the State of Veracruz, Mexico.
| Statistic | Tree species | ||
|---|---|---|---|
| Cinnamomum sp. | Pinus chiapensis | Melia azedarach | |
| Observations | 666 | 672 | 719 |
| Height (m) | |||
| Minimum | 0.54 | 2.15 | 2.35 |
| Maximum | 12.05 | 12.95 | 13.45 |
| Mean | 6.88 | 8.16 | 10.19 |
| Standard Deviation | 1.80 | 1.66 | 1.49 |
| Coefficient of variation (%) | 26.20 | 20.3 | 14.6 |
| Standard error (SE) | 0.07 | 0.06 | 0.06 |
| Skewness | -0.45 | -0.50 | -1.33 |
| SE of Skewness | 0.09 | 0.09 | 0.09 |
| Kurtosis | -0.10 | 0.69 | 2.55 |
| SE of Kurtosis | 0.19 | 0.19 | 0.18 |
| Chest-height trunk diameter (cm) | |||
| Minimum | 0.64 | 1.88 | 0.92 |
| Maximum | 16.55 | 18.84 | 21.77 |
| Mean | 8.34 | 10.77 | 14.50 |
| Standard Deviation | 2.77 | 2.29 | 3.32 |
| Coefficient of variation (%) | 33.20 | 21.20 | 22.90 |
| Standard error (SE) | 0.11 | 0.09 | 0.12 |
| Skewness | -0.16 | -0.31 | -0.89 |
| SE of Skewness | 0.09 | 0.09 | 0.09 |
| Kurtosis | -0.37 | 0.38 | 1.04 |
| SE of Kurtosis | 0.19 | 0.19 | 0.18 |
Mean trunk diameter was smallest in Cinnamomum sp., intermediate in P. chiapensis and largest in M. azedarach. Variability was larger in wild avocado and smaller in Chiapas pine and piocho. Again, the standard error of the mean was small (0.09-0.12) due to the large N (Table 2). The three species showed negative skewness, thus diameter distribution had a peak to the left, but it differed significantly (P < 0.05) from the normal distribution only in Chiapas pine and piocho. Kurtosis was negative in wild avocado and positive in the other two species. Cinnamomum sp. and P. chiapensis had an almost normal peak (mesokurtic) while M. azedarach presented a narrow-peaked leptokurtic distribution.
The six non-linear models with the best fit for each tree species are presented in Table 3. In terms of
Table 3 Parameters of six models with the best fit according to Akaike’s information criterion (AIC), used to describe the chest-height trunk diameter to height relationship in three forest species growing in a semi-hot and humid environment in the piedmont area of the Mexican Eastern Sierra Madre in the State of Veracruz, Mexico.
| Núm | Model | Parameter values |
|
AIC | ||
|---|---|---|---|---|---|---|
| a | b | c | ||||
| Wild avocado (Cinnamomum sp.) | ||||||
| 5 | y = a*x(b + c*x) | 1.20 ± 0.10 | 0.95 ± 0.05 | -0.01 ± 0.00 | 0.785 | -1 290.5 |
| 19 |
|
10.75 ± 0.61 | -0.11 ± 0.00 | 1.08 ± 0.06 | 0.783 | -1 280.5 |
| 9 | y = a*[1 + e-b*x]c | 11.04 ± 0.58 | -0.13 ± 0.02 | 1.09 ± 0.10 | 0.783 | -1 279.7 |
| 20 | y = a/(1 + b-1*x-c) | 14.32 ± 1.44 | 0.08 ± 0.00 | 1.17 ± 0.10 | 0.782 | -1 272.1 |
| 22 | y = xa/[b + (c*xa)] | 1.18 ± 0.11 | 0.85 ± 0.10 | 0.07 ± 0.00 | 0.782 | -1 272.1 |
| 12 | y = (a*x)/(b + x) | 17.58 ± 0.67 | 12.33 ± 0.81 | -------- | 0.781 | -1 266.1 |
| Chiapas white pine (Pinus chiapensis) | ||||||
| 9 | y = a*[1 + e(-b*x)c] | 10.14 ± 0.44 | -0.20 ± 0.04 | 1.68 ± 0.46 | 0.350 | 46.3 |
| 19 |
|
9.71 ± 0.37 | -0.07 ± 0.02 | 1.40 ± 0.17 | 0.338 | 76.9 |
| 20 | y = a/(1 + b-1*x-c) | 11.17 ± 0.86 | 0.04 ± 0.02 | 1.75 ± 0.32 | 0.335 | 83.9 |
| 22 | y = xa/[b + (c*xa)] | 1.75 ± 0.33 | 1.96 ± 1.08 | 0.09 ± 0.00 | 0.335 | 83.9 |
| 8 | y = (a + b/x)-5 | 0.59 ± 0.004 | 0.63 ± 0.04 | -------- | 0.332 | 88.8 |
| 16 | y = a*[1 + (1/x)]-b | 13.34 ± 0.40 | 5.32 ± 0.33 | -------- | 0.332 | 88.8 |
| Piocho (Melia azedarach) | ||||||
| 11 |
|
18.25 ± 2.92 | 2.46 ± 0.23 | 0.55 ± 0.13 | 0.490 | -515.3 |
| 21 |
|
2.90 ± 0.16 | -2.46 ± 0.23 | 0.55 ± 0.13 | 0.490 | -515.3 |
| 20 | y = a/(1 + b-1*x-c) | 15.47 ± 1.57 | 0.16 ± 0.02 | 0.95 ± 0.16 | 0.489 | -512.4 |
| 22 | y = xa/[b + (c*xa)] | 0.95 ± 0.16 | 0.39 ± 0.09 | 0.06 ± 0.00 | 0.489 | -512.4 |
| 12 | y = (a*x)/(b + x) | 15.08 ± 0.33 | 6.38 ± 0.45 | -------- | 0.489 | -512.3 |
| 18 | y = a*[ln(1/x)]b | 3.90 ± 0.17 | 0.98 ± 0.04 | -------- | 0.490 | -511.4 |
Height-diameter scattering plots along with the best non-linear model for each tree species are presented in Figure 1. The shape of the predicted lines is quite similar, but the respective models were not, as the best models were: the two-parameter hyperbola (model 12) for wild avocado (Landsberg, 1977); the three-parameter Richards’ function (model 9) (Richards, 1959; Zeide, 1993) for Chiapas white pine; and the three-parameter sigmoid function (model 11) of Korf (1939) for piocho (Stage, 1963; Zeide, 1989).
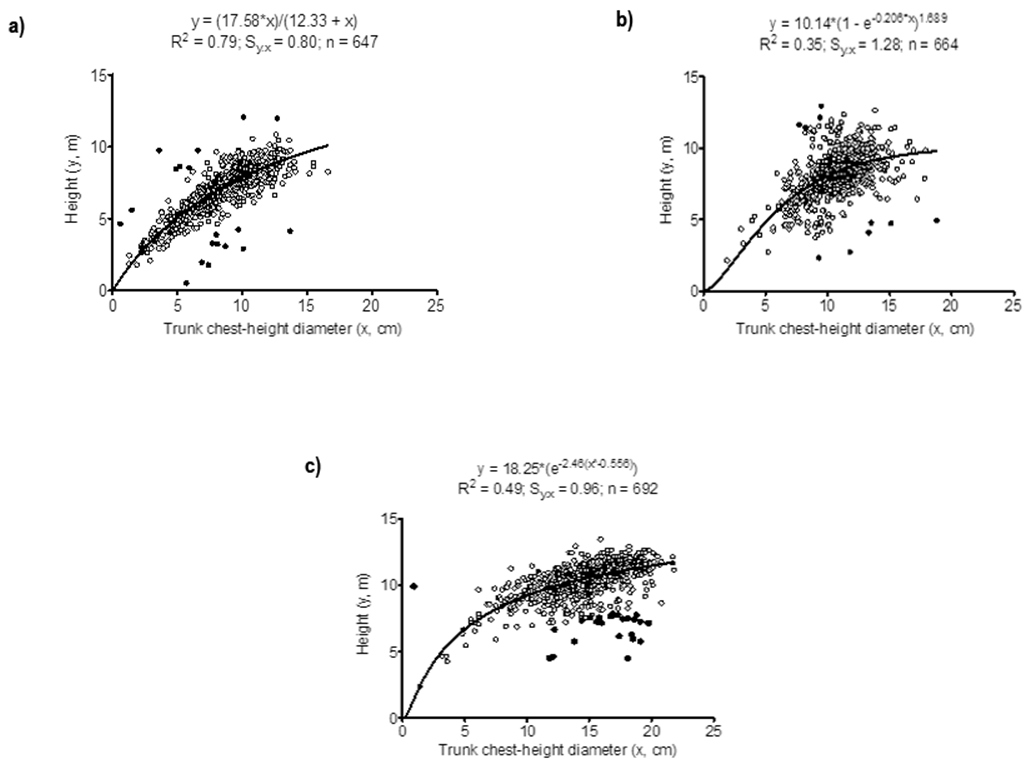
Figure 1 Graphic representation of the best models to describe the trunk chest-height diameter to height relationship in three species grown in a commercial forest plantation in a semi-hot and humid climate of the State of Veracruz, Mexico. A) Wild avocado (Cinnamomum sp.) model 12; B) Chiapas white pine (Pinus chiapensis) model 9; C) Piocho (Melia azedarach) model 11. Open dots are data used to fit the models; closed dots were outliers excluded from the analyses.
The analysis of variance showed that the model effect was highly significant (P = 0.0008) upon ranks. The model M19 presented a significantly (P ≤ 0.05) lower sum of ranks (a better fit on average) than models M01, M02, M03, M04 and M17. The sum of ranks of M09, M20 and M22 differed from that of M19 in 0.5, 0.5 and 1.0 rank units. The remaining models were statistically (P > 0.05) similar to M19, even though their sum of ranks were from 1.9 to 4.0 times larger (Table 4).
Table 4 Dunnett´s post hoc comparison of the sum of ranks of model M19, the one with the lowest rank or the best fit on average.
| Model | Sum of ranks* | Significance** | Mi/M19 |
|---|---|---|---|
| M19 | 11.0 | --- | |
| M20 | 11.5 | NS | 1.0 |
| M22 | 11.5 | NS | 1.0 |
| M09 | 12.0 | NS | 1.1 |
| M11 | 21.0 | NS | 1.9 |
| M21 | 21.0 | NS | 1.9 |
| M05 | 28.0 | NS | 2.5 |
| M12 | 28.0 | NS | 2.5 |
| M10 | 34.5 | NS | 3.1 |
| M18 | 35.0 | NS | 3.2 |
| M06 | 38.0 | NS | 3.5 |
| M07 | 38.0 | NS | 3.5 |
| M13 | 38.0 | NS | 3.5 |
| M14 | 38.0 | NS | 3.5 |
| M08 | 38.5 | NS | 3.5 |
| M16 | 38.5 | NS | 3.5 |
| M15 | 43.5 | NS | 4.0 |
| M03 | 51.0 | ** | 4.6 |
| M02 | 52.5 | ** | 4.8 |
| M17 | 52.5 | ** | 4.8 |
| M01 | 55.0 | ** | 5.0 |
| M04 | 62.0 | ** | 5.6 |
*The best fit corresponds to models with the smallest sum of ranks. **Significant at P ≤ 0.05.
The best six models for each species differed very little among them with respect to their fit, as
Some models yielded the same
Model 12, the best for wild avocado, has a zero intercept, and thus fulfills the assumption that if no diameter exists, height must also be nonexistent, which is consistent with Pasteur’s Principle of Homogenesis v. gr. “…at zero mass, there is no potential for growth…” (Huxley, 1924). This model provides an estimation of the asymptotic or maximum height that a species’ cohort should have reached had it had the optimum conditions to do so, in this case, 17.58 m (Table 3). It also produces a changing value of the slope [a*b/(b + x)2] as diameter changes, thus forming the curvature typically expected of the height-diameter relationship in several tree species.
The Richards’ function was the one that best fitted the H-D relationship in Chiapas white pine (model 9). This is a generalized logistic function which predicts maximum tree height at a = 10.14 m; it also has the “S” shaped form of the logistic, but it is inherently asymmetrical. The parameter c = 1.68, or point of inflection, indicates when the a/2 value (half the height asymptote) occurs on the diameter axis (Birch, 1999), which in this case was (5.3 cm. It also predicts that at zero diameter height must be zero.
Korf’s function fit the data best in piocho. Here almost half the variation in height was explained by diameter. Zeide (1993) stated that this equation was first proposed in Czechoslovakia by Korf (1939) and he and subsequent researchers (Brewer, Burns, & Cao, 1985; Stage, 1963) applied it to model height growth of forest stands with moderate success. The equation is quite suitable to describe diameter growth of a fixed number of trees. Zeide (1989) used the average growth of thousands of stem analyses of different species from different locations and showed that Korf’s model was more accurate than other models. The Richards, Weibull, Gompertz and logistic models had standard errors of the estimate that were 2.1, 2.3, 3.4 and 4.8 times larger than the model of Korf (Zeide, 1989). Korf’s function predicted a maximum height of 18.25 m, a value that could only be reached at an unrealistic diameter of 1.29E+07 cm. Models 20 and 12 (Table 3) predicted asymptotes of 15.47 m and 15.08 m, respectively, which were closer to the largest height diameter measured in the field, which was 13.45 m (Table 2).
At any rate, the fit of the Richards’ function in Chiapas pine, in terms of the adjusted R2, was lower than that shown by the hyperbola for Cinnamomum sp. and the Korf’s function for piocho (0.35 vs. 0.79 vs. 0.49; Table 3; Figure 1). Barrett (2006) modeled the height of 137 374 trees of 38 common species inventoried from 1988 to 2000 in 1 389 plots along the states of Washington, Oregon and California, USA, with the Richards’ function and found R2 values ranging from 0.44 to 0.83 and that in general, conifers showed higher values than hardwoods but among the former, those with highly variable tree forms like Pinus contorta (Balf.) and P. occidentalis Swartz had lower R2 values. This is contrary to our results. The most likely explanation for this discrepancy is that Chiapas pine and piocho, being non-native species, are outside their range of environmental conditions for optimum growth, and this leads to a high variability due to growth differences in response to individual sites where the trees are growing. It has been shown that for a given stand of trees of the same species with similar age and growing under similar environmental conditions, the non-linear relationship between diameter and height is affected by site quality and tree stand density e. g. young tree stands in good sites have a stronger slope, while trees in older stands in less favorable sites show a flatter slope (Prodan et al., 1997). For our data, factors such as slope, exposure and soil differences remain to be tested. Several trees of each species should be measured, along with field traits like soil type, slope, exposure and others, and then tested to determine whether or not common conditions lead to a same best fit function or, alternatively, the functions do in fact change with field conditions.
In the practical sense, the mixed tree plantation took into account the different rates of growth and development of each tree species that will make them reach the adequate age and size for harvesting at different times, which at the end is related to the space for growth of the remnant trees v. gr. M. azedarach is the fastest growing, followed by P. chiapensis and Cinnamomum sp. in this order. In this way, if M. azedarach is harvested first, space is opened up and there is less competition for the other two species to grow; then at 16 to 22 years after planting P. chiapensis is harvested, leaving all space for Cinammomum sp. growth. Domínguez (1986) reported 18.3 m of height and 29.5 cm of chest-height-diameter at 12.5 years of age in M. azedarach, while P. chiapensis reached at 30 years of age, 25-30 m and 60-65 cm, respectively. On the other hand, empirical observations indicate that Cinnamomum sp., would require from 25 to 35 years of growth to have a height of 18 m and 80 cm of chest-height-diameter. These values would justify, initially, the type of tree species arrangement in the field available for the present research.
Another important aspect of the present evaluation is related to the scarce number of branches and leaves in M. azedarach and Cinnamomum sp. that would allow a greater amount of light to reach the ground, as compared to other more leaf-dense tree species. In this sense, the scarce shadow that M. azedarach generates as well as it being a winter-deciduous species makes it particularly adaptable as a tree component in agrosilvopastoral systems. An experiment conducted in the same property within a 1 200 trees·ha-1 pure piocho stand compared the growth of four C4 grasses during the rainy (August 2013) and windy (February 2014) seasons under sun and shade (Santiago-Hernández et al., 2015). On average, shade resulted in a 107 % reduction in biomass from 4 851 to 2 342 kg·ha-1, while rainy and sunny conditions produced eight times (8 326 kg·ha-1) more biomass than windy, cold and shady conditions (1 071 kg·ha-1). The establishment of silvopastoral systems using Cinnamomum sp. and M. azedarach appears to be a feasible alternative to improve the landscape and farmers’ income.
Conclusions
Our results agree in the general sense with the view that most biological processes like the growth of organisms is an imprecise phenomenon. The best models barely differed from others that fit the data almost equally well. Future research in this plantation must consider the present results and use the best functions to construct site indexes. Further investigation about the effects of slope, exposition and soil quality on the chosen best fit function should be pursued.

