


 text in
  English (pdf)
 Article in xml format
 Article references
 Send this article by e-mail
 Cited by SciELO
  Similars in
SciELO
Similars in
SciELO 
 Permalink
Introduction
Urbanization has tremendously altered the natural landscape in the world, which inevitably has resulted in various effects on the structure, function, and dynamics of ecological systems at a wide range of scales (Breuste, Feldmann, & Uhlmann, 1998). Over the past 10 to 20 years, urban expansion has been occurring more rapidly than ever before in China. Today, about 50 % of China’s population lives in cities, compared to 26 % at the end of the 1980s, and the country is still rapidly urbanizing (Wu, Huang, Wu, & Zhang, 2008). Thus, city greening and environmental improvement have become very important issues, since many Chinese cities have air pollution problems (Shao, Tang, Zhang, & Li, 2006; Wu, McBride, Nowak, Yang, & Cheng, 2003). In recent years, the Chinese government has recommended and actively promoted the development of urban forests. In such circumstances, it is important to obtain a more detailed understanding of the status of urban forests in the country, in particular due to the characteristics of their structure at landscape scale, such as landscape pattern network (Liu, Liu, & Liao, 2009).
The urban forest is defined as the sum of all woody and associated vegetation in and around dense human settlements, ranging from small communities in rural settings to metropolitan regions (Miller, 1997; Nowak, 1994). In China, green spaces or systems as a terminology of city greening have been used more than urban forests. One key to studying urban forests is to understand their forest structure and its relationship to forest function. In most cases from an ecological viewpoint, urban forest structure is considered as including species composition, population structure, tree size and tree health situation (Rowantree, 1984, 1986). Information on this structure provides the basis for understanding the urban forest function that affects urban inhabitants and for improving management to maximize the environmental and social benefits of urban forests (Li, Wang, & Huang, 2011; McPherson, Simpson, Peper, Maco, & Xiao, 2005). In recent years, more researchers have paid close attention to urban forest structure at landscape scale, because its distribution configuration has great relevance to its functions (Kong, Chen, Zhao, Zhang, & Yin, 2002; Wu, Wu, Gao, & Zhang, 2003). Thus, a good understanding of the distribution pattern of an urban forest site at landscape scale is essential for information on urban forest structure. It is also fundamental for planning land usage, managing its natural resources, protecting city biodiversity and improving the city environment. However, so far only a few studies on urban forests at landscape scale have been reported in China. Some research has indicated that the size of the urban forest patch is smaller in general in most of the studied cities and distributed unevenly, thus limiting the functions of these urban forests (Wu, 2000). The establishment of a new urban forest system did not represent an obvious improvement to the ecological environment. This is mainly due to the limited knowledge of urban forest distribution at landscape level in China.
The aim of this paper was to analyze the urban forest landscape pattern and ecological network structure in the Pudong district in Shanghai, China.
Materials and methods
In this paper, 3S (remote sensing, global positioning system and geographical information system) techniques were employed to analyze urban forest patterns in the Pudong district of Shanghai city. This district is a rapidly urbanizing region, and its development model is representative of the urbanization trend in this country. This study mainly focused on green corridors and green networks. The gradient analysis of the urban forest patches was made from the commercial center to the suburbs along the west-east axis of city development, because its urban-to-rural gradient is also an important step in studying the relationship between human activities and the urban forest landscape pattern. The results could also be used to examine the relationships between the urban forest pattern and city development (Jenerette & Wu, 2001; Luck & Wu, 2002), and it will indicate if urban forest establishment is logical with urban development.
We used the terminology of green corridors, which are defined as an aggregate entity including trees, shrubs, ground plants and other elements. Usually they are a strip or linear green space attached to roads or rivers. In landscape planning, the design of a corridor or network is one of the most important issues, whereas only a few studies on city green networks have been reported so far (Li, Wang, & Song, 2008).
Study area
Pudong, situated in the eastern part of Shanghai city and bounded by the Huangpu River in the west and the East China Sea in the east, was selected as the study area, which is an administration district of the city (Figure 1), at 117° 11’ to 117° 22’ east longitude and 31° 48’ to 31° 58’ north latitude. Shanghai lies in the Yangtze River delta of China, the area of the entire territory is 6 340.5 km2, and it has a population of 23 million. The entire study area covers 553 km2, and its population reached 1.94 million in 2009. Since 1990 the district has undergone a rapid urbanization process, and the built-up area has extended eastward. A ring highway around the city could be regarded as the demarcation line between the built-up area and the suburbs. The built-up area covers 253 km2 and the suburb area covers 300 km2. The greening percentage reached 37.3 % in 2008 and increased by 4.4 times compared to 8.54 % in 1993 (Shanghai Municipal Statistic Bureau, 1994, 2009).

Figure 1 The location of study area and sample transect for gradient analysis of urban forest patches.
The city is located in a subtropical climate zone with four distinct seasons, the annual average temperature is 15.7 °C, 234 days are frost-free per annum and annual precipitation is 1 119 mm. The zonal vegetation is evergreen and deciduous broad-leaved mixed forest, but primary vegetation in the region has vanished due to deforestation and human activities. The major tree species used in city greening are Cinnamomum camphora (Linn.) Pres, Platanus orientalis Linn., Sophora japonica Linn., Celtis sinensis Pers., Ligustrum lucidum Ait., Metasequoia glyptostroboides Hu et W. C. Cheng, Osmanthus fragrans (Thunb.) Lour., Photinia spp., Ulmus spp., Populus spp. and Magnolia spp.
Study methods
Using Landsat 7 2008TM, 2007 Spot Image, Google Earth and City Maps, the structural characteristics of the Pudong urban forest landscape were analyzed. The land use was classified as six “patch types” (or classes): urban forest, general green space, hard surface, agricultural field, water and bare land. Land with more than 30 % tree canopy coverage was classified as urban forest patch, while land with less than 30 % tree canopy coverage was classified as general green space; hard surface category includes various buildings, squares, city plazas, roads and other pavement areas; agricultural field in the city includes paddy and vegetable plots; water includes rivers, lakes and fish ponds.
Because of the 30-m pixel resolution for a TM remote image, areas greater than 0.09 ha could be identified as patches of urban forest or general green lands. Therefore, the area and occupation proportion for these two categories was less than that of city information data reported officially. Each color element of the satellite images was identified by ArcGIS, which was matched for each land-use category. Following computer analysis, the data set was verified using Google Earth and GPS in field. The accuracy rate determined by computer was 64.5 %, reaching 89.3 % after adjustments.
To detect the urban forest pattern gradient, a series of analyses was conducted along a west-east transect cutting across the entire study area, being the longer axis of the district (Figure 1). The transect was 3 km in width and 25 km in length. Relevant data were computed using a 3 km × 3 km overlapping moving window across the transect from west to east (Wang, Wu, Zhang, & Zhao, 2008); thus, the transect continuously had 12 sample blocks and covered 75 km2 of area using 14.36 % of the entire study area (Mao, Whang, & Pu, 2006). The distance from the western edge of the district for each sample block in the transect is shown in Table 1.
Table 1 The distance from the western edge of the district of Pudong for each sample block in the line transect.
| Ordinal number | 1 | 2 | 3 | 4 | 5 | 6 | 7 | 8 | 9 | 10 | 11 | 12 |
| Distance (km) | 0-3 | 2-5 | 4-7 | 6-9 | 8-11 | 10-13 | 12-15 | 14-17 | 16-19 | 18-21 | 20-23 | 22-25 |
Several selected landscape indices were computed using Fragstats 3.3 (Chen, Xiao, & Li, 2002) to describe the characteristics of landscape patterns for the urban forest. They were: Patch area, number of patches, fractal dimension, landscape shape index, patch cohesion index, Shannon's diversity index, Shannon's evenness index, and density of landscape element patch (Cheng & Kang, 1996; Li & Wu, 2004).
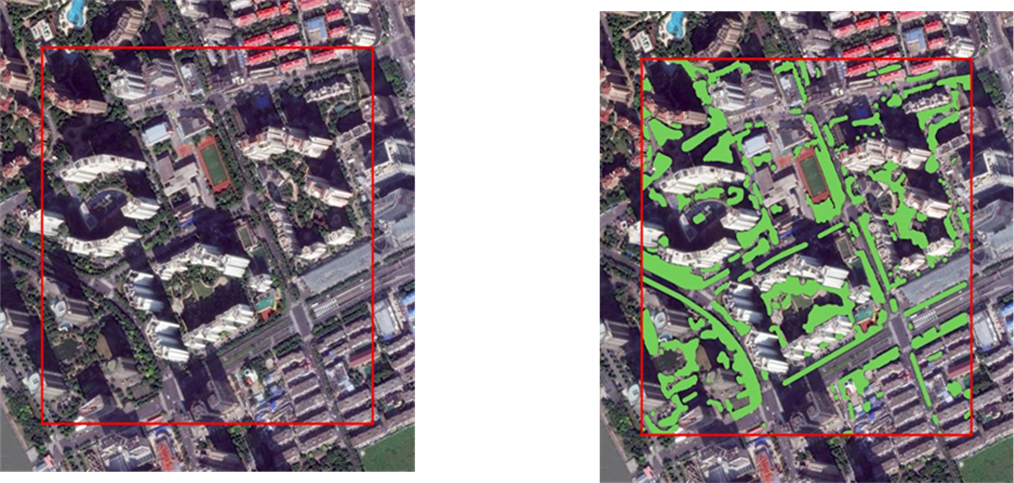
Based on the characteristics of the urban green corridors in the study area, the corridor categories were classified into three classes: Roadside green corridor, riverside green corridor and ring forest strip. The ring forest strip (500~1000 m in width) surrounding the midtown is a special type. For the corridor network structure, a number of indices were computed such as size of mesh, ratio of line to node, circuity, and connectivity (Forman, 2000; Hilty, Lidicker, & Merenlender, 2006). For urban tree canopy coverage (TCC), a sample patch size of 500 m × 500 m was used (Figure 2), and 100 sample boxes were evenly distributed across the study area. Considering the particularity of park and ring forest strip, seven more sample boxes were added and computed, and the TCC of all park areas was determined. Thus, the total sample area comprised about 5.64 % of the entire study area. These sample patches constituted the foundation for the visual interpretation and analysis (Michael, Grove, & O’Neil-Dunne, 2006; Poracsky & Lackner, 2004; Walton, 2008; Walton, Nowak, & Greenfield, 2008).
Results and discussion
General landscape characteristics in Pudong
The results showed that the area of urban forest patches was 2 743.47 ha in the total study area and 1 459.44 ha in the built-up area respectively (Figure 3). General greenspace amounted to 3 758.48 and 2 076.90 ha, totaling 12.2 % and 14.01 % of the land in the whole district and built-up area respectively; likewise, agricultural field 8 220.81 ha and 2 679.62 ha, water 1 972.30 ha and 974.67 ha.

Figure 3 The distribution pattern of urban forest patches (red part) in the Pudong district of Shanghai.
The landscape diversity index is 1.28 and the landscape evenness index is 0.61 in the study area, but 1.22 and 0.58 respectively in the built-up area. Landscape evenness in Pudong was lower and more obvious in the built-up area. This situation is also the normal status for a city in this country.
Urban forest patches
Based on the statistics of the landscape element feature, shown on Table 2, we found that the number of urban forest patches reached up to 2 403 in the whole district area and 1 548 in the built-up area, and the average urban forest patch area was 1.14 ha and 0.94 ha respectively. The shape index was 58.09 and 46.09, and the Patch fractal dimension was 1.48 and 1.48 in the whole and built-up area respectively (Table 2). The patch shapes were found to be more complicated, because in most cases the urban forest patches were in city parks, schoolyards or office building yards, which had more irregular boundaries.
Table 2 Characteristic values of urban forest elements in the Pudong district of Shanghai.
| Catalogs | Study area | Built-up area |
|---|---|---|
| Patch numbers | 2 403 | 1 548 |
| Average patch area (ha) | 1.14 | 0.94 |
| Maxim patch area (ha) | 9.14 | 6.68 |
| Density of landscape element patch | 87.59 | 106.07 |
| Density of landscape patch | 4.51 | 6.13 |
| Patch shape index | 58.09 | 46.09 |
| Patch fractal dimension | 1.48 | 1.48 |
| Patch cohesion index | 85.61 | 88.31 |
The distribution gradient of urban forest patches from west to east
The urban forest element in each sample block in the transect was measured based on area occupation and patch number. Figure 4 shows the graphical representation of these variables. The number of patches increased from the first sample block (commercial center) on the transect and reached its peak in the fourth block, which was found 8 km from the commercial center. Subsequently, the number of patches decreased as the distance increased; from the fifth to the twelfth sample block, urban forest patches were less than 80. The results showed that the area of urban forest patches (% of the total landscape area) increased slightly from the commercial center (the first sample block in the transect) to the edge of the urbanized area, reaching a maximum in block 7, located 12 to 15 km from the commercial center, later the area decreased with increasing distance.

Characteristics of city corridors
The major types of corridors in the Pudong district were identified as roads, rivers and green patches (Figure 5). There were a total of 1 218 corridors, 3 255.41 km in length, 140.05 km2 in area, and 6.11 km·km-2 in density. These included: 547 road corridors, 1 494.7 km in length, 9.24 km2 in area and 2.81 km·km-2in density; 179 river corridors, 700.5 km in length, 20.54 km2 in area and 1.31 km·km-2 in density; 492 greening corridors, 1 060.21 km in length, 80.27 km2 in area and 1.99 km·km-2 in density).
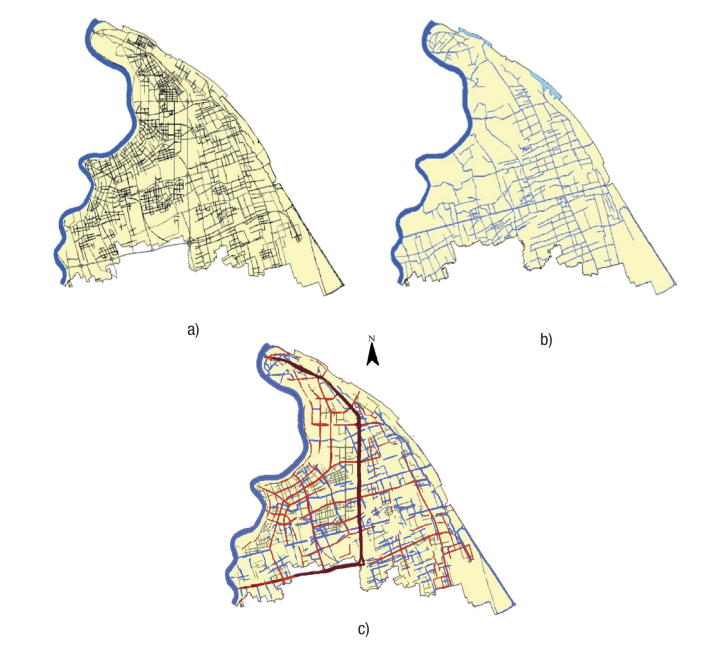
Figure 5 Corridors in the Pudong district of Shanghai: a) road system; b) river and stream; c) green corridors ( roadside green corridor,
  riverside green corridor,
  ring forest strip).
Table 3 shows the characteristics of the green corridors found in the Pudong district. A total of 318 roadside green corridors were identified based on Spot image interpretation, totaling 685.39 km in length and 35.87 km2 in area; they accounted for 64.64 % of the total number of green corridors, 64.65 % of total length and 44.69 % of total area. Corridor width ranged from 9 m to 122 m, and the density was 1.29 km·km-2. Roadside green corridors were classified into two subtypes: main road and secondary road. Both were about the same in length, but the former covers more area.
Table 3 The green corridors in the Pudong district of Shanghai.
| Green corridor types | Density (km·km-2) | Corridor number | Corridor length | Corridor area | |||
|---|---|---|---|---|---|---|---|
| Numbers | Proportion (%) | Length (km) | Proportion (%) | Area (km2) | Proportion (%) | ||
| I Total Road-side green corridor | 1.29 | 318 | 64.64 | 685.39 | 64.65 | 35.87 | 44.69 |
| Main-roadside green corridor | 0.60 | 98 | 19.92 | 321.72 | 30.35 | 26.75 | 33.33 |
| Second-roadside green corridor | 0.68 | 220 | 44.72 | 363.67 | 34.30 | 9.12 | 11.36 |
| II River side green corridor | 0.61 | 173 | 35.16 | 323.82 | 30.54 | 11.97 | 14.91 |
| III Ring forest strip | 0.10 | 1 | 0.20 | 51 | 4.81 | 32.43 | 40.40 |
| Total | 1.99 | 492 | 1 060.21 | 80.27 | |||
A total of 173 riverside green corridors were found, totaling 323.84 km in length, 11.97 km2 in area, and 0.61 km·km-2 in density; they accounted for 35.16 % of the total number of green corridors, 30.54 % of total length and 14.91 % of total area. Corridor width ranged from 6 m to 33 m, and averaged 20 m.
As an important green engineering project, the ring forest strip built in the 1990’s is an open green space surrounding the whole built-up area of Shanghai city, which extended 51 km in length and covered 32.43 km2 of the area in the Pudong district, and ranged from 500 m to 635 m in width (Cheng & Kang, 1996). Even though the strip occupied only 4.81 % of the total length of the green corridor, it contributed 40.40 % of the total green corridor area and almost equaled the whole area of the roadside green corridor (Table 3).
Green network structure
The structural characteristics of the green network such as linkage, connectivity, node and attached node and circuitry were shown in this paper. In the entire study area, the ratio of line to node for the total green corridor was 1.30, and 1.16 for the roadside green corridor and 1.13 for the river- and streamside green corridor. The lower ratio of line to node indicated that the network structure was not complicated, so its conduit functions, such as for energy flow or small mammal activities, were lower. The vegetation corridor is the most important ecological corridor in a city environment, and the higher the linkage a network has, the more complex and higher the ecological functions will be. Following the structural analysis of the green network in the study area, there is a need to increase linkage to improve its structure (Table 4).
Table 4 Green network structure in the Pudong District of Shanghai.
| Green corridor type | Numbers of non-connected lines | Numbers of connective lines | Node numbers | Ratio of line to node | Circuitry | Connectivity |
|---|---|---|---|---|---|---|
| I Roadside green corridor | 23 | 295 | 249 | 1.166 | 0.21 | 0.504 |
| Main-road green corridor | 13 | 85 | 70 | 1.214 | 0.373 | 0.644 |
| Second-road green corridor | 27 | 193 | 179 | 1.078 | 0.184 | 0.515 |
| II River green corridor | 21 | 152 | 134 | 1.134 | 0.239 | 0.551 |
| III Ring forest strip | 0 | 1 | 1 | 1.000 | 0.000 | 0.333 |
| Total | 17 | 476 | 384 | 1.301 | 0.196 | 0.478 |
The connectivity of the whole green network was 0.47, with the river corridor ranking first followed by the roadside corridor and ring forest strip, having values of 0.55, 0.50 and 0.33 respectively. The circuitry of the network was as low as 0.19; this was mainly because there was a lack of connectivity for different green corridors, lower corridor connectivity and more breaks (gaps). Both network connectivity and circuitry are the most immediate level of network structure, because they have great relevance to functions involving the flows of water, mineral nutrients, and species.
Node and mesh of the green network
In total, 384 nodes were identified in the green network, 249 in the roadside green corridor and 134 in the river- or streamside corridor. In most cases, a single node of these two types covered a smaller area, but the nodes located under the highway overpass were larger. Most of these kinds of nodes were designed as a small garden or recreation plot and became the location for city dwellers to have social activities.
The mesh size of the green network ranged from 0.06 km2 to 2.05 km2, and averaged 0.70 km2. Mesh scale has great relevance to habitats for small city mammals and birds. It is essentially the inverse of corridor density. The greater the corridor density, the smaller the mesh size and the lower the landscape resistance for some small animals and birds (Forman, 1995). Therefore, smaller size meshes in the green network are of advantage to the movement and emigration of wildlife around the city landscape.
In total, 87 attached nodes were identified along the corridors in the study area, including parks, larger green lands, wooded patches and nursery stock. The total attached nodes covered an area of 20.88 km2. A total of 52 nodes with an area of 15.50 km2 were attached to the roadside green corridor, and 35 nodes with a total area of 5.38 km2 were attached to the riverside green corridor (Table 5).
Table 5 The attached green node along wooded corridors in the Pudong district of Shanghai.
| Type of attached node | Total number | Maxim area (km2) | Minim area (km2) | Total area (km2) | Area occupation of total attached node (%) |
|---|---|---|---|---|---|
| Attached to Roadside green corridor | 52 | 1.44 | 0.04 | 15.50 | 74.23 |
| Attached to Riverside green corridor | 35 | 0.49 | 0.02 | 5.38 | 25.77 |
| Total | 87 | 20.88 |
The area of nodes attached to roadside green corridors ranged from 0.04 km2 to 1.44 km2, and averaged 0.30 km2. The area attached to the riverside green corridors ranged from 0.02 km2 to 0.49 km2 and averaged 0.15 km2. Some large size attached nodes were forest parks, city parks and green lands; thus, the wooded corridors combined with attached nodes were the distinguishing feature of the city green system of Pudong.
Tree canopy coverage
Based on statistics derived from the sample data, there were 3 743.15 ha of total tree canopy area in the district, providing 7.02 % coverage. TCC varied by land usage, with the ring forest strip ranking first (43.43 %) followed by park (40.3 %), road (12.68 %), neighborhood councils (6.90 %), other lands (5.37 %), agricultural field (3.04 %), industrial land (2.28 %), and commercial center (1.01 %). The ring forest strip with only 6.10 % of land area contributed about 37.6 % of tree canopy area, parks with 0.60 % of land area contributed about 3.56 % of tree canopy, and street trees and roadside woods with 5.33 % of land area contributed 9.62 % of tree canopy. By contrast, industrial land accounted for 16.4 % of the whole area but contributed only 5.30 % of tree canopy.
There were a total of 2 591.98 ha of tree canopy area in the built-up area and TCC was 10.27 %. TCC also varied due to land usage, with ring forest strip ranking first followed by park (34.01 %), road (13.11 %), neighborhood councils (7.52 %), other land (4.58 %), industrial land (2.7 %), agricultural field (1.51 %), and commercial center (1.01 %). Except for park, ring forest strip and roadside trees, all other land-use categories had a lower TCC contribution compared to their land possession rate.
The Pudong district had 17 parks in total, covering a 330.32 ha area; park size ranged from 1.84 ha to 140.39 ha, and their TCC varied from 16.49 % to 51.11 %; only seven parks had more than 40 % TCC.
The land area of neighborhood councils was 24.48 % in the built-up area. Therefore, more tree shading would be achieved by planting more trees. However, the present study estimated that the TCC in neighborhood councils in the built-up area ranged from 3.92 % ~ 14.21 %, and the average was as low as 7.52 %. This is much lower than that of park land and the average level in the built-up area of the studied city. It is also far lower than the level in other cities, such as Washington, D.C., where the existing TCC occupies 16 % of moderate-density residential parcels, and 11 % of medium -and high- density residential parcels (O’Neil-Dunne, 2009). It was concluded that there were fewer trees, particularly big trees. If more trees are planted in neighborhood council green space, then TCC can reach from 30 % to 50 %, thus neighborhood TCC could be increased by 9 %~15 % and would result in more tree shading. Similarly, if tree plantings are increased in the whole built-up area, then the TCC could reach 12.3 %, which is a 2 % increase at least.
Using the method of total tree canopy area and average tree canopy area (Michael et al., 2006), the total number of the existing trees in the study area was estimated in this paper. It is reported that the average diameter of city tree crown is 3.6 m in China (Wu, Xiao, & McPherson, 2008; Xuan, Hu, Wu, & Zhu, 2010). It is apparent that there were about 3.68 million trees in the whole district and 2.55 million in the built-up area. It is possible to plant 300 000~500 000 trees at least in the built-up area and 870 000 ~ 1 450 000 trees in the entire district to achieve the target TCC as characterized above. On the basis of the above estimation, the tree stocking density could be 127 individuals·ha-1 in the built-up area.
In this paper, Spot Image and Google Earth were employed for corridor identification; in some cases, corridor width was the tree canopy extension, which does not present the real situation on the land surface. On the other hand, this paper described and discussed the green corridor from a vulture’s view only. Meanwhile, the resolution of the TM images used to identify the urban forest patches is not high enough, and, as a result, patches smaller than 900 m2 are missed. To avoid this, higher-resolution remote sensing images are needed.
Although Google Earth is not very accurate in terms of area in a geographic context, the fact that canopy cover is expressed as a percentage of area makes it a spatially-standardized measure. This means that the difference between raw area sizes is not an issue when making comparisons between different areas, and the differences in the sizes of the two places is not a concern (Poracsky & Lackner, 2004). Therefore, using Google Earth for TCC estimation is feasible, which cannot only result in higher pixel resolutions, but also reduced project spending.
Since the spatial pattern, width, and vegetation structure of forested corridors are linked to their intended functions, their establishment must be conducted with care (Smith & Helmmund, 1993; Zhu, Yu, & Li, 2005). Funds for their long-term ecological study must also be budgeted to measure the effectiveness of these corridors for their intended purposes in case design modifications are needed in the future.
In general, the TCC in Pudong is lower compared to some other cities in China, but if we consider the actual situation of Shanghai as a metropolis with a big population and limited land, this is an acceptable level for today. However, a higher TCC percentage is required for human health, so a more comprehensive city development plan that pays greater attention to environmental quality is needed in the future.
Conclusions
The green network has been constructed, but it was not well designed. It is considered necessary to improve the structure of the green network by increasing corridor width, thereby enhancing network circuitry and connectivity. For the entire built-up area, the existing trees cannot produce a distinct forest environment as an urban forest should do because of the low tree canopy coverage and lower stocking density (127 individuals·ha-1), particularly in residential areas which need more shade from trees. Our research showed that there is still some permeable land remaining and planting more trees is feasible. If more trees are planted in parts of the permeable lands in the built-up area, then the tree canopy coverage could increase to 12.3 %. Similarly, the coverage in parks is also as low as 40.3 %; it is concluded that the target tree canopy coverage of 51 % in parks could also be achieved by additional tree planting.

