


 text in
  English (pdf)
 Article in xml format
 Article references
 Send this article by e-mail
 Cited by SciELO
  Similars in
SciELO
Similars in
SciELO 
 Permalink
Introduction
Silviculture and forest management incorporate scientific tools on an ongoing basis to improve precision in the design of management prescriptions, the projection of expected products and the dynamics of forest ecosystems. The importance of biometric systems lies in the integration of statistical-mathematical models, dynamic or static, for rational and sustainable forest management. These models are the analytical tools most commonly used for the generation of knowledge about growth and yield of forest stands. Some of the main uses are: 1) make or update forest inventories; 2) evaluate silvicultural schemes; 3) estimate the current and future yield of forest products; 4) examine the impacts of forest management on other forest values; 5) determine management regimes that maximize the timber volume or production value; and 6) determine the influence of disturbances on forest dynamics (Weiskittel, Hann, Kershaw, & Vanclay, 2011).
A biometric system is a portfolio of equations through which reliable information on the growing stock, product distribution, site quality, yield and growth of trees and stands in a wide variety of management conditions is obtained. The use and refinement of these systems have increased over the last two decades, due in part to the greater capacity of computer systems to analyze large databases, as well as to simulate forest dynamics.
The first forest growth models, called "normal yield tables," were constructed in Germany at the end of the eighteenth century (Assmann, 1970) for fully stocked natural stands (Davis, Johnson, Bettinger, & Howard, 2001). The volume equations, represented in the form of "volume tables," have been used since then. Spurr (1952) notes that their origin dates back more than 150 years and that Henrich Cotta receives the credit for having produced the first modern volume table in 1804. The techniques used by Cotta spread widely in the late nineteenth and early 20th centuries in several European countries; since then they have progressively evolved into the most modern and complex growth simulators based on individual tree models.
The publication of forest growth models in Mexico began in 1970, mainly in theses and scientific journals, where the first production tables and growth systems based on stand models were presented. Subsequently, in the 1990s the development of equation systems to estimate merchantable volume at individual-tree level began.
The evaluation of forest productivity through dominant height growth is one of the most documented topics in the forest literature in Mexico; since the 1980s, a great deal of work has been published on the subject. The variety of techniques that have emerged has led to the study of site index curves being a topic of interest and debate among the world’s forest biometricians in the world (Cieszewski & Strub, 2008).
Another topic extensively researched concerns standing tree volume models. This research area is highlighted by the works of Corral, Návar, and Fernández (1999), Vargas-Larreta (2006); Corral-Rivas, Barrio-Anta, Aguirre-Calderón, and Diéguez-Aranda (2007), and Cruz-Cobos, De los Santos-Posadas, and Valdez-Lazalde (2008) in Durango; Pompa-García, Corral-Rivas, Hernández-Díaz, and Álvarez-González (2009) in Chihuahua, and Hernández-Pérez, De los Santos-Posadas, Ángeles-Pérez, Valdez-Lazalde, and Volke-Haller (2013) in Hidalgo. All systems cited in these studies allow predicting total and merchantable volume. Studies related to the subject have also been carried out in other states, although focused only on total volume (Aguilar & Velarde, 2001; Muñoz-Flores et al., 2012); similarly, during the period 2004-2009, INIFAP (Instituto Nacional de Investigaciones Forestales, Agrícolas y Pecuarias) generated diverse technologies and similar tools for the forestry sector.
Current biometric systems should include volume models developed and validated by species and for regional use. Vargas-Larreta, Cruz-Cobos, and Corral-Rivas (2008) analyzed the precision in the estimation of growing stocks by stand of some forest areas under management in Durango. These authors concluded that in practice a single volume equation (developed more than 40 years ago) was used, regardless of the species, site or forest region, without having verified the precision and validity of use, not only in the forests of Durango, but also in other states.
The objective of this paper is to present the Forest Biometric System (SiBiFor), consisting of a database of more than 6 000 new volume, product distribution, site index and diameter at breast height growth equations of 97 temperate and tropical forest tree species. SiBiFor is the result of research conducted by a consortium of Mexican institutions of higher education and research. The equations that make up the system will allow for better management of the country's forest ecosystems, which will contribute to their sustainability.
Materials and methods
The methodology used generated a system of equations for estimating individual-tree attributes (bole, branch, total and commercial volume) that are additives between components; that is, component-level attributes of individual trees that are scalable at total-tree level and consistent across the country's different forest conditions. Moreover, the methodology ensures the compatibility and comparison of regional and state-level information, facilitating the temporal and spatial analysis of the variables of interest.
Study area
The study area included the states of Chihuahua, Guerrero, Jalisco, Oaxaca, Michoacán, Puebla, State of Mexico, Hidalgo, Tlaxcala, Veracruz and Quintana Roo (Figure 1). The first nine, in addition to Durango, account for 90 % of the country's timber production (5.94 million m3) (Secretaría de Medio Ambiente y Recursos Naturales [SEMARNAT], 2015) and they are included in the National Sustainable Forest Management Strategy for Increased Production and Productivity (ENAIPROS for its initials in Spanish) of the National Forestry Commission (CONAFOR for its initials in Spanish).

Data collection
Sampling was conducted by regions, considering as such the Regional Forest Management Units (RFMUs) defined by CONAFOR. Field data were obtained by destructive sampling by taking advantage of the harvest areas of the forest stands. The following variables were measured: diameter at breast height (dbh) outside and inside bark (d in cm), total height (h in m), diameter outside and inside bark (d i in cm) for each section at the height that was found relative to the ground (h i in cm), and diameter outside and inside bark of all the branches whose diameter at the base was greater than 5 cm. Two 0.30-m sections above the stump were obtained; the next section corresponded to the dbh (1.30 m) and it was followed by 2.54-m-long (or another commercial size depending on the region or state) sections until reaching the tip of the tree (Figure 2).

Figure 2 Graphical representation of the data collection in the different sections and branches of a sample tree.
The dominant height-age data pairs were obtained following the stem analysis methodology. For this purpose, wood discs were extracted from 20 % of the dominant and codominant pine trees and other conifers of the sample used in order to construct volume models.
In the states with species of high conservation value, restricted distribution or little abundance, a combination of the destructive and non-destructive methods was used. The former was exclusively used in species that were within the harvest areas and that had reached the minimum cutting diameter (variable depending on the species). The non-destructive method was used for smaller diameters and consisted of measuring the bole and branches of standing trees using high-precision forestry measurement equipment (CriterionTM RD1000 electronic dendrometer, USA, and Mantax Black caliper with Häflog gator eyes laser pointers, Sweden).
Calculation of volume
The tree volume calculation was done in sections using the Smalian´s formula; the volume tip was obtained like a cone. The total stem volume with bark was obtained from the sum of the volumes of the sections and the tip. The volume of the branches was calculated following the same procedure. The total tree volume (ttv in m3) was estimated by adding the total volume of the stem and branches. The merchantable volume (v i in m3) at a given top diameter (d i), the relative diameter (reld = d i/d) and the relative height (relh = h i/h) of the stem were also calculated. Finally, to detect possible outliers, a nonparametric quadratic local fit was made using LOESS local regression (Bi, 2000) with the SAS/STATT 9.2 statistical package (Statistical Analysis System [SAS] Institute, 2008).
Volume models for the development of additive equation systems
The stem volume and total volume (including branches) were estimated by the fit, in a first phase, of six volume functions of one variable and 10 of two variables. In all cases, the volume equations of two predictors were higher, so they were selected for subsequent analyses (Table 1).
Table 1 Volume models of two predictors fitted and selected for the development of additive equation systems.
| Model | Name | Expression |
|---|---|---|
| 1 | Schumacher-Hall (allometric) |
v=b0db1hb2
|
| 2 | Spurr |
v=b0d2h
|
| 3 | Spurr potential |
v=b0 (dh)b1
|
| 4 | Spurr with independent term |
v=b0+b1d2h
|
| 5 | Incomplete generalized combined variable |
v=b0+b1h+b2d2h
|
| 6 | Australian formula |
v=b0+b1d2+b2d2h+b3h
|
| 7 | Honer |
v=d2/b0+b1/h
|
| 8 | Newnham |
v=b0+b1db2hb3
|
v = volume, d = dbh with bark, h = total height, b i = coefficients.
Once the best model for stem volume and total volume was selected, a system of additive equations was simultaneously fitted to estimate the volume of branches with bark (vbr wb ), stem with bark (tsv wb ) and total tree with bark (ttv wb ):
tsvwb=b0db1hb2
vbrwb=b3d2
ttvwb=b0db1hb2+b3d2
In cases where convergence was not achieved in the equation system above, the branch volume equation was changed by:
vbrwb=e(-b3db4)
ttvwb=b0db1hb2+e(-b3db4)
Compatible volume-taper functions
The model of Biging (1984) was fitted: di={d b1+b2ln[1-(1-e-b1/b2)q1/m]} , where m must be a value that allows analytical integration of the equation. The model of Fang, Borders, and Bailey (2000) was also fitted:
di=c1√h(k-b1)/b1(1-q)(k-β)/β αI1+I21αI22
c1=√a0da1ha2-k/b1b1(r0-r1)+b2(r1-α1r2)+b3α1r2;
β =b1-(I1+I2)1bI12bI23;α1=(1-p1)(b2-b1)kb1b2; α2=(1bp2)(b3-b2)kb2b3;
r0= (1-hst/h)k/b1;r1=(1-p1)k/b1;r2=(1-p2)k/b2
I1= 1 ifp1≤ q ≤p2; 0 otherwise
I2= 1 ifp2≤ q ≤ 1; 0 otherwise
where,
p1 and p2 = h1/h and h2/h, respectively, are the relative heights where the two junction points assumed by the model occur.
q = hi/h
k = π/40 000.
The model of Fang et al. (2000) also includes a merchantable volume equation (v i) and a total volume equation (V) by directly integrating the profile function. Their expressions are as follows:
vi=c21hk/b1b1r0+(I1+I2)(b2-b1)r1+I2(b3-b2)α1r2-β(1-q)k/βαI1+I21αI22
V=a0da1ha2
Compatible dominant height-site index models
The development of the site quality curves was based on the algebraic difference approach (ADA) and on the generalization of this method known as generalized algebraic difference approach (GADA) (Cieszewski & Bailey, 2000). After a first fit, the equations of the models of Bertalanffy-Richards (Bertalanffy, 1949, 1957; Richards, 1959) and of Korf (Lundqvist, 1957) in GADA form, shown in Table 2, as well as the polymorphic model of Korf in ADA form, were selected for later comparisons. The form of the latter is as follows:
Y=b1(H0b1)t0t1b2
Table 2 Fitted base models and their corresponding GADA formulation (equations in generalized algebraic differences form), for the development of site quality curves.
| Model | Base equation | Site-related parameters | Solution for X with initial values (t 0 , Y 0 ) | Dynamic equation |
|---|---|---|---|---|
| G1 |
Korf:
Y=a1e-a2t-a3
|
a1=eX a2=(b1+b2)/X |
X0=12t0-b3{b1+t0-b3ln(Y0)+√4b2t0-b3+[-b1-t0-b3ln(Y0)]2}
|
Y =eX0e[-(b1+b2X0)tb3]
|
| G2 |
Bertalanffy-Richards:
Y =a1[1-e-a2t]a3
|
a1=eX a3=b2+b3/X |
X0=12[lnY0-b2L0+√(lnY0-b2L0)2-4b3L0]
where,
L0= ln(1-e-b1t0)
|
Y =Y0[1-e-b1t1-e-b1t0]b2+b3/X0
|
Y: dominant height (m), t i: reference or base age (years), a i: parameters in the base equation, b i: global parameters in the dynamic equation.
Diameter growth models
The diameter growth models were fitted using the base model of Bertalanffy-Richards (Bertalanffy, 1949, 1957; Richards, 1959) in ADA form with three variants (Table 3) and following the guide curve methodology.
Table 3 Diameter growth models fitted in algebraic differences form.
| Model | Name | Type | Expression |
|---|---|---|---|
| D1 | Bertalanffy-Richards | Anamorphic |
d =d0(1-exp-b1t11-exp-b1t0)b2
|
| D2 | Bertalanffy-Richards | Polymorphic I |
d=b0{1-[1-(d0B0)1b2]t1t0}b2
|
| D3 | Bertalanffy-Richards | Polymorphic II |
d =b0(d0b0)(ln(1-exp-b1t1ln (1-exp-b1t0)
|
D: diameter at breast height (cm), t: age (years), b 0: parameter representing the horizontal asymptote, b 1: growth rate and b 2: change rate.
In the above expressions, d 0 was fitted as a diameter index (IDiam), and the reference or base age t 0 was set from 50 to 90 years, according to the growth pattern of each species; finally, in the fit the values d 0 and the parameter estimators were obtained.
Fitting procedure and selection criteria for the best model
The fitting of compatible volume estimation systems usually involves some statistical assumptions that must be fulfilled, one of the most important being to ensure the additivity. This property is that the sum of the estimates of the volumes of all tree fractions (branches and stem) must be equal to the volume estimated directly from the total volume equation. In order to achieve this, the volume-by-component and total-volume equations were fitted simultaneously using the ITerated Seemingly Unrelated Regression (ITSUR) method by the SAS/ETS® MODEL procedure.
The heteroskedasticity problem was corrected using weighted regression, with a weight equal to the inverse of the variance of each observation. The weights considered were 1/d 2 for the branch volume equation and 1/d 2 h for the total stem volume with bark equation. In the case of the diameter growth equations, heteroscedasticity was corrected using a power model whose expression is Resid.d=Resid.d/(Pred.d0.1)0.5 where 0.1 represents the model parameter.
Profile functions are developed with multiple observations along the stem in each tree. Therefore, such observations are expected to be spatially correlated, which violates the principle of independence of errors. The autocorrelation problem, when it existed, was solved by using generalized nonlinear least squares and expanding the error term by an order-2 continuous autoregressive model [CAR(2)]. The expression of the error structure in the autoregressive model is as follows:
eij=∑k=xk=1lkρhij-hij-kkeij-k+εij
where:
e ij |
j-th ordinary residual of the i-th tree |
e ij-k |
j-th ordinary residual of the i-kth tree |
l k |
1 for j > k and 0 for j ≤ k |
ρ k |
k-order autoregressive parameter to be estimated |
h ij-h ij-k |
distance separating the jth-kth observation within each tree, h ij > h ij-k , with ɛ ij being the error term under the condition of independence. |
The error structure expressed in the above equation was fitted simultaneously with the structure of the mean of each of the profile equations using the SAS/ETS© statistical software’s MODEL procedure, which allows a dynamic updating of the residuals.
Results and discussion
Developed Equations
A total of 6 414 equations were generated: 2 917 of volume (740 of total stem volume with bark [tsv wb ], 700 of total stem volume without bark [tsv nb ], 740 of branch volume with bark [vbr wb ] and 737 of total tree volume with bark [ttv wb ]); 2 868 of taper-volume (737 taper equations outside bark [di wb ], 697 taper equations inside bark [di nb ], 737 of merchantable volume with bark [vi wb ] and 697 of merchantable volume without bark [vi nb ]); 341 of site index (SI); and 288 of diameter growth (ΔD) (Table 4).
Table 4 Number and type of equations developed by state.
| State | Volume equation | Taper-volume | SI | ΔD | Total | ||||||
|---|---|---|---|---|---|---|---|---|---|---|---|
| tsv wb | tsv nb | vbr wb | ttv wb | di wb | di nb | vi wb | vi nb | ||||
| Chihuahua | 86 | 86 | 86 | 86 | 86 | 86 | 86 | 86 | 43 | 43 | 774 |
| State of Mexico | 60 | 60 | 60 | 60 | 60 | 60 | 60 | 60 | 27 | 20 | 527 |
| Guerrero | 80 | 80 | 80 | 80 | 80 | 80 | 80 | 80 | 39 | 39 | 718 |
| Hidalgo | 40 | 40 | 40 | 40 | 40 | 40 | 40 | 40 | 13 | 11 | 344 |
| Jalisco | 102 | 102 | 102 | 99 | 99 | 99 | 99 | 99 | 29 | 29 | 859 |
| Michoacán | 63 | 63 | 63 | 63 | 63 | 63 | 63 | 63 | 42 | 42 | 588 |
| Oaxaca | 151 | 151 | 151 | 151 | 151 | 151 | 151 | 151 | 83 | 72 | 1 363 |
| Puebla | 50 | 50 | 50 | 50 | 50 | 50 | 50 | 50 | 33 | -- | 433 |
| Quintana Roo | 40 | -- | 40 | 40 | 40 | -- | 40 | -- | -- | -- | 200 |
| Tlaxcala | 32 | 32 | 32 | 32 | 32 | 32 | 32 | 32 | 12 | 12 | 280 |
| Veracruz | 36 | 36 | 36 | 36 | 36 | 36 | 36 | 36 | 20 | 20 | 328 |
| 740 | 700 | 740 | 737 | 737 | 697 | 737 | 697 | 341 | 288 | 6 414 | |
tsv wb : total stem volume with bark, tsv nb : total stem volume without bark, vbr wb : branch volume with bark, ttv wb : total tree volume with bark, di wb : taper with bark, di nb : taper without bark, vi wb : merchantable volume with bark, vi nb : merchantable volume without bark, SI: site index, ΔD: diameter growth.
Of the total number of equations, 5 819 are specific to species level per RFMU, 324 to species level per state and 271 to genus level (eight state level and 263 at RFMU level). Of the 271 equations at genus level (Pinus, Quercus and Arbutus), 164 are of volume, 100 of volume-taper and seven of site index. The distribution of state equations at species level was as follows: 144 volume equations, 152 taper-volume, 26 site index and two diameter growth equations. The entities for which state-level equations were generated, at genus and species level, were Oaxaca (373), Jalisco (208) and Puebla (14).
Equations were developed for 97 species (records per state can be viewed at http://conafor.gob.mx/sibifor/inicio.php). Pinus pseudostrobus Lindl. was the species with the greatest presence, being found in 34 of the 58 RFMUs considered in the study, located in nine of the 11 states, followed by P. oocarpa Schiede and P. teocote Schiede ex Schltdl. with records in 31 and 27 RFMUs in seven and nine states, respectively. Pinus caribea var. hondurensis Barret & Golfari and P. greggii Engelm. were recorded in only one RFMU. Regarding oak species, the most common were Quercus laurina Humb. et Bonpl. and Q. crassifolia Humb. with records in 30 and 27 RFMUs, respectively, both in eight states, and Q. rugosa Née in 26 RFMUs of nine states. Quercus dysophylla Benth. and Q. eduardii Trel. were the oak species with the least presence (one record).
Types of equations
Volume equations
The volume equations (2 917) were formed by a system of additive equations to estimate tsv wb , vbr wb and ttv wb . The equation to estimate tsv wb corresponded in all cases (all species in all states) to the model of Schumacher and Hall (1933). The tsv wb is the wood volume of the bole plus the bark thereof, for a tree with a dbh not less than 7.5 cm; the vbr wb considers the volume with bark of all branches greater than 5 cm at the base, of a tree with a dbh not less than 7.5 cm and the ttv wb is the sum of the previous volumes. As an example of use, the following is proposed: P. pseudostrobus, UMAFOR 1510, State of Mexico (d = 35 cm, h = 23 m). The graphical representation of the results is illustrated in Figure 3.
vrttwb=0.0000814∙d1.82170878∙h0.9392944=1.006 m3
vbrwb=0.0000381∙d2=0.047 m3
vttb=(0.0000814∙d1.82170878∙h0.9392944)+0.0000381∙d2=1.053 m3
To estimate the tsv nb , the equation is as follows:
tsvnb=(b0db1hb2)δ1
where δ1 is the parameter obtained in the fitting of the merchantable volume equation of Fang et al. (2000), which converts the volume of the stem with bark to volume without bark:
tsvnb=(0.0000814∙d1.82170878∙h0.9392944)∙0.775239=0.78 m3

Figure 3 Total stem volume with bark curves (tsv wb ), total tree volume with bark (ttv wb ) and total stem volume without bark (tsv nb ) predicted with the equations developed for Pinus pseudostrobus in RFMU 1510 of the State of Mexico, overlapping the observed values of ttv wb and tsv nb .
Compatible volume-taper volume equations
A total of 2 868 compatible taper-volume equations were developed. The equation selected for all species was based on the model of Fang et al. (2000).
An example of the final expression of a taper-volume equation is given below, where by the diameter at any height of the stem (d), the merchantable volume (v i ) and the total volume (V) of P. durangensis in RFMU 0801 (Casas Grandes) in Chihuahua are obtained.
di=c1√h(k-0.000008)/0.000008(1-q)(k-β)/βαI1+I21αI22
c1=√0.000044∙d2.052745h0.897032-k/0.0000080.000008(r0-r1)+0.000037(r1-α1r2)+0.000029α1r2;
β =(0.000008)1-(I1+I2)(0.000037)I1(0.000029)I2; ;
α1=(1-p1)(0.000037-0.000008)k0.000008∙0.000037
α2=(1-p2)(0.000029 - 0.000037)k0.000037∙ 0.000029
r0=(1-hst/h)k/0.000008;r1=(1-p1)k/0.000008;r2=(1-p2)k/0.000037
I1= 1 if 0.045209 ≤ q ≤ 0.6399; 0 otherwise
I2= 1 si 0.6399 ≤ q ≤ 1; 0 otherwise
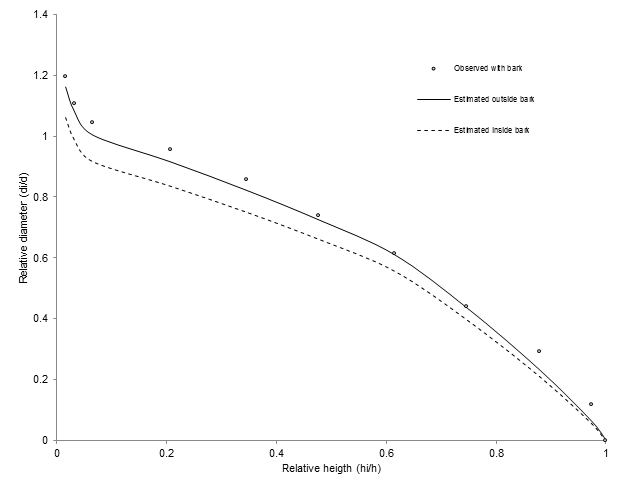
Figure 4 shows the fit of the taper model selected for a tree with a dbh of 45 cm and a height of 20 m.
Compatible dominant height-site index equations
The Bertalanffy-Richards model in GADA form was superior to the rest of the models for most species (301 equations), followed by the GADA form of the Korf model (28 equations) (Lundqvist, 1957) and the Korf polymorphic model (12 equations). The results confirm the flexibility and practicality of the Bertalanffy-Richards base model, as well as the dynamic equation, to fit data from different species or from a single species growing in different ecological regions. The compatible dominant height-site index equation allows calculating:
a) the dominant height H 1 at a given age t 2 from the dominant height H 0 at another age t 1 (H 0 = 13 m, t 1 = 32 years, t 2 = 70 years, H 1 = ?) (blue dot in Figure 5).
H1=13∙⌈1-e-0.035553∙701-e-0.035553∙32⌉-6.29842+26.35435/X=22.3 m
with
X =12{ln(13)+6.29842∙L0+√[-6.29842∙L0-ln(13)]2-4∙26.35435∙L0} ;
L0= ln[1-e(-0.035553∙32)]
b) the site index (SI) from the dominant height H 0 at given age t 1 (H 0 = 7 m, t 1 = 20 years, t ref = 60 years, SI = ?) (red dot Figure 5).
H1= 7∙⌈1-e-0.035553∙601-e-0.035553∙20⌉-6.29842+26.35435/X=19.7 m
with
X =12{ln(7)+6.29842∙L0+√[-6.29842∙L0-ln(7)]2-4∙26.35435∙L0} ;
L0= ln[1-e(-0.035553∙20)]
c) dominant height H 1 at given age t 1 from SI (SI = 14 m, t ref = 60 years, t 2 = 90 years, H 1 = ?) (yellow dot in Figure 5).
H1= 14∙⌈1-e-0.035553∙901-e-0.035553∙60⌉-6.29842+26.35435/X=17.4 m
with
X =12{ln(14)+6.29842∙L0+√[-6.29842∙L0-ln(14)]2-4∙26.35435∙L0} ;
L0= ln[1-e(-0.035553∙60)]

SiBiFor
The Forest Biometric System (SiBiFor) is a digital search platform that contains the results of the research carried out and offers: 1) a database made up of all the equations developed for the most important forest species of Mexico’s temperate and tropical forests; 2) easy access to equations and their metadata (users can perform queries by state, RFMU, species and type of equation); and 3) access the platform’s support manuals and documentation (Figure 6).

The digital platform was developed in the PHP programming language (interpreted programming language), a free software with support to connect to a variety of databases such as MySQL, PostgreSQL, mSQL, Oracle, and to design and layout HTML5 and CSS3 web interfaces, as well as different frameworks that make use of these technologies. The platform can be accessed from any Internet browser such as Microsoft Internet Explorer, Google Chrome, Mozilla Firefox or Safari. SiBiFor can be accessed through the link http://conafor.gob.mx/sibifor. The platform was designed considering the same central structure of AloMéxico, an allometric biomass model database, to allow compatibility with this system and the exchange of information between the two applications.
SiBiFor is a unique web platform for the forest sector in Mexico that offers free, fast access to a national dasometric database with information at species, regional and state level. Forest managers can use it to support their management proposals aimed at achieving the maximum productivity of forest land under use. The platform is also useful in estimating timber stocks and the production capacity of forest raw materials by species and type of product, for the planning and establishment of their supply organization schemes.
Potential SiBiFor users are mainly those involved in the assessment of forest resources, scientists engaged in the modeling, characterization and dynamics of forest ecosystems, forestry technical service providers, students, consultants and project developers (manifestations of environmental impact and land-use changes) and academic forest research institutions. Federal government departments (SEMARNAT, PROFEPA [Federal Environmental Protection Agency] and CONAFOR), responsible for designing national forest policies that require statistical information on the situation of forest ecosystems, also benefit from the system. Additionally, those who coordinate the formulation of action strategies to address global phenomena such as climate change (e.g. the Monitoring, Reporting and Verification (MRV) Group, which coordinates the National REDD+ Strategy), non-governmental organizations, and forestland owners and holders can make use of the platform.
The fact that SiBiFor has been developed under a standardized methodology, at national level, allows users such as CONAFOR’s Forest Monitoring Office to make temporal comparisons between inventories. Users will be able to apply the equations in each state, to make estimates at country level or so that states generate or update their own inventory, in order that the National Forest Inventory is the integration of each one of them.
Conclusions
This paper and the SiBiFor web platform present for the first time a consistent, scientifically-validated database of volume, product distribution, site index and diameter growth equations of the most important species in Mexico’s forests. SiBiFor is an update of the equations that have been applied for more than four decades in most of the country's forest regions. Many of them were developed for forests with little or no silvicultural management, so it is recommended to use the equations contained in SiBiFor in studies related to the estimation of volume, taper, site index or diameter growth in the RFMUs and states considered in this research. The methodology used, including field data collection protocols, is suitable for national application and sufficiently robust and consistent to be used in future studies related to the development or calibration of biometric application systems in the forest sector.

