text in
  English (pdf)
 Article in xml format
 Article references
 Send this article by e-mail
 Cited by SciELO
  Similars in
SciELO
Similars in
SciELO 
 Permalink
Introduction
Understanding and analyzing the factors affecting land-cover change, forest dynamics and spatiotemporal changes of forest ecosystems is an important factor in the management of forest products and services. The number as well as the spatial distributions of land-cover patches or forestations/deforestations throughout the landscape has an important impact on the sustainability of both forest products and services. Control of the spatial configuration of forest-cover types provides the ability to better design and manage forest values based on understanding the spatiotemporal analyses of forest dynamics/land-cover change (Kadıoğulları et al., 2014).
In this context, land-use/land-cover changes have been previously investigated in a number of studies analyzing the factors that influence this change. Land-use/land-cover change (Çakir, Sivrikaya, & Keleş, 2008; Park & Stenstrom, 2008; Şen, Bayramoglu, & Toksoy, 2015; Wakeel, Rao, Maikhuri, & Saxena, 2005; Xu, Yin, & Zhou, 2007), forest dynamics (Kadıoğulları, 2013; Günlü, Kadıoğulları, Keleş, & Başkent, 2009; Köchli & Brang, 2005; Padilla, Vidal, Sanchez, & Pugnaire, 2010), succession (Terzioğlu, Başkent, & Kadıoğulları, 2009; Terzioğlu et al., 2010), spatial changes (Kadıoğulları & Başkent, 2008; Kadıoğulları et al., 2014; Turan et al., 2010; Paudel & Yuan, 2012; Sancar, Turan, & Kadıoğulları, 2009), population growth (Bewket, 2002; Kadıoğulları et al., 2014; Sivrikaya et al., 2007), pasturing (Calvas et al., 2013), urbanization (Dewan, Yamaguchi, & Ziaur, 2012; Turan et al., 2010) and global market forces (Beilin et al., 2014) have all been analyzed. Many data sources such as stand-type maps and satellite images were used in the abovementioned studies; however, the study areas were handled as a whole and only the total change and changes from one class to another were considered. Using patch analyses via indices, fragmentation was also demonstrated in selected classes. On the other hand, there has been no recorded study evaluating the increase or decrease of total forest areas, i. e., living biomass in elevational zones. In other words, changes in relation to elevation have not yet been taken into account. Moreover, the effects on forest areas of settlement zones at varying distances have not been examined either. In addition, forest areas previously analyzed using satellite imagery and stand-type maps have not been re-evaluated with regard to the current forest management plan data. In this context, forest management plans for a 10-year period were completed for the first time in Turkey between 1963 and 1972, and from the beginning of that planning period to the present, forest management plans have been updated every 10 or 20 years. When comparing inventory data for the first term (1963-1972) with the 2012 management plan, a net increase of 1 478,838 ha in forest areas was seen. During this period, the amount of productive forest area increased to 2 702,211 ha (General Directorate of Forestry [GDF], 2012; Kadıoğulları et al., 2014).
This study closes this gap via a large-scale analysis of landscape structure and change using stand-type maps and focusing on elevation classes and distances from settlements in the Gümüşhane forests. The objectives of this research were: to map the distribution of forest dynamics and land-cover change of Gümüşhane Forest Enterprise between 1971 and 2013; to display landscape change and fragmentation over a 42-year period; to describe the documentation of forest improvement/disturbance in all sub-elevation classes; to introduce the effects of distance from settlements on forest improvement/disturbance, and to present and update landscape pattern change under varying management and disturbance regimes with special focus on forest transition.
Materials and methods
Case study area
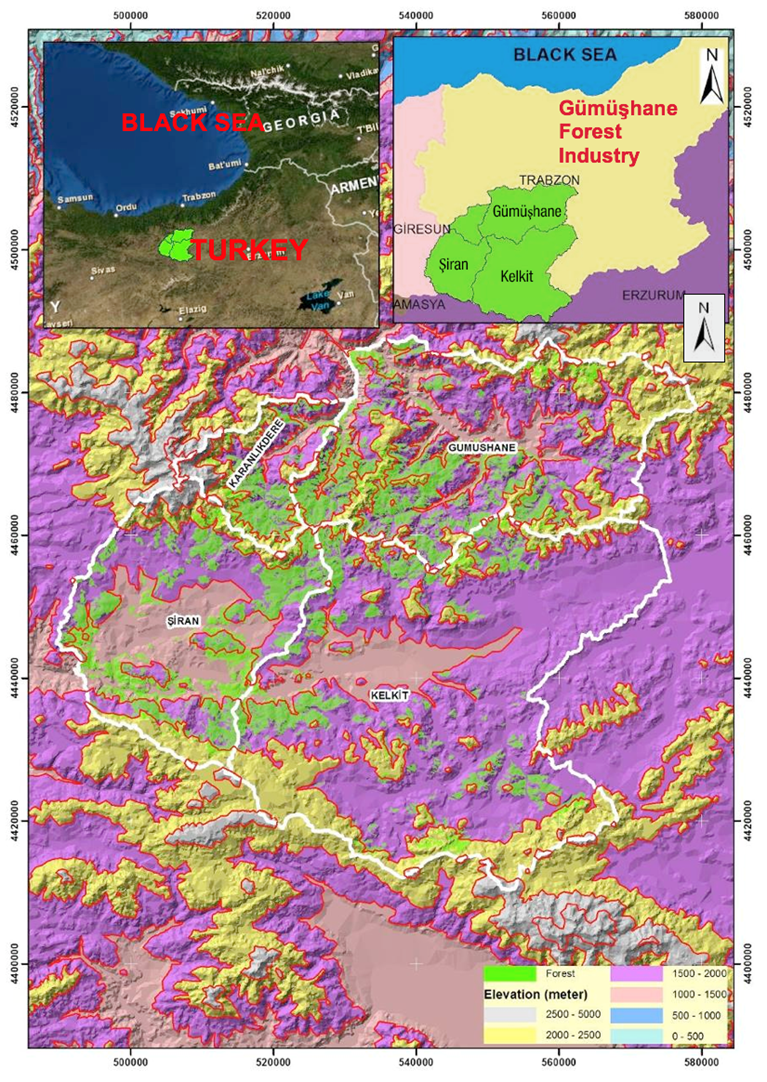
Gümüşhane Forestry Enterprise is located in a typical mountain watershed covering an area of 431,069.7 ha along northeastern Turkey according to the boundaries of the 2013 stand-type maps (Figure 1). The elevation varies between 500 and 3,500 m with an average slope of 18 %. The vegetation includes trees of the species Pinus silvestris L., Abies nordmanniana subsp. nordmanniana, Quercus and Juniperus. Gümüşhane Forestry Enterprise was originally (1971) composed of 13 Forest Planning Units (GDF, 1971) but these were reduced in 1987 and 2013 to the present four Forest Planning Units (Gümüşhane, Karanlıkdere, Şiran, and Kelkit) through various upper-level management decisions (GDF, 1987, 2013; Kadıoğulları & Başkent, 2008). In 1971 and 1987, these forest-management plans were prepared using the neo-classical approach to planning; however, in 2013, they were prepared by the ecosystem-based functional planning technique. The Gümüşhane Forest Enterprise officially covers three mid-level residential areas of Gümüşhane and includes the towns of Kelkit, Şiran and Köse (after 1987). Between 1970 and 2013 the demographic dynamics of Gümüşhane were mostly dominated by the migration of the rural population to urban centers both within and outside of the district (Republic of Turkey State Institute of Statistics [RTSIS], 2013). For example, the rural population of Gumushane Forest Enterprise was reduced by more than half (from 115,420 to 53,863), while the urban population was increased approximately threefold (from 21,808 to 61,838), with a total population reduction of 21,500 (15 %) during the study period (RTSIS, 2013).
An examination of the socio-economic structure of the Gümüşhane area shows the main livelihood of the inhabitants to be derived from agriculture and stockbreeding and the gross national product to be approximately half of the average for Turkey in recent years (RTSIS, 2013).
Database development
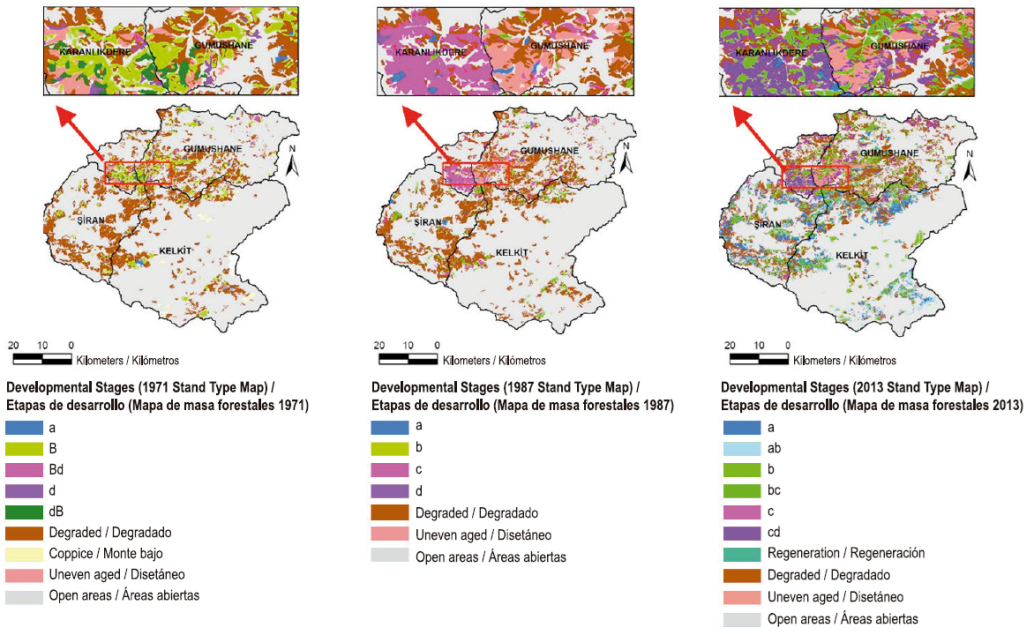
A spatio-temporal analysis of the forest structure was carried out within a systematic process. First of all, the 1971 and 1987 stand-type maps were scanned and then geo-referenced using standard topographical maps. Rectified forest stand-type maps with a 1/3000 screen view scale were digitized. Second, the 2013 stand-type maps produced from IKONOS satellite images were rectified and digitized to create draft stand-type maps which were then corrected using field survey data. The spatial database included stand attributes such as species mix, crown closure and developmental stages (Table 1). Previously generated hard-copy maps were digitized and processed using Arc/Info version 10.0 GIS (Environmental Systems Research Institute [ESRI], 2011) with a maximum root mean square error of under 10 m (Kadıoğulları, 2013). Third, spatial and temporal changes as well as the transition of cover types based on elevation parameters and distance to settlements were analyzed. An elevation map was created by using a digital elevation model (DEM) produced from contour curves (10 m height accuracy). All sub compartments (patches) were grouped into six classes (< 500 m, 501-1,000 m, 1,001-1,500 m, 1,501-2,000 m, 2,001-2,500 m and > 2,500 m) based on the parameter of distance from settlement areas using the “ring buffer” and overlay command in GIS. The other parameter, which relates to elevation, was grouped into six classes (500-1,000 m, 1,001-1,500 m, 1,501-2,000 m, 2,001-2,500 m, 2,501-3,000 m and 3,001-3,500 m). These maps of elevation and distance from settlement areas were overlaid on all stand-type maps and the transitions were then analyzed according to these classes. Lastly, the fragmentation of the areas was evaluated using Patch Analyst tools to complete the analyses (Rempel, Kaukinen, & Carr, 2012).
Table 1 Classification of crown closures and developmental stages.
| Crown Closure Types | Criteria (% cover) | Developmental Stages | Criteria (average diameter at breast height [dbh]) |
|---|---|---|---|
| 0 | Regenerated areas | a (regenerated) | <8 cm |
| Degraded forest | 0-10 % | b (young) | 8-19.9 cm |
| 1 (low coverage) | 11-40 % | c (mature) | 20-35.9 cm |
| 2 (medium coverage) | 41-70 % | d (over-mature) | >36 cm |
| 3 (full coverage) | >71 % | B (young-mature; only 1971 forest plans) | 8-35.9 cm |
Transition of land-cover types according to elevation and distance to settlements
In addition to analyzing the changes in the amount of land- and forest-cover types, the temporal transitions among the cover types were also documented and evaluated to identify the temporal dynamics through various indicative parameters of both composition and configuration of forest resources based on elevation and distance from settlements. The transitions were evaluated by using periodic stand-type maps (1971, 1987 and 2013). The elevation-class maps, distance-from-settlements maps, land-cover types, developmental stages, crown-closure maps and polygon themes for 1971, 1987 and 2013 were overlaid, with each class converted to any of the other classes based on all the parameters, and then computed using GIS overlay commands.
Patch analysis and forestation /deforestation rate
Specifically, the Patch Analyst tool (Rempel at al., 2012) was used to quantify the landscape structure of Gümüşhane State Forests for each of the land-use classes. Patch Analyst calculates the number of spatial metrics for each patch and each land-cover class as well as for the entire landscape. Selected metrics for the land-use class for the landscape in 1971, 1987 and 2013 were analyzed (Kadıoğulları, 2013).
In addition to displaying land-cover change via selected fragmentation indices, the forest improvement or deforestation rate over time was demonstrated for the selected period. Thus, the dynamics of forest improvement/deforestation, critical for the management and conservation of both renewable resources and biodiversity in the landscape were investigated. The average forestation/deforestation rate was computed via the compound-interest-rate method due to its explicit biological meaning (Puyravaud, 2003):
where:
P= |
productive/total forest improvement per year (%) |
A 1 , A 2 = |
amounts of total forest cover or productive forest areas (ha) at time t 1 and t 2 , respectively (Kadıoğulları, 2013; Puyravaud, 2003) |
Results and Discussion
Changes in land-cover types
The digitized stand-type maps obtained from the forest management plans (Figure 2) showed that there was a net increase of 50,910 ha of total forest area within the new study area borders in the latter period (1987-2013). As a result, the productive forest areas were increased by 59,823 ha, while the degraded forest areas were decreased by 7,680 ha (Figure 3). As an overall change between 1987 and 2013, there was a net increase of 23.6 % in the total forested areas (Appendix 1). In this period (1987-2013), cumulative forest improvement was seen in 49 % of the forested area, and in 23.6 % of the total study site of 50,910 ha. This can be calculated as an average improvement rate of 1.58 % annually for the combined degraded and productive forests. As for the first period (1971-1987), total forest areas decreased by 2,436 ha and productive forest areas decreased by 2,574 ha, while degraded forest areas increased by 138 ha (Figure 3) (Kadıoğulları & Başkent, 2008).
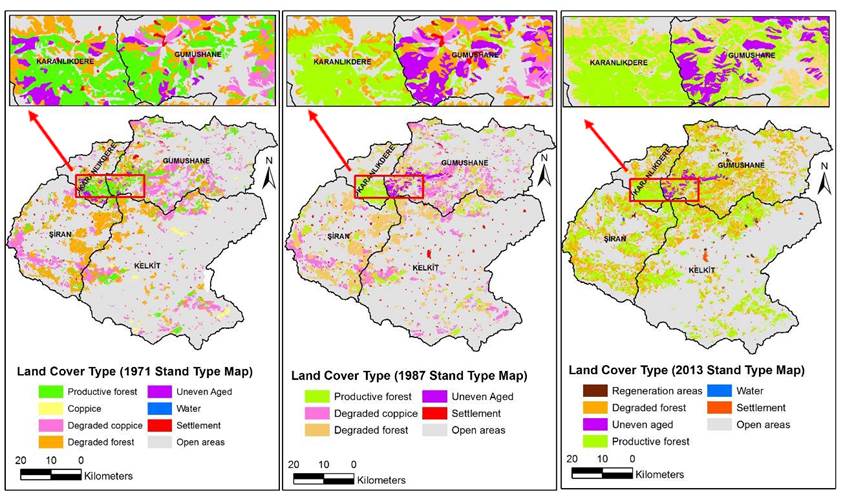
Figure 2 The spatial distribution of land covers types of Gümüşhane State Forest Industry, Turkey, during 1971, 1987 and 2013.
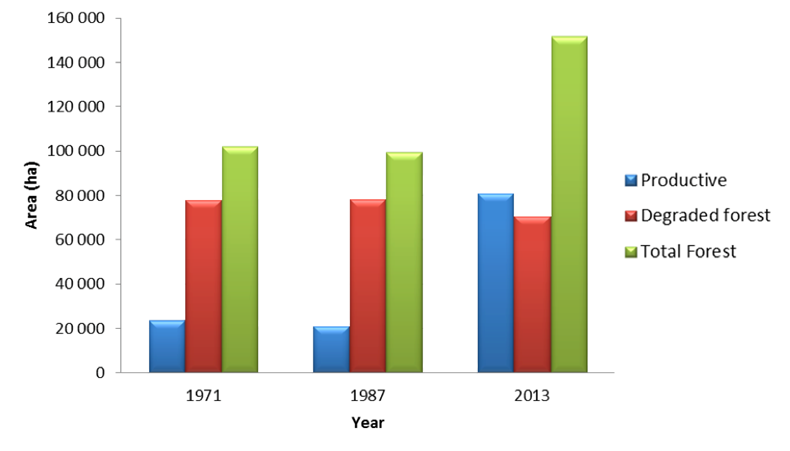
Figure 3 Change of forest areas in Gümüşhane Forest Industry, Turkey, at beginning of three planning periods: 1971, 1987 and 2013.
Based on stand-type maps (Figure 2), overall change in the cover types of total forest areas increased by 57,548 ha, while the open areas and degraded forest areas decreased by 50,052 and 7,542 ha, respectively. In total, the non-forested areas of the landscape decreased by 22.7 % (48,473 ha), causing the forested areas to increase at a similar rate of change.
During the period 1971-2013, a net increase of 57,248 ha was achieved in the productive forest areas and of 50,910 ha in the total (productive and degraded) forest areas. In the study site as a whole, the accumulated forest improvement amounted to 22.7 % (48,473 ha) and to 56 % in the forested area. The average improvement rate was 0.92 % annually for the combined degraded and productive forests. In this period (1971-2013), in the productive forest areas alone, the 57,248 ha improvement amounted to 11 % of the Gümüşhane State Forest as a whole and to 47 % of the forested area. This is the equivalent of an average improvement rate for the productive forests of 2.91 % annually.
Transitions among land-cover types
The major land-cover type transitions that had taken place over 1971, 1987 and 2013 were established using forest management plans (Table 2; Figures 2, 3 and 4; Appendix 1). As a result of this analysis, it was revealed that, between 1971 and 2013, 2,445 ha of the productive forest areas were transformed into degraded forest areas, while the productive forest areas showed a net increase of 57,248 ha. During the same period, open areas were changed into productive forest (around 21,018 ha) and degraded forest (38,653 ha); the areas left unchanged consisted of 262,310 ha of open areas, 14,967 ha of productive forest and 29,075 ha of degraded forest (Table 2). During the period 1987-2013, around 39,082 ha of open areas in the study area had changed into degraded forest and 19,976 ha into productive forest (Appendix 1). Other changes of land-cover types for both periods are shown in Figures 2, 3 and 4.
Table 2 The transition matrix of land-cover change of Gümüşhane Forest Industry, Turkey from 1971 to 2013.
| Land Cover Types (1971) | Land Cover Types (2013) | |||||||
| Settlement (ha) | Regeneration areas (ha) | Open Areas (ha) | Degraded forest (ha) | Uneven aged forest (ha) | Water (ha) | Productive forest (ha) | Landscape (ha) | |
| Open Areas | 2,100.4 | 1,182.2 | 262,310.7 | 38,653.5 | 279.2 | 189.4 | 21,018.0 | 325,733.5 |
| Coppice | 7.9 | 14.9 | 411.5 | 318.0 | - | - | 2,013.2 | 2,765.5 |
| Degraded coppice | 47.3 | 30.1 | 4,766.5 | 13,011.5 | 118.1 | 3.1 | 14,054.8 | 32,031.4 |
| Degraded forest | 40.9 | 4.3 | 5,581.3 | 16,064.7 | 341.1 | 3.2 | 24,148.3 | 46,183.9 |
| Uneven aged forest | - | - | 24.0 | 141.2 | 331.9 | - | 1,534.0 | 2,031.1 |
| Settlement | 1,181.5 | 0.7 | 1,745.7 | 179.9 | 0.1 | - | 122.7 | 3,230.5 |
| Water | - | - | 3.7 | - | - | 3.7 | ||
| Productive forest | 5.9 | 0.8 | 837.9 | 2,304.4 | 2,507.7 | - | 13,433.5 | 19,090.1 |
| Landscape | 3,383.9 | 1,233.0 | 275,681.3 | 70,673.3 | 3,578.1 | 195.7 | 76,324.5 | 431,069.7 |

Changes and transitions among crown closures and developmental stages
A further analysis of the stand-type maps revealed changes in the forest structure and dynamics. During the first period (1971-1987), stands with a crown closure of 2 (medium coverage, 41 %-70 %) increased by about 2200 ha and those with a crown closure of 1 (low coverage, 11 %-40 %) decreased by about 3,900 ha, while those with a crown closure of 3 (full coverage, >70 %) remained essentially unchanged. Generally, the changes in crown closure indicated that crown closure 1 and degraded forest areas decreased, crown closures of 3 were stable, crown closure 2 areas increased, and the quality of the forest structure increased between 1971 and 1987 (Table 3; Appendix 2 and 3). In the second period (1987-2013) stands with crown closures of 2 increased by about 3,200 ha, those with crown closures of 1 decreased by about 24,500 ha and those with full crown closures of 3 increased by about 31,200 ha. These changes between 1987 and 2013 showed that the crown closure had improved, the total productive forest had increased significantly by about 59,800 ha and the quality of the forest structure had also improved (Table 3; Appendix 2 and 3).
Table 3 The transition matrix of crown closure classes of Gümüşhane Forest Industry, Turkey, from 1971 to 2013.
| Crown Closure Classes (1971) | Crown Closure Classes (2013) | |||||||
| 1 | 2 | 3 | Regeneration | Degraded | Open areas | Uneven Aged | Total | |
| (ha) | (ha) | (ha) | (ha) | (ha) | (ha) | (ha) | (ha) | |
| 1 | 895.7 | 1,279.0 | 2,990.5 | - | 1,298.7 | 462.2 | 538.4 | 7,464.6 |
| 2 | 792.0 | 1,471.0 | 3,752.2 | 0.8 | 919.1 | 359.0 | 1,313.8 | 8,607.7 |
| 3 | 184.1 | 465.7 | 1,603.3 | - | 86.6 | 22.6 | 655.5 | 3,017.8 |
| Open areas | 10,283.5 | 3,466.4 | 7,390.8 | 1,182.9 | 38,833.4 | 267,531.4 | 279.2 | 328,967.7 |
| Coppice | 577.8 | 73.1 | 1,362.3 | 14.9 | 318.0 | 419.4 | - | 2,765.5 |
| Degraded | 15,185.8 | 7,087.8 | 15,929.6 | 34.4 | 29,076.3 | 10,442.2 | 459.2 | 78,215.3 |
| Uneven Aged | 131.7 | 174.3 | 1,228.0 | - | 141.2 | 24.0 | 331.9 | 2,031.1 |
| Total | 28,050.5 | 14,017.4 | 34,256.6 | 1,233.0 | 70,673.3 | 279,260.9 | 3,578.1 | 431,069.7 |
Crown closure: 1 = low coverage (0 - 10 %), 2 = medium coverage (11 - 40 %), 3 = full coverage (>71 %).
When the overall crown closure changes for the duration between 1971 and 2013 for the combined forest areas as a whole were examined, results showed that the areas of crown closures 1 and 2 increased by about 20,600 and 5,400 ha, respectively. Crown closure 3 areas significantly increased by 31,240 ha, while the degraded forest areas were reduced by about 7,600 ha. To a certain extent, the changes in crown closure indicated the improvement of the forest structure because less-covered areas had been changed in favor of fully-covered areas and consequently the productive forest areas increased significantly (Appendix 3).
Another parameter employed in the analysis of the change in forest structure was the classification of the developmental stages of the forest ecosystems. The 1971 stand-type maps showed the developmental stages B (young-mature), Bd (young-overmature), dB (mature and overmature) and d (overmature) as having areas of 15,669 ha, 692 ha, 1,378 ha and 490 ha, respectively (Table 4) (Kadıoğulları & Başkent, 2008). However, in 1987, forests were generally classified as being in the b (young) and c (mature) stages of development. Later, the forests were largely categorized as being in the developmental stages a (regenerated = 11,577 ha), b (young = 13,353 ha), bc (young-mature = 31,320 ha), c (mature = 1,607 ha) and cd (mature-overmature = 12,445 ha) (Table 4; Appendix 4 and 5). This overall change showed that regeneration practices had come into prominence as a result of sustainable forestry, as revealed by the increase in the a and ab developmental stages between 1971 and 2013. The rest of the area was left to grow into c (mature) and d (over-mature) developmental stages. The general assumption was that the forest was developing into b (young) and bc (young-mature) stages (Table 4; Appendix 5) (Kadıoğulları & Başkent, 2008).
Table 4 The transition matrix of developmental stages in the study area from 1971 to 2013.
| Developmental Stages (1971) | Developmental Stages (2013) | ||||||||||
| Regeneration (ha) | a (ha) | ab (ha) | b (ha) | bc (ha) | c (ha) | cd (ha) | Degraded (ha) | Open areas (ha) | Uneven Aged (ha) | Genel Toplam (ha) | |
| a | - | 55 | 51.2 | 23.6 | 458.8 | - | 7.5 | 139 | 92.4 | 32.9 | 860.3 |
| B | 0.8 | 559 | 153.5 | 221.1 | 5,865.9 | 757 | 3,247.6 | 1,936 | 688.5 | 2,239.8 | 15669 |
| Bd | - | 2.5 | 3.7 | - | 142.5 | 1.9 | 400.3 | 106.7 | 34.4 | - | 692.1 |
| d | - | 18.4 | - | 2.9 | 82.6 | 1 | 303.5 | 50.9 | 18.2 | 12.5 | 490.1 |
| dB | - | 45.5 | 6.9 | 80.4 | 251.1 | 0.4 | 689.6 | 71.8 | 10.4 | 222.5 | 1378.6 |
| Degraded | 34.4 | 10,736.4 | 3,992.3 | 1,867.2 | 16,913 | 619.9 | 4,074.3 | 29,076.3 | 10,442.2 | 459.2 | 78215.3 |
| Coppice | 14.9 | 792.4 | 671.2 | 172.2 | 323.8 | 2.4 | 51.2 | 318 | 419.4 | - | 2765.5 |
| Open areas | 1,182.9 | 7,294.7 | 2,389.9 | 1,805.6 | 6,657.5 | 219.2 | 2,773.7 | 38,833.5 | 267,531.4 | 279.2 | 328967.7 |
| Uneven Aged | - | 0.3 | 1.1 | 4.3 | 625.4 | 5.3 | 897.7 | 141.2 | 24 | 331.9 | 2031.1 |
| Genel Toplam | 1233 | 19,504.2 | 7,269.8 | 4,177.3 | 31,320.6 | 1607.2 | 12,445.3 | 70,673.3 | 279,260.9 | 3,578.1 | 431069.7 |
Developmental stages: a = regenerated, b = young, c = mature, d = over-mature, B = young-mature, Bd = young-overmature, dB = mature and overmature, bc = young-mature, cd = mature-overmature.
Based on the stand-type maps for the two periods, further crown closure analyses were carried out. For the second period (1987-2013), around 500 ha of full-closure (3) areas were changed to medium coverage (2); 254 ha of full-closure (3) areas to low coverage (1); 6,379 ha of medium-closure (2) areas to full coverage (3); and 1,709 ha of low-closure (1) areas were changed into full-coverage (3) areas (appendix 2). Furthermore, degraded-forest areas were transformed into productive areas, with nearly 16,894 ha of degraded-forest areas having been developed into full-coverage (3) areas, 7,011 ha into medium-coverage (2) areas and 16,101 ha into substantially low-coverage (1) areas (Appendix 2 and 4). A considerable increase in productive forests was observed in the Gümüşhane Forest Enterprise by the end of this period, with full-coverage (3) areas increasing by about 31,000 ha, medium-coverage (2) forest areas by about 3,200 ha and low-coverage (1) areas by about 24,500 ha (appendix 4).
The overall planning period encompassing 1971 to 2013 witnessed the transition of degraded forest areas, with around 15,185 ha changed into low-coverage (1) areas, 7,087 ha into medium-coverage (2) areas and 15,929 ha into full-coverage (3) areas. Moreover, some low-coverage (1) areas (2,990 ha) and medium-coverage (2) areas (3,752 ha) were developed into full-coverage (3) forest areas (Appendix 3). On the other hand, some low-coverage (1) areas (1,298 ha) and medium-coverage (2) areas (919 ha) were changed into degraded forest (Table 3). These general changes indicated that productive forest areas had expanded significantly, with full-coverage forest areas improved by 31,200 ha, low-coverage forest areas improved by 21,600 ha, and medium-coverage areas improved by 5,400 ha, while open areas had been reduced by 48,475 ha.
Based on the stand-type maps for the two periods, an analysis was carried out of additional temporal transitions among the developmental stages (Appendix 5). Approximately 4,163 ha of mature-stage (c) areas had naturally changed into mature/over-mature stage (cd), and 3,040 ha of young-stage (b) areas into young/mature-stage (bc) during the second period (1987-2013) Around 11,577 ha of degraded forest areas were turned into the regenerated stage (a), while 4,596 ha of degraded forest areas became young/regenerated (stage ab). Over the same period, 2,134 ha of degraded forest were transformed into the young stage (b), 16,835 ha into stage bc, and 4,282 ha into stage cd. At the end of this planning period, the number of stage-a (regeneration, dbh < 8 cm) areas grew from 850 to 19,504 ha as a result of afforestation and effective regeneration and rehabilitation activities.
The developmental stages were arranged according to the dominant stage class, which included a (a, ab), b (b, B, bc, Bd), c (c, cd) and d (d, dB) for convenience in the evaluation. Around 10,736 ha of degraded forest were regenerated to stage a, 3,992 ha were regenerated to stage ab, 620 ha to stage c, and 4,074 ha to stage cd. In addition, 7,295 ha of open areas were changed into a developmental stage and 1,182 ha to regeneration as a result of afforestation activities. By the end of this period, the first stages (a, ab) had increased from 860 ha to 26,773 ha and the 1,868 ha as d stages (d, dB) increased to 12,445 ha as c stages. These changes showed that the regenerated, young, young-mature and over-mature forest areas had increased quite outstandingly because of the reduction in open areas and degraded forest. With respect to the developmental stages, by the end of the overall study period (1971-2013), the changing aspects of the Gümüşhane forest ecosystem were focused on young and young-mature forest.
Changes and transitions among land-cover types based on elevation and distance from settlements
The transitions of land-cover-type maps were further analyzed to examine how some parameters changed in relation to elevation zones and distance from settlements (Figure 5). In terms of elevation zones, among all forests, 14.3 % of them were located between 1,001 and 1,500 m, 71.9 % between 1,501-2,000 m and finally, 13.7 % of the same land-use class were located between 2,001 and 2,500 m. The changes between 1971 and 2013 revealed that 88.5 % (90,322.5 ha) of the forests were unchanged, while 11.5 % (11,779.5 ha) were changed to non-forest areas. When deforestation was analyzed in relation to elevation zones, 18.8 % (2,216 ha) was found between 1,001 and 1,500 m, 59.2 % between 1,500 and 2,000 m and finally, 21.8 % was between 2,001 and 2,500 m. However, deforestation remained relatively low at 9.5 % between 1,501 and 2,000 m when change values were proportioned to forest lands, although most of the forest areas (71.95 %) were in that elevation zone. In short, although the elevation zone was mentioned as having the highest change value, 90.5 % of the forests in that zone were unchanged. On the other hand, the highest deforestation rate (18.4 %) was found between 2,001 and 2,500 m.
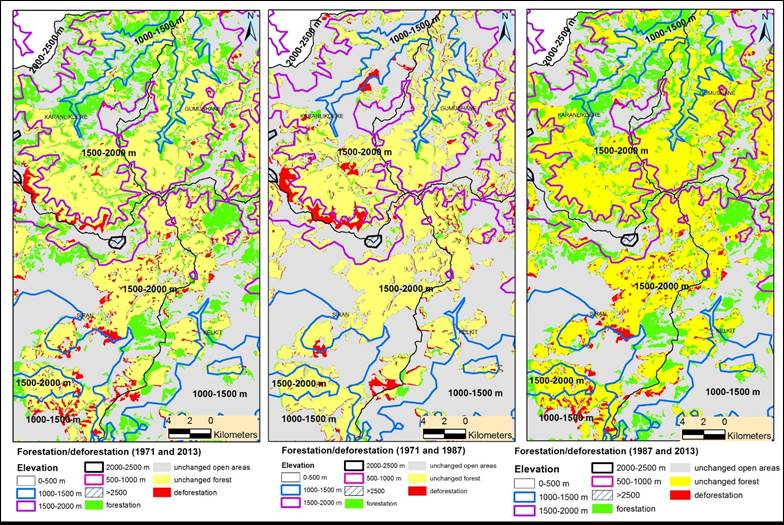
Figure 5 Sample of forestation/deforestation of Gümüşhane Forest Industry, Turkey, based on elevation in the following periods: 1971-2013, 1971-1987 and 1987-2013.
Similarly, the amount of forestation (60,253 ha) in relation to elevation zones was distributed differently between 1971 and 2013, and 18.3 % of the 1973 non-forested areas were changed to forested areas in the latter period. For instance, the most highly forested elevation zone (66.6 %; 40,124 ha) was located between 1,501 and 2,000 m. On the other hand, the proportion of that change to the non-forested areas was 21.4 % (40,124 ha forestation/187,797 ha non-forested areas), which was unlike the deforestation change. The forestation rate was 15.9 % (9,577 ha) between 1,001 and 1,500 m and 17.5 % (10,518 ha) between 2,001 and 2,500 m.
In order to demonstrate the effect of distance from settlements on forestation and deforestation, “effect areas”, each having a 500 m radius, were created (Figure 6). When the deforestation areas were proportioned to the forested areas for each effect area for the period 1971-2013, 0-500 m was found as 16.8 % (1,392 ha), 501-1,000 m as 12 % (2,463 ha), 1,001-1,500 m as 11.3 % (2,706 ha), 1,501-2,000 m as 10.8 % (2,171 ha), 2,001-2,500 m as 10.8 % (1,494 ha) and finally, that value for areas having more than 2,500 m distance to settlements was found as 10.3 % (1,876 ha)

Figure 6 Sample of forestation/deforestation of Gümüşhane Forest Industry, Turkey, based on distance from settlements in the following periods 1971-2013, 1971-1987 and 1987-2013. Distance from settlement prepared by using ArcGIS ring buffer functions (with 500 m intervals).
Similarly, when the deforestation areas were proportioned to the forested areas in the same distance zone between 1987 and 2013, those rates were found as 12.7 % (1,013 ha) between 0 and 500 m; 9.6 % (1,968 ha) between 501 and 1,000 m; 8.8 % (2,069 ha) between 1,001 and 1,500 m; 8.0 % (1,583 ha) between 1,501 and 2,000 m; 7.6 % (1,026 ha) between 2,001 and 2,500 m and finally, 6.6 % (1,154 ha) at more than 2,500 m from the settlements. Those results showed that the ratio of the deforestation areas to forest areas in the same distance zone decreased as the distance from settlements increased (Figure 6).
Similarly, when the forestation rate was analyzed in relation to distance from settlements, the highest forestation rate (60,253 ha in total) was found as 22.4 % (13,509 ha) at a distance of over 500 m from settlement areas. Other rates were found to be 22.1 % (13,330 ha) between 501 and 1,000 m; 20.7 % (12,494 ha) between 1,001 and 1,500 m; and 15.8 % (9,492 ha) between 1,501 and 2,000 m. When the period between 1987 and 2013 was analyzed, likewise the greatest amount of afforestation was 22.9 % (13,632 ha) at a distance of over 2,500 m from settlements. The afforestation rate was 21.8 % between 501 and 1,000 m, 20.7 % between 1,001 and 1,500 m, 15.6 % between 1,501 and 2,000 m and 10.4 % between 2,001 and 2,500 m. These results showed that the distance from settlements had a significant effect on afforestation and deforestation (Figure 6).
Spatial analysis of land-cover types
Several dimensions were calculated for the cover-type classes of the four periods as indicated by a spatial analysis of the landscape patterns. The total number of patches increased from 2,121 to 7,669 between 1971 and 2013. The mean patch size (MPS) decreased from 203.2 ha to 56.2 ha. The MPS of the open areas changed significantly from 841.7 ha to 200.8 ha between 1971 and 2013 and the open areas were reduced to about 50,052 ha due to the effects of the afforestation activities. On the other hand, the MPS of the water areas rose from 3.7 ha to 11.5 ha, having been affected by the construction of a small pond (Table 5). The number of patches increased from 375 to 2919 over the 42 years; however, the MPS of the productive forest areas was reduced by half, from 50.9 to 26.1. These changes in the productive forest areas were mainly a result of the net increase of 57,274 ha in the class areas. Likewise, the area weighted mean shape index (AWMSI) value rose from 18.89 to 22.82, chiefly because of the substantial rise in the AWMSI value of the open areas. Over the 42 years, the value of the patch size coefficient of variation (PSCV %) grew from 3,439 to 5,303. All these transformations, which included remarkable increases in the productive forest areas as well as in landscape fragmentation, signified that the forest had become more vulnerable to severe disturbances.
Table 5 Change of landscape pattern of Gümüşhane Forest Industry, Turkey (1971, 1987 and 2013 Land Cover Type Maps).
| Land Cover Type | Class Area (ha) | Number of Patches | Mean Patch Size (ha) | Percent of Landscape (%) | Area-Weighted Mean Shape Index | Patch Size Coefficient variant (PSCV %) | ||||||||||||
| 1971 | 1987 | 2013 | 1971 | 1987 | 2013 | 1971 | 1987 | 2013 | 1971 | 1987 | 2013 | 1971 | 1987 | 2013 | 1971 | 1987 | 2013 | |
| Regeneration Areas | - | - | 1,233.0 | - | - | 47 | - | - | 26.2 | - | - | 0.30 | - | - | 2.23 | - | - | - |
| Coppice | 2,765.5 | - | - | 43 | - | - | 64.3 | - | - | 0.64 | - | - | 2.49 | - | - | 187.5 | - | 138.1 |
| Degraded Coppice | 32,031.4 | 28,292.3 | - | 413 | 326 | - | 77.6 | 86.8 | - | 7.43 | 6.56 | - | 3.42 | 3.11 | - | 304.4 | 254.6 | - |
| Degraded Forest | 46,183.9 | 50,061.2 | 70,673.3 | 486 | 480 | 2,909 | 95.0 | 104.3 | 24.3 | 10.71 | 11.61 | 16.39 | 3.84 | 3.27 | 4.93 | 356.8 | 282.1 | 411.8 |
| Open Areas | 325,733.5 | 326,674.8 | 275,681.3 | 387 | 316 | 1373 | 841.7 | 1,033.8 | 200.8 | 75.56 | 75.78 | 63.95 | 23.88 | 21.77 | 33.04 | 1,941.3 | 1,754.5 | 3,505.2 |
| Productive Forest | 19,090.1 | 17,482.7 | 763,24.5 | 375 | 358 | 2919 | 50.9 | 48.8 | 26.1 | 4.43 | 4.06 | 17.71 | 3.34 | 3.05 | 4.73 | 402.3 | 508.0 | 564.0 |
| Settlement | 3,230.5 | 4,729.1 | 3,383.9 | 377 | 365 | 356 | 8.6 | 13.0 | 9.5 | 0.75 | 1.10 | 0.78 | 1.36 | 1.26 | 1.78 | 153.5 | 143.9 | 263.8 |
| Uneven aged forest | 2031.1 | 3,829.7 | 3,578.1 | 39 | 39 | 48 | 52.1 | 98.2 | 74.5 | 0.47 | 0.89 | 0.83 | 2.02 | 2.72 | 3.11 | 136.2 | 182.1 | 177.3 |
| Water | 3.7 | - | 195.7 | 1 | - | 17 | 3.7 | - | 11.5 | 0.00 | - | 0.05 | 1.95 | - | 1.48 | 0.0 | - | 144.5 |
| Landscape | 431,069.7 | 431,069.7 | 431,069.7 | 2,121 | 1,884 | 7,669 | 203.2 | 228.8 | 56.2 | 100.00 | 100.00 | 100.00 | 18.89 | 17.24 | 22.82 | 3,439.0 | 3,251.7 | 5,303.0 |
The dynamics of the land-cover types and forest structure were identified by using GIS and stand-type maps from periodically renewed forest management plans from 1971, 1987 and 2013. The quantitative evidence of the forest dynamics presented here showed that there had been drastic changes in the temporal and spatial patterns of the stand parameters, productive forest areas, and especially in the fully-covered forests and young-developmental stages of forests in the study area. However, the differences in the temporal changes of the forested areas may have resulted from the data quality, as these would have been affected by the different data-gathering methods in 1971, 1987 and 2013. For example, the stand-type maps in 1971 were produced using 1/35,000-scale black-and-white aerial photos, while the maps in 1987 were produced with 1/23,000-scale color-infrared aerial photos (Kadıoğulları & Başkent, 2008). In 2013, the stand-type maps were produced using IKONOS images (1 m resolution) and ground truth data. Moreover, the stand-labeling procedure and planning techniques had changed slightly over the 42 years. These procedural differences may also have affected the areal changes over the period.
Kadıoğulları and Başkent (2008) carried out an earlier study in the same area. Based on the coverage maps, in this study, the forest cover in the Gümüşhane Forest Enterprise decreased from 23.67 % in 1971 to 23.14 % in 1987. Cumulative forest disturbance accounted for 0.52 % of the whole area (2,271 ha) and 2.22 % of the forested area from 1971 to 1987. This amounts to an annual rate of forest disturbance of 0.14 % (Kadıoğulları & Başkent, 2008). The forest cover in Gümüşhane Forest Enterprise increased from 24.5 % in 1987 to 26.1 % (6,928 ha) in 2000 based on supervised classified Landsat images. The cumulative forest improvement (6,928 ha) was calculated as 1.6 % for the whole area and 6.54 % of the forested area from 1987 to 2000. Based on Landsat images, this translates into an annual rate of forest improvement of 0.5 % (Kadıoğulları & Başkent, 2008). The results of Kadıoğulları and Başkent (2008) show that forest areas declined in the first period between 1971 and 1987, while in the second period analyzed (1987-2000), using Landsat images, forest areas increased significantly.
For the present study, new forest-management plan maps and the new boundaries of the study area were used. The results, in parallel with the older studies, showed the annual rate of forest improvement as 0.92 % from 1971 to 2013, based on forest management plans. These changes differed in the two planning periods. The first period presented the annual rate of forest disturbance as 0.15 %, whereas the second period showed dramatic forest improvement with an annual rate of 1.58 %. The forest cover in Gümüşhane Forest Enterprise was shown to increase from approximately 31 % in 1971 to 53.7 % (50,910 ha) in 2013, based on forest management plans. From 1971 to 2013, cumulative forest improvement (50,910 ha) accounted for 22.7 % of the whole area of Gümüşhane and approximately 47.4 % of the forested area.
Similar results can also be seen in the analyses of the reforestation and forest improvement in Turkey. An assessment of the forest inventory results between 1963 and 1972 showed that there were 20 199,296 ha of forest area covering about 26.1 % of the country's total land area. Recently, according to an assessment of the latest inventory outputs considering forest management plans up to the end of 2012, Turkey has been shown to have 21 678,134 ha of forest area, amounting to about 27.6 % of the country's total land area (GDF, 2012). These findings indicate that the total forested areas were increased by 1.44 million ha in the 40-year period. Thus, in Turkey, the cumulative forest improvement for the total area was calculated as 1.88 % and for the forested area as 7.32 %. The total productive forest improvement rose by about 2.7 million ha and the degraded forests were reduced by about 1.22 million ha during the same period. This corresponds to an average total forest improvement rate of 0.17 % annually, an average productive forest improvement rate of 0.66 % annually and an average rate of -0.28 % annually for degraded forest areas. The plantation of degraded forestlands and open areas, the expansion of forests into abandoned lands resulting from migration from villages inside or near the forests, increased public awareness of and respect for the environment are all possible explanations for these trends (GDF, 2012). When the annual rate of total productive forest improvement is considered alone, this value was higher for the study area (1.54 %) than for Turkey as a whole (0.66 %).
One study carried out in northeastern Turkey in a region adjacent to the present study area reported that, based on stand-type maps, the forest cover in the Torul Forest Enterprise had increased from 42.95 % in 1984 to 51.2 % in 2005; this amounts to a forest improvement rate of 0.92 % annually (Kadıoğulları, Keleş, Başkent, & Günlü, 2008). Another study from northeastern Turkey found an average forest improvement rate of 0.40 % annually (1972-2005) for the Yalnızçam and Uğurlu forest planning units (Kadıoğulları, 2013). Furthermore, a study in the western part of Turkey reported an average forest improvement rate of 0.44 % annually from 1972 to 1993 (Baskent & Kadıoğulları, 2007). In contrast, in the Rize Forest Enterprise in northeastern Turkey, cumulative forest disturbances between 1984 and 2007 were responsible for a forest disturbance rate of 0.2 % annually (Günlü et al., 2009). Another study shows that in the period from 1972 to 2000, croplands, settlements, and evergreen forests increased by 174 %, 106 %, and 14 %, respectively based on Landsat images of the Mediterranean region of Turkey (Kilic, Evrendilek, Berberoglu, & Demirkesen, 2006).
In this sudy, when planning periods were analyzed generally by elevation factors, no significant change was observed between 1981 and 1987; however, a remarkable change was detected in the period between 1987 and 2013, when 8.5 % of the forested areas (8,578 ha) changed to non-forested areas. On the other hand, 18 % (59,488 ha) of non-forested areas were changed to forested lands in the same period. That change was the highest in the elevation zone between 1,501 and 2,000 m with 36,260 ha of forested areas and 5,062 ha of deforestation during the whole planning period (Figure 5). Distance from settlements was another factor that had a significant effect on afforestation and deforestation. When the forestation rate was analyzed in relation to distance from settlements, the highest forestation (60,253 ha in total) rate was found as 22.4 % (13,509 ha) where the distance was over 2,500 m from settlement areas.
Conclusions
This study has provided important insights into the dynamics of the forest ecosystems that occurred in the forested and major land-use areas of the Gümüşhane Forest Enterprise between 1971 and 2013. The total forest areas in Gümüşhane Forest Enterprise were shown to increase from approximately 102,102 ha in 1971 to 151,809 ha in 2013, based on forest management plans. From 1971 to 2013, cumulative forest improvement amounted to 50,910 ha in the whole area of Gümüşhane. Changes in favor of forested areas do not necessarily indicate a positive development, as the forest may be developed into less-covered and lower-size classes that are spatially unfragmented in structure. Finally, there is a strong link between land-use/forest-cover changes, social pressure, distance from settlements and elevation class. For that reason, the complex relationships between environmental, ecological, and socio-economic factors that induce changes and degradations in land use and forest cover should be studied and recognized; this should be a priority for achieving sustainable development and management of forest resources.