


 texto en
  Inglés (pdf)
 Artículo en XML
 Referencias del artículo
 Enviar artículo por email
 Citado por SciELO
  Similares en
SciELO
Similares en
SciELO 
 Permalink
Introduction
Durango is considered the first forest reserve in Mexico with an estimate of 422.1 million m3, representing 22.4 % of the total estimated at the national level (Corral-Rivas, Álvarez-González, Corral-Rivas & López-Sánchez, 2015). Of the total area of the state, 70.4% (8.6 million ha) is covered by forest resources, of which 57 % corresponds to temperate forests, dominated by irregular and multispecies stands (Corral-Rivas, Álvarez-González, Crecente-Campo, & Corral-Rivas, 2014). According to González, González, and Márquez (2007), 37 species of Quercus and 21 species of Pinus have been recorded in the forests of Durango, pines representing 20 % of all species of this genus known in the world.
In Durango, the species that stand out because of their abundance, distribution and economic importance are the following: Pinus cooperi Blanco, P. durangensis Martínez, P. arizonica Engelm., P. leiophylla SchiedeexSchltdl. & Cham., P. teocote Schltdl. & Cham., P. engelmannii Carr., P. lumholtzii Rob. & Fern., P. strobiformis Engelm., P. herrerae Martínez, P. maximinoi Moore, Quercus sideroxyla Bonpl., Q. durifolia Seemen and Q. rugosa Neé (Corral-Rivas, Álvarez-González, Ruiz-González, & Gadow, 2004). These species are mixed with each other and with other less abundant timber species of the genera Pinus, Quercus, Arbutus, Juniperus and Alnus, forming mixed and irregular stands in the different UMAFOR of the state (Corral-Rivas et al., 2014).
The estimation of the volume of individual trees is an important aspect in the dendrometry and the development of forest inventories. It is difficult to determine the volume through measuring the volume of sections, so it's convenient to have mathematical equations that allow to estimate the volume of trees indirectly through simple measurements such as the diameter at breast height and the total height of standing trees (Diéguez et al., 2003). In this sense, several studies have been developed in Durango for the estimation of the volume of commercial tree species (Corral, Návar, & Fernández, 1999; Corral-Rivas, Barrio, Diéguez-Aranda, & Aguirre, 2007a; Corral-Rivas, Diéguez-Aranda, Castedo,&Corral-Rivas, 2007b; Quiñonez-Barraza, De los Santos-Posadas, Álvarez-González, & Velázquez-Martínez, 2014).
In Mexico, the Secretariat of Environment and Natural Resources (SEMARNAT) and the National Forestry Commission (CONAFOR) request forestry professionals, as part of a new forest policy, to plan and execute management activities on a territorial scale known as regional forest management unit (UMAFOR) (Cámara de Diputados del H. Congreso de la Unión, 2003). A UMAFOR integrates at least 30 % of the forest owners of a specific forest region and is delimited considering a regional similarity, therefore, considers communal interdependence and biological sense.
Durango is divided into 13 UMAFOR and for 11 of these; specific volume equations have been developed through the execution of projects financed by CONAFOR. However, the practical application of specific equations in estimating the total volume of individual trees, whether for growing stock or harvesting purposes, poses the following questions for forest managers: (i) is it necessary to use one species-specific equation to determine the volume of trees of the same genus? and (ii) is it necessary to change the species-specific equation among different UMAFOR? Regarding the above, this study aimed to evaluate differences in equation systems used for the estimation of the volume of 12 commercial species and among forest regions for the same species.
Materials and Methods
The study was carried out with data collected in the years 2010 to 2013 in 11 of the 13 UMAFOR (1001 to 1011) of Durango (Figure 1). Each UMAFOR is composed of ejidos and communities characterized by the presence of rugged terrain with irregular elevations and depressions ranging from 1,400 to 3,000 m altitude. The predominant climate is temperate with summer rains; the average annual rainfall ranges from 700 to 1,440 mm with an average temperature of 8.3 in the highest parts and 16 °C in the lower parts (Martínez-Antúnez et al., 2013).
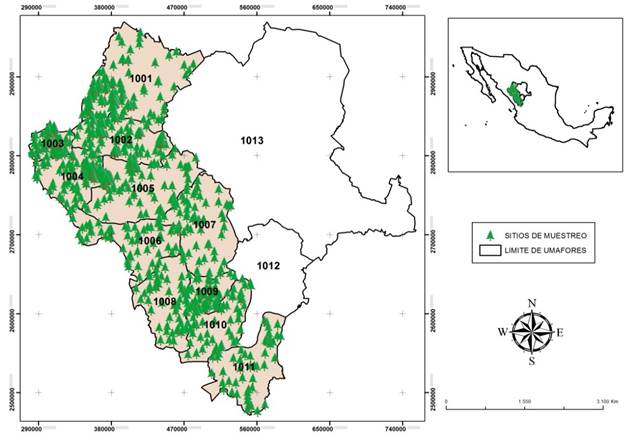
Figure 1 Location of study area. The points marked on the map represent sampling sites of the tree species of Pinus and Quercus studied in 11 units of regional forest management (UMAFOR) of Durango.
The sample used in the study comprises 10,828 trees corresponding to 12 timber forest species. Trees were felled in stands with potential for forest management corresponding to an area of approximately 3.4 million hectares (López-Serrano, López Sánchez, Solís-Moreno, & Corral-Rivas, 2016). The sample had variable conditions of site quality and density, and a distribution close to a normal standard of trees in terms of diameter classes per species. The 12 species studied were coded as follows, to be consistent with the catalog of species that is mostly used in Durango Pinus cooperi (1), P. durangensis (2), P. arizonica (3), P. leiophylla (4), P. teocote (5), P. engelmannii (6), P. lumholtzii (7), P. strobiformis (8), P. herrerae (15), Quercus sideroxyla (41), Q. durifolia (42) and Q. rugosa (66) (Table 1).
Table 1 Distribution of the number of trees per species and per unit of regional forest management (UMAFOR), considered in the study in Durango.
| UMAFOR | Area (ha) | Species | ||||||||||||
|---|---|---|---|---|---|---|---|---|---|---|---|---|---|---|
| 1 | 2 | 3 | 4 | 5 | 6 | 7 | 8 | 15 | 41 | 42 | 66 | Total | ||
| 001 | 423,990 | 194 | 152 | 153 | 154 | 70 | 166 | 14 | 20 | - | 140 | - | - | 1,063 |
| 1002 | 351,498 | - | 154 | 154 | 152 | 159 | 101 | 20 | 25 | - | 102 | - | - | 867 |
| 1003 | 126,054 | 27 | 175 | 67 | 105 | - | 52 | 12 | 27 | 164 | 151 | - | - | 780 |
| 1004 | 318,104 | - | 148 | 150 | 51 | 148 | 50 | 32 | 33 | 151 | 150 | - | - | 913 |
| 1005 | 424,753 | - | 168 | 203 | 46 | 136 | - | - | 27 | - | 129 | - | - | 709 |
| 1006 | 429,806 | 130 | 256 | - | 190 | 219 | 157 | 66 | 115 | 89 | 136 | - | 64 | 1,422 |
| 1007 | 253,619 | 190 | 163 | - | 162 | 204 | 114 | 28 | 19 | - | 134 | - | - | 1,014 |
| 1008 | 373,308 | 167 | 182 | - | 173 | 176 | 167 | 108 | 107 | 148 | 163 | 138 | 16 | 1,545 |
| 1009 | 162,075 | 103 | 189 | - | 156 | 126 | 122 | - | - | 3 | 119 | 55 | - | 873 |
| 1010 | 358,944 | 132 | 119 | - | 133 | 130 | 160 | 159 | 12 | 55 | - | - | - | 900 |
| 1011 | 262,488 | 156 | 152 | - | 39 | 35 | 155 | 37 | 1 | 46 | 60 | - | 61 | 742 |
| Total | 3,484,639 | 1,099 | 1,858 | 727 | 1,361 | 1,403 | 1,244 | 476 | 386 | 656 | 1,284 | 193 | 141 | 10,828 |
1 = Pinus cooperi, 2 = P. durangensis, 3 = P. arizonica, 4 = P. leiophylla, 5 = P. teocote, 6 = P. engelmannii, 7 = P. lumholtzii, 8 = P. strobiformis, 15 = P. herrerae, 41 = Quercus sideroxyla, 42 = Q. durifolia y 66 = Q. rugosa.
The following dendrometric variables were obtained from each tree: i) D = diameter at breast height over bark (1.30 m above ground, cm), ii) H = total height (m), and iii) di = top diameter over and inside bark along the stem with respect to the ground (cm). The sampling protocol considered the measurement of two sections of 0.30 m above the tree stump, the next section corresponded to the diameter at breast height (1.30 m), continuing with sections of 2.54 m in length until reaching the top of the tree, as shown in Figure 2. In addition, all branches with diameter at the base (beginning of the branch) greater than or equal to 5 cm were sectioned at variable lengths, recording the diameters over and inside bark for the different sections (dr i , cm). The volume of the trees was determined by sections; the volume of each section of stem and branch was estimated by the formula of Smalian and the volume of the top section was estimated by the equation of the cone. Over-bark total stem volume (above stump) was obtained by summing the over-bark log volumes, the volume of the top, and the volume of all the branches that exceeded 5 cm at the beginning. Table 2 shows the summary with the descriptive statistics of the sample trees of the species studied.
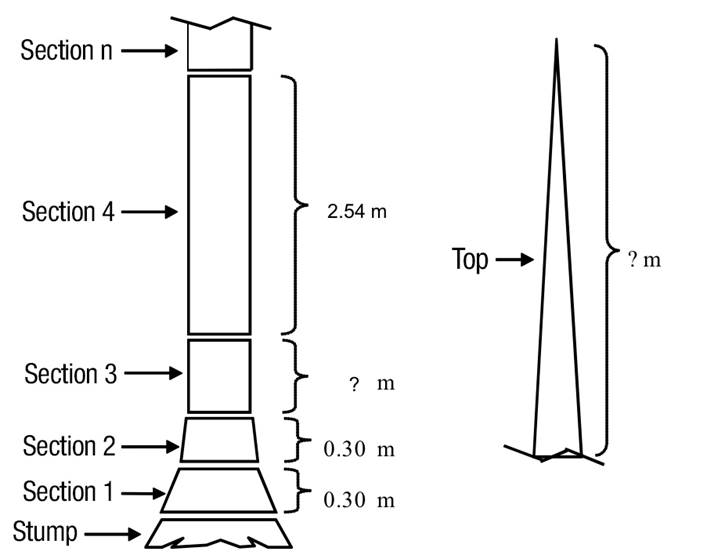
Figure 2 Illustration of sections of sampled trees for measuring the total volume overbark. The height where section 3 ends corresponds to the diameter at breast height (1.3 m).
Table 2 Summary of the variables diameter at breast height (D), total tree height (H) and total tree volume overbark (vta cc ) of the species studied in 11 regional forest management units (UMAFOR) in Durango.
| Variable | Descriptive Statistics | Species | |||||||||||
|---|---|---|---|---|---|---|---|---|---|---|---|---|---|
| 1 | 2 | 3 | 4 | 5 | 6 | 7 | 8 | 15 | 41 | 42 | 66 | ||
| D (cm) | Minimum | 7.5 | 7.70 | 7.80 | 7.50 | 7.50 | 7.7 | 7.70 | 7.50 | 7.00 | 7.50 | 8.30 | 7.70 |
| Mean | 30.57 | 31.10 | 33.44 | 29.75 | 29.41 | 29.18 | 24.62 | 26.23 | 31.20 | 28.39 | 26.38 | 23.30 | |
| Maximum | 67.50 | 91.24 | 88.14 | 71.60 | 82.81 | 68.00 | 58.00 | 68.00 | 73.25 | 68.00 | 70.10 | 45.50 | |
| H (m) | Minimum | 4.19 | 3.84 | 3.97 | 3.64 | 3.97 | 3.57 | 4.18 | 5.34 | 6.38 | 3.10 | 3.77 | 4.67 |
| Mean | 16.64 | 17.76 | 19.61 | 15.96 | 15.98 | 15.60 | 13.25 | 15.68 | 19.09 | 13.73 | 11.19 | 12.15 | |
| Maximum | 33.55 | 35.65 | 42.60 | 33.93 | 42.20 | 39.07 | 28.50 | 36.92 | 38.36 | 30.74 | 20.32 | 20.58 | |
| vtacc (m3) | Minimum | 0.02 | 0.01 | 0.02 | 0.01 | 0.01 | 0.01 | 0.01 | 0.02 | 0.02 | 0.01 | 0.02 | 0.01 |
| Mean | 1.01 | 1.07 | 1.39 | 0.89 | 0.86 | 0.87 | 0.56 | 0.65 | 1.12 | 0.67 | 0.51 | 0.37 | |
| Maximum | 6.24 | 12.22 | 13.42 | 6.83 | 11.16 | 6.28 | 2.97 | 5.31 | 7.24 | 4.72 | 5.70 | 1.36 | |
1= Pinus cooperi, 2 = P. durangensis, 3 = P. arizonica, 4 = P. leiophylla, 5 = P. teocote, 6 = P. engelmannii, 7 = P. lumholtzii, 8 = P. strobiformis, 15 = P. herrerae, 41 = Quercus sideroxyla, 42 = Q. durifolia y 66 = Q. rugosa.
Statistical Analysis
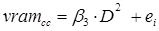
A first comparative analysis of the data using different volume equations indicated that, for more than 98 % of the species studied, the Schumacher and Hall equation (1933) better described the relationship between the total over bark volume of the stem (vrta) as dependent variable and the diameter at breast height and total height as independent variables. Therefore, this study used this equation as the base model to compare the volume estimates among tree species and in the same species among the UMAFOR. The system of additive equations to estimate stem, branches and total tree volume was composed of the following equations:


where:
vrta cc = |
Total stemvolume of the tree over bark; i.e., the volume of the main stem (m3) |
vram cc = |
Volume of branches over bark (m3) |
vta cc = |
Total tree volume over bark (vrta cc + vram cc, m3) |
D= |
Diameter at breast height of the tree (cm) |
H= |
Total height of the tree (m) |
β i = |
Coefficients to be estimated by the regression |
e i = |
Residual error (m3) |
To evaluate whether the additive volume equation systems differs among species of the same genus and in the same species among the UMAFOR, two complementary analyzes were used based on the fitting of a reduced and a full equation system (Bates & Watts, 1988). The reduced system corresponded to the same set of global parameters (β 0 , β 1 , β 2 and β 3 ) for all species belonging to the same genus without distinguishing among them or among the UMAFOR where the same species coexists. The full system corresponded to different sets of parameters for each species or for each UMAFOR, and was obtained by the expansion of the parameters and the inclusion of an associated parameter and a dichotomous variable that allows to differentiate among tree species and among the UMAFOR, according to the case. To perform this test, the minimum sample size required by species within a UMAFOR was 50 individuals; for this reason, in the case of P. strobiformis, the test was only conducted in UMAFOR 1006 and 1008.
In the case of the nine species of the genus Pinus, the parameters of the system of additive equations expanded, resulting in a new system of three equations with 36 parameters accompanied by a dichotomous variable to differentiate among the tree species. The parameters of the full model were expressed as:


β 0i, β 1i, β 2i and β 3i are the coefficients to be estimated; I i is the dichotomous variable defined as follows (considering P. cooperi as the base or reference species): I 2 = 1 for the species P. durangensis and 0 for the rest, and so on until reaching the species coded by the number 15 (P. herrerae). When the comparison was made among species of the genus Quercus, I 2 = 1 for Q. durifolia and 0 for the rest, and so on until reaching the species coded with the number 66 (Q. rugosa). In this case Q. sideroxyla was the reference species to expand the system. In the case of the UMAFOR, I 2 = 1 for the UMAFOR 1002 and 0 for the rest, and so on until reaching the UMAFOR 1011 (UMAFOR 1001 as reference). The two analyzes performed are described below:
Nonlinear extra sum of squares method
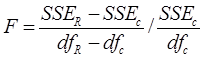
The first statistical analysis performed is known as the additional non-linear squares method (Bates & Watts, 1988) and the appropriate statistical test following a F distribution is defined as:
where:
SSE R = |
Sum of squares of the reduced model |
df R = |
Degrees of freedom of the reduced model |
SSE c = |
Sum of squares of the full model |
df c = |
Degrees of freedom of the full model |
The statistical decision rule in this analysis for a given level of significance (α) is the following: if F >F critical (1 − α; df R − df c , df c ) or if the associated probability (P > F critical) <α, the null hypothesis (H 0: no difference among species or among the UMAFOR) is rejected. This indicates that different systems of equations are required for the prediction of the volume of the different species of Pinus and Quercus or for the same species that grows in different UMAFOR. If, on the contrary, F < F critical (1 − α; df R − df c , df c ) or if the associated probability (P > F critical) >α, the null hypothesis H 0 is accepted and the same system of equations is proposed for two or more species of the same genus or for the same species in two or more UMAFOR.
Test of significance of the parameters associated to the dichotomous variable
The second statistical analysis consisted of checking the significance of the parameters associated to the dichotomous variable, to differentiate among species and among UMAFOR in the full equation system. In both comparisons (among species and among UMAFOR) the null hypothesis established that the parameters are the same for all species or UMAFOR (i. e., H 0 : β 0i = β 3i = 0) against the alternative hypothesis (H 1 ) that established that at least one of the system parameters is different. In this analysis, H 0 was rejected when one of the parameters associated to the dichotomous variable, to differentiate among species oramong the UMAFOR, was significant (P < 0.05). In this case different systems of equations will be required to predict the volume of two or more tree species of the genera Pinus and Quercus or for the same species in different UMAFOR.
In any of the previous analyzes, significant differences among the systems of equations were detected, additional tests were performed to assess whether the differences were caused by as few of two species or in the case of the same species, as few of two UMAFORs as suggested by Barrio-Anta, Balboa, Castedo, Diéguez-Aranda, and Álvarez-González (2006); Calama, Cañadas, and Montero (2003); Corral-Rivas et al. (2007a); Huang, Price, and Titus (2000). Therefore, a full model with its corresponding reduced model was compared for all possible pairs of tree species or UMAFOR, from the analyzes described previously, and only when a non-significant F value was obtained (in this case, a P > 0.1 value for type II error protection); or when no associated parameter was significant (P > 0.05), the same system of equations was recommended to estimate the volume of the pair of tree species or the UMAFOR under study.
The parameters of the reduced model and full model were obtained simultaneously using the NSUR (Nonlinear Seemingly Unrelated Regression) methodology, using the MODEL procedure of the SAS/ETS® program (Statistical Analysis System [SAS Institute Inc., 2008]), securing the additivity of the volume equations.
Correcting for heteroskedasticity
To correct the heteroskedasticity problem in the volume equations and ensure that the
parameter estimates were obtained under homoscedasticity conditions, the
fitting was performed using weighted regression, applying the same weights
to the inverse of the variance of each observation (Cunia, 1964; Parresol,
1999; Schilaegel, 1982).
This variance, a priori unknown, was estimated using a
power function
 . The values of
  and of the exponent
k were optimized using the methodology proposed by
Harvey (1976), which consists in
using the errors of the adjusted model without weights as a dependent
variable in the potential model of error variance. The weight considered was
1/D
2
for the branches over bark volume equation (vram
cc
) and 1/D
2
·H for the stem over bark volume equation
(vrta
cc
).
and of the exponent
k were optimized using the methodology proposed by
Harvey (1976), which consists in
using the errors of the adjusted model without weights as a dependent
variable in the potential model of error variance. The weight considered was
1/D
2
for the branches over bark volume equation (vram
cc
) and 1/D
2
·H for the stem over bark volume equation
(vrta
cc
).
Results and Discussion
Comparison of additive equation systemsto estimate volumes among species
The results of the additional sum of non-linear squares obtained in the fitting of the reduced and full systems are shown in Table 3. The value of the F statistics estimated in the comparison to evaluate whether the systems of additive equations differ among tree species of the genus Pinus was 6.45, and the probability of finding a critical value greater than 6.45 was lower than 0.0001; therefore, the null hypothesis that a single system of equationsis suitable for all pine species together, was rejected.
Table 3 F test to evaluate differences in the volume of the 12 species studied in 11 units of regional forest management (UMAFOR) in the state of Durango.
| Comparison | N | SSE C | df C | SSE R | df R | F | P > F |
|---|---|---|---|---|---|---|---|
| All Pinus species | 9,210 | 225 | 9,174 | 229.60 | 9206 | 6.45 | <0.0001 |
| 1-2 | 2,957 | 72.72 | 2,948 | 77.49 | 2,952 | 48.34 | <0.0001 |
| 1-3 | 1,826 | 48.16 | 1,818 | 63.13 | 1,822 | 141.24 | <0.0001 |
| 1-4 | 2,460 | 51.86 | 2,452 | 55.85 | 2,456 | 47.22 | <0.0001 |
| 1-5 | 2,502 | 55.99 | 2,494 | 63.21 | 2,498 | 80.45 | <0.0001 |
| 1-6 | 2,343 | 49.81 | 2,335 | 51.77 | 2,339 | 22.98 | <0.0001 |
| 1-7 | 1,575 | 36.93 | 1,567 | 39.49 | 1,571 | 27.24 | <0.0001 |
| 1-8 | 1,485 | 33.80 | 1,477 | 48.96 | 1,481 | 165.62 | <0.0001 |
| 1-15 | 1,755 | 51.49 | 1,747 | 57.66 | 1,751 | 52.29 | <0.0001 |
| 2-3 | 2,585 | 74.87 | 2,576 | 75.40 | 2,580 | 4.58 | <0.0001 |
| 2-4 | 2,219 | 56.42 | 2,905 | 56.71 | 2,909 | 3.08 | <0.0001 |
| 2-5 | 3,261 | 70.83 | 3,252 | 71.26 | 3,256 | 58.34 | <0.0001 |
| 2-6 | 3,102 | 64.62 | 3,093 | 64.99 | 3,097 | 4.42 | <0.0001 |
| 2-7 | 2,334 | 52.11 | 2,325 | 52.67 | 2,329 | 6.20 | <0.0001 |
| 2-8 | 2,244 | 48.54 | 2,235 | 56.25 | 2,239 | 88.78 | <0.0001 |
| 2-15 | 2,514 | 66.02 | 2,505 | 66.28 | 2,509 | 2.50 | 0.04 |
| 3 -4 | 2,088 | 54.27 | 2,080 | 54.87 | 2,084 | 5.68 | <0.0001 |
| 3-5 | 2,130 | 58.63 | 2,122 | 60.43 | 2,126 | 16.26 | <0.0001 |
| 3-6 | 1,971 | 48.89 | 1,808 | 49.15 | 1,812 | 2.40 | 0.04 |
| 3-7 | 1,203 | 39.71 | 1,195 | 40.52 | 1,199 | 6.11 | <0.0001 |
| 3-8 | 1,113 | 36.29 | 1,105 | 45.56 | 1,109 | 70.58 | <0.0001 |
| 3-15 | 1,383 | 53.73 | 1,375 | 55.18 | 1,379 | 9.28 | <0.0001 |
| 4-5 | 2,764 | 50.03 | 2,756 | 50.66 | 2,760 | 8.64 | <0.0001 |
| 4-6 | 2,605 | 43.77 | 2,597 | 44.10 | 2,601 | 5.00 | <0.0001 |
| 4-7 | 1,837 | 31.15 | 1,829 | 31.76 | 1,833 | 9.03 | <0.0001 |
| 4-8 | 1,747 | 27.67 | 1,739 | 34.08 | 1,743 | 100.83 | <0.0001 |
| 4-15 | 2,017 | 43.54 | 1,924 | 43.91 | 1,928 | 4.20 | <0.0001 |
| 5-6 | 2,457 | 47.95 | 2,639 | 49.44 | 2,643 | 20.49 | <0.0001 |
| 5-7 | 1,844 | 34.06 | 1,799 | 34.29 | 1,803 | 2.90 | 0.02 |
| 5-8 | 1,754 | 32.01 | 1,781 | 37.33 | 1,785 | 73.93 | <0.0001 |
| 5-15 | 2,024 | 32.13 | 2,051 | 32.38 | 2,055 | 4.09 | <0.0001 |
| 6-7 | 1,565 | 29.27 | 1,712 | 30.25 | 1,716 | 14.30 | <0.0001 |
| 6-8 | 1,475 | 25.93 | 1,622 | 34.09 | 1,626 | 127.59 | <0.0001 |
| 6-15 | 1,745 | 43.32 | 1,892 | 44.36 | 1,896 | 11.38 | <0.0001 |
| 7-8 | 862 | 13.24 | 854 | 14.62 | 858 | 22.27 | <0.0001 |
| 7-15 | 1,132 | 15.80 | 1,124 | 16.28 | 1,128 | 8.54 | <0.0001 |
| 8-15 | 1,042 | 27.33 | 1,034 | 32.56 | 1,038 | 49.55 | <0.0001 |
| All Quercus species | 1,618 | 18.70 | 1,610 | 19.20 | 1,614 | 11.09 | <0.0001 |
| 41-42 | 1,477 | 38.08 | 1,469 | 40.15 | 1,473 | 20.05 | <0.0001 |
| 41-66 | 1,425 | 32.53 | 1,417 | 32.57 | 1,421 | 0.43 | 0.78 |
| 42-66 | 334 | 6.98 | 326 | 7.12 | 330 | 1.65 | 0.16 |
A value P < 0.1 indicates that the models are different. N = Number of trees, SSEC = Sum of squares of the error ofthe full model, dfC = Degrees of freedom associated with the full model, SSER = Sum of squares of the error ofthe reduced model, df R = Degrees of freedom associated with the reduced model. 1 = Pinus cooperi, 2 = P. durangensis, 3 = P. arizonica, 4 = P. leiophylla, 5 = P. teocote, 6 = P. engelmannii, 7 = P. lumholtzii, 8 = P. strobiformis, 15 = P. herrerae, 41 = Quercus sideroxyla, 42 = Q. durifolia and 66 = Q. rugosa.
In the comparison made to evaluate whether the system of additive equations differs among the three species of the genus Quercus, the F value was 11.09, and the probability of finding a critical value greater than 11.09 was lower than 0.0001; therefore, the null hypothesis of a unique model for the three oak species, was also rejected.
The results of the additional tests performed to assess whether differences were caused by as few as two or as many as the nine pine species are also shown in Table 3. It was found that the 36 paired comparisons produced significant F-values, suggesting that significantly different equations systems are required for the nine pine species (P < 0.1). On the other hand, the results of the paired evaluation of the three oak species indicate that Q. sideroxyla and Q. durifolia need different systems of volume equations; while Q. sideroxyla and Q. rugosa, and Q. durifolia and Q. rugosa did not differ significantly (P > 0.1).
The results of the second analysis showed that, during the fitting of the full model, most of the parameters associated with the dichotomous variable used to differentiate among species were significant (P < 0.05) (Table 4). Comparisons among species of the genus Pinus indicate that at least one of the parameters associated to the dichotomous variable, to differentiate among species and among UMAFOR in the full model (β 01 , β 11 , β 21 ) was significant (P < 0.05). In the case of Quercus, the results suggest significant differences among the models developed for the species Q. sideroxyla and Q. rugosa and between Q. sideroxyla and Q. durifolia, and consistently with the method of the additional sum of non-linear squares there were non significant differences among the systems of equations developed for Q. sideroxyla and Q. rugosa.
Table 4 Parameters associated with the dichotomous variable used to differentiate among species (β 01 , β 11 and β 21 ).
| Comparison | β 0 | β 01 | β 1 | β 11 | β 2 | β 21 | β 3 | β 31 |
|---|---|---|---|---|---|---|---|---|
| 1-2 | 4.91E-05 | 1.08E-05 | 1.9855 | 0.0085 | 0.9771 | -0.0870 | 6.21E-05 | -1.75E-05 |
| 1-4 | 4.84E-05 | 9.25E-06 | 1.9875 | 0.0340 | 0.9791 | -0.1112 | 6.09E-05 | -1.64E-05 |
| 1-5 | 4.92E-05 | 2.02E-05 | 1.9809 | -0.0410 | 0.9820 | -0.0803 | 6.14E-05 | -1.7E-05 |
| 1-6 | 4.87E-05 | 6.15E-06 | 1.9862 | 0.0142 | 0.9790 | -0.0686 | 6.1E-05 | -6.83E-07 |
| 1-7 | 4.89E-05 | 2.78E-05 | 1.9844 | 0.0351 | 0.9798 | -0.2221 | 6.13E-05 | 2.58E-05 |
| 1-8 | 4.83E-05 | 1.78E-05 | 1.9903 | -0.0226 | 0.9765 | -0.1310 | 6.1E-05 | -1.94E-05 |
| 1-15 | 4.88E-05 | 1.13E-05 | 1.9812 | -0.0035 | 0.9835 | -0.0852 | 6E-05 | -1.39E-05 |
| 2-3 | 6.08E-05 | 2.3E-06 | 1.9878 | -0.0032 | 0.8938 | -0.0003 | 4.53E-05 | -1.45E-05 |
| 2-4 | 6.04E-05 | -2.4E-06 | 1.9911 | 0.0206 | 0.8916 | -0.0128 | 4.49E-05 | 4.57E-07 |
| 2-5 | 6.07E-05 | 9.17E-06 | 1.9884 | -0.0517 | 0.8932 | 0.0099 | 4.5E-05 | 1.44E-06 |
| 2-6 | 6.05E-05 | -4.64E-06 | 1.9900 | 0.0006 | 0.8921 | 0.0240 | 4.48E-05 | 1.68E-05 |
| 2-7 | 6.09E-05 | 1.7E-05 | 1.9866 | 0.0059 | 0.8942 | -0.1080 | 4.51E-05 | 4.31E-05 |
| 2-8 | 6.07E-05 | 6.05E-06 | 1.9893 | -0.0481 | 0.8920 | -0.0181 | 4.52E-05 | -2.52E-06 |
| 2-15 | 6.02E-05 | 1.12E-06 | 1.9898 | -0.0130 | 0.8939 | -0.0002 | 4.47E-05 | 3.9E-06 |
| 3-4 | 6.32E-05 | -5.39E-06 | 1.9854 | 0.0140 | 0.8921 | 0.0029 | 3.04E-05 | 1.48E-05 |
| 3-5 | 6.32E-05 | 5.86E-06 | 1.9846 | -0.0426 | 0.8931 | 0.0081 | 3.06E-05 | 1.65E-05 |
| 3-6 | 6.32E-05 | -6.98E-06 | 1.9851 | 0.0035 | 0.8923 | 0.0241 | 3.02E-05 | 3.15E-05 |
| 3-7 | 6.3E-05 | 1.21E-05 | 1.9829 | 0.0095 | 0.8961 | -0.0936 | 3.06E-05 | 5.93E-05 |
| 3-8 | 6.27E-05 | 2.8E-06 | 1.9846 | -0.0599 | 0.8952 | 0.0055 | 3.09E-05 | 1.22E-05 |
| 3-15 | 6.26E-05 | -1.82E-06 | 1.9850 | 0.0020 | 0.8955 | -0.0105 | 2.99E-05 | 1.94E-05 |
| 4-5 | 5.85E-05 | 1.17E-05 | 2.0132 | -0.0778 | 0.8740 | 0.0297 | 4.5E-05 | 4.83E-07 |
| 4-6 | 5.84E-05 | -3.11E-06 | 2.0206 | -0.0270 | 0.8652 | 0.0512 | 4.47E-05 | 1.61E-05 |
| 4-7 | 5.87E-05 | 2.15E-05 | 2.0203 | -0.0278 | 0.8636 | -0.0892 | 4.49E-05 | 4.19E-05 |
| 4-8 | 5.82E-05 | 8.59E-06 | 2.0219 | -0.0639 | 0.8646 | -0.0107 | 4.5E-05 | -2.92E-06 |
| 4-15 | 5.83E-05 | 2.7E-06 | 2.0079 | -0.0353 | 0.8811 | 0.0194 | 4.42E-05 | 2.86E-06 |
| 5-6 | 7.06E-05 | -1.47E-05 | 1.9311 | 0.0552 | 0.9070 | 0.0144 | 4.45E-05 | 1.66E-05 |
| 5-7 | 7.14E-05 | 9.47E-06 | 1.9222 | 0.0540 | 0.9144 | -0.1217 | 4.5E-05 | 4.16E-05 |
| 5-8 | 7.06E-05 | -3.71E-06 | 1.9329 | 0.0078 | 0.9047 | -0.0305 | 4.6E-05 | -3.92E-06 |
| 5-15 | 6.94E-05 | -7.74E-06 | 1.9340 | 0.0369 | 0.9091 | -0.0099 | 4.44E-05 | 3.12E-06 |
| 6-7 | 5.6E-05 | 2.63E-05 | 1.9822 | -0.0039 | 0.9261 | -0.1431 | 6.07E-05 | 2.29E-05 |
| 6-8 | 5.56E-05 | 1.17E-05 | 1.9903 | -0.0373 | 0.9185 | -0.0607 | 6.09E-05 | -1.98E-05 |
| 6-15 | 5.55E-05 | 6.16E-06 | 1.9894 | -0.0191 | 0.9198 | -0.0198 | 6.02E-05 | -1.42E-05 |
| 7-8 | 8.52E-05 | -1.66E-05 | 1.9549 | -0.0113 | 0.7988 | 0.0641 | 8.38E-05 | -4.23E-05 |
| 7-15 | 7.73E-05 | -1.53E-05 | 1.9952 | -0.0318 | 0.7864 | 0.1203 | 8.71E-05 | -4.11E-05 |
| 8-15 | 6.53E-05 | -4.29E-06 | 1.9424 | 0.0306 | 0.8806 | 0.0195 | 4.14E-05 | 5.5E-06 |
| 41-42 | 5.02E-05 | 2.62E-05 | 1.9503 | -0.1631 | 0.9562 | 0.0370 | 7.57E-05 | 0.00015 |
| 41-66 | 5.02E-05 | 2.62E-05 | 1.9503 | -0.1631 | 0.9562 | 0.0370 | 7.57E-05 | 0.00015 |
| 42-66 | 8.11E-05 | -2.14E-05 | 1.7838 | 0.1550 | 0.9698 | -0.0705 | 0.000219 | -0.000133 |
The parameters marked in bold were not significant (P > 0.05). Note that in the comparison between Q. sideroxyla and Q. rugosa equation systems, none of the additive parameters were significant. 1 = Pinus cooperi, 2 = P. durangensis, 3 = P. arizonica, 4 = P. leiophylla, 5 = P. teocote, 6 = P. engelmannii, 7 = P. lumholtzii, 8 = P. strobiformis, 15 = P. herrerae, 41 = Quercus sideroxyla, 42 = Q. durifolia and 66 = Q. rugosa.
The results of the two statistical analyzes to evaluate differences in volume of the 12 species studied were consistent in 97.4 % of the cases studied, indicating the rejection of the null hypothesis of a single equation system. Only a discrepancy between the two statistical tests was observed, which consisted in that the additional sum of non-linear squares recommends the use of a reduced model to estimate the volume of Q. durifolia and Q. rugosa, while the parameter significance analysis recommends using different models.
In this study, we decided to reject the null hypothesis of a single model, if one of the two statistical tests performed suggests rejection. This was based on the fact that there is information at the tree species level for the development of the models, and according to the results of this study only the volume of Q. sideroxyla and Q. rugosa could be estimated with the same system of equations.
The results of the comparison among species of the same genus are consistent with those reported by Corral-Rivas et al. (2007a) and Corral-Rivas et al. (2007b) who also observed significant differences in models developed to estimate the diameter at breast height and volume from stump dimensions and compatible taper and volume functions in five species of Pinus in a forest region of Durango, respectively. Corral-Rivas et al. (2004) also reported significant differences in growth in dominant height in five of the species of the genus Pinus analyzed in this study. Moreover, Quiñonez-Barraza et al. (2014) found differences in the height at which the inflection points of profile equations occur in some of the species considered in this study.
The main causes of the statistical differences observed in the volume of the species studied are related to differences in the stem profile (Corral-Rivas et al., 2007b; Quiñonez-Barraza et al., 2014) and with specific requirements of site quality of the species analyzed (Corral-Rivas et al., 2004).
Comparison of additive equation systems to estimate volume among ecoregions
The F statistic value calculated in the comparison made to evaluate whether the systems of equations for the same species differ among the UMAFOR was lower than the critical value (P < 0.1) in all species analyzed, except for P. strobiformis and Q. rugosa (Table 5). Therefore, we reject the null hypothesis of the formulation of a single model for all UMAFOR in 10 of the 12 species studied. The results of additional tests performed to assess whether differences are caused by as few as two or as many as all the UMAFOR are not shown in this study because of the space they would occupy; however, indicate that 111 of the 285 paired comparisons did not rejected the null hypothesis of a single model for the UMAFOR pair (P > 0.1) analyzed, while the rest (61 % of pairs) rejected the null hypothesis of a unique model for the pairs of UMAFOR analyzed.
Table 5 Results of the nonlinear extra sum of squares used to evaluate regional differences in the volume of the 12 species studied in 11 regional forest management units (UMAFOR) in Durango.
| Species | UMAFOR | N | SSE C | df C | SSE R | df R | F | P > F |
|---|---|---|---|---|---|---|---|---|
| 1 | 7 | 1,072 | 25.04 | 1,040 | 28.51 | 1,068 | 5.10 | <0.0001 |
| 2 | 11 | 1,704 | 39.10 | 1,661 | 41.14 | 1,700 | 2.20 | <0.0001 |
| 3 | 5 | 727 | 29.63 | 719 | 31.38 | 723 | 10.56 | <0.0001 |
| 4 | 9 | 1,170 | 16.33 | 1,162 | 20.23 | 1,166 | 69.31 | <0.0001 |
| 5 | 9 | 1,368 | 20.79 | 1,360 | 26.68 | 1,364 | 96.23 | <0.0001 |
| 6 | 10 | 1,244 | 16.60 | 1,236 | 21.02 | 1,240 | 82.37 | <0.0001 |
| 7 | 3 | 333 | 2.00 | 325 | 2.54 | 329 | 22.00 | <0.0001 |
| 8 | 2 | 222 | 0.83 | 214 | 0.86 | 218 | 1.99 | 0.10 |
| 15 | 6 | 653 | 19.15 | 645 | 22.31 | 649 | 26.66 | <0.0001 |
| 41 | 10 | 1,284 | 28.40 | 1,276 | 31.59 | 1,280 | 35.84 | <0.0001 |
| 42 | 2 | 193 | 1.65 | 185 | 6.09 | 189 | 124.60 | <0.0001 |
| 66 | 2 | 125 | 0.91 | 117 | 0.96 | 120 | 2.10 | 0.10 |
*The null hypothesis of a single model (P ≥ 0.01) is not rejected. N = number of trees, SSEC = Sum of squares of the error of the full model, dfC = Degrees of freedom associated with the full model, SSER = Sum of squares of the error of the reduced model, df R = Degrees of freedom associated with the reduced model. 1 = Pinus cooperi, 2 = P. durangensis, 3 = P. arizonica, 4 = P. leiophylla, 5 = P. teocote, 6 = P. engelmannii, 7 = P. lumholtzii, 8 = P. strobiformis, 15 = P. herrerae, 41 = Quercus sideroxyla, 42 = Q. durifolia and 66 = Q. rugosa.
The results of the significance analysis of the parameters are also not shown for reasons of space, but we observed that the parameters associated to the dichotomous variable used to differentiate among UMAFOR (β 01, β 11, β 21) were significant (P < 0.05) in most of the full model fits. According to this analysis, only 15 comparisons performed among UMAFOR (5 % of cases) did not rejected the null hypothesis of the formulation of a single model.
In relation to the previous analysis, the absence of regional differences in the volume of P. strobiformis turns out to be interesting; this result can be related to a similarity of ecological conditions of the sites where this species develops, since it normally grows in wet shaded areas (Aguilera, 2001). The differences found in volume in a species that grows in more than one UMAFOR are attributed to differences in the residual density, caused mainly by the application of silvicultural treatments (Larson, 1963), to the type of soil and precipitation. Castedo, Barrio, Parresol, and Álvarez-González (2005) recommended a different equation for modeling the height-diameter relationship of Pinus pinaster Ait in some forest regions of northern Spain. Calama et al. (2003) also propose different equations of site index for Pinus pinea L. in forest regions of Spain. To date, no studies have been reported in Mexico to evaluate regional differences in some type of forest growth models, so there is a need to perform other studies confirming the results found, especially for the species P. strobiformis, because in this study there was an adequate sample size only for two UMAFOR (1006 and 1008).
Table 6 shows the estimates of the parameters derived from equation systems fit, the adjusted coefficient of determination (R2aj) and the root mean square error (REMC) for the different equations that integrate the systems of additive volume equations developed in this study. These systems of equations explained on average 97, 34 and 96 % of the variance observed in the stem volume, branch volume and total tree volume, respectively.
Table 6 Paramter estimates of the volume equation systems developed in this study for 12 timber species in Durango.
| Species | Parameter estimates | vrta cc | vramas cc | vta cc | ||||||
|---|---|---|---|---|---|---|---|---|---|---|
| β 0 | β 1 | β 2 | β 3 | REMC | R 2 aj. | REMC | R 2 aj. | REMC | R 2 aj. | |
| 1 | 0.000058 | 1.934384 | 0.986875 | 0.000059 | 0.131 | 0.98 | 0.105 | 0.35 | 0.165 | 0.97 |
| 2 | 0.000061 | 1.970438 | 0.916467 | 0.000042 | 0.140 | 0.98 | 0.070 | 0.34 | 0.153 | 0.98 |
| 3 | 0.000063 | 1.973039 | 0.908113 | 0.000031 | 0.198 | 0.98 | 0.072 | 0.18 | 0.208 | 0.98 |
| 4 | 0.000062 | 1.989640 | 0.884421 | 0.000044 | 0.111 | 0.98 | 0.081 | 0.31 | 0.132 | 0.98 |
| 5 | 0.000071 | 1.903127 | 0.939725 | 0.000048 | 0.119 | 0.98 | 0.078 | 0.29 | 0.14 | 0.97 |
| 6 | 0.000057 | 1.984667 | 0.922042 | 0.000061 | 0.097 | 0.99 | 0.086 | 0.33 | 0.132 | 0.98 |
| 7 | 0.000088 | 1.893291 | 0.862257 | 0.000084 | 0.086 | 0.97 | 0.081 | 0.36 | 0.131 | 0.95 |
| 8 | 0.000070 | 1.913666 | 0.894689 | 0.000036 | 0.102 | 0.98 | 0.053 | 0.27 | 0.112 | 0.98 |
| 15 | 0.000061 | 1.900093 | 0.984575 | 0.000064 | 0.135 | 0.98 | 0.097 | 0.40 | 0.185 | 0.97 |
| 41 | 0.000050 | 1.974851 | 0.928771 | 0.000065 | 0.115 | 0.97 | 0.111 | 0.27 | 0.157 | 0.96 |
| 42 | 0.000030 | 1.964724 | 1.101723 | 0.000168 | 0.084 | 0.95 | 0.185 | 0.48 | 0.196 | 0.89 |
| 66 | 0.000053 | 1.981578 | 0.887948 | 0.000078 | 0.065 | 0.95 | 0.046 | 0.55 | 0.084 | 0.94 |
1 = Pinus cooperi, 2 = P. durangensis, 3 = P. arizonica, 4 = P. leiophylla, 5 = P. teocote, 6 = P. engelmannii, 7 = P. lumholtzii, 8 = P. strobiformis, 15 = P. herrerae, 041 = Quercus sideroxyla, 42 = Q. durifolia and66 = Q. rugosa. vrta cc = Stem volumen over bark (m3), vramas cc = Volume of branches overbark (m3), vta cc = Total tree volumen overbark (m3), REMC = Root mean square error (m3) and R2aj = Adjusted coefficient of determination.
Conclusions
The results of the statistical tests corresponding to the additional non-linear squares method and the significance of the parameters indicate the need to use species-specific models for all analyzed tree species and regional models for 10 of the species studied. Additional tests to assess whether the existence of differences is caused by as few as two or as many as all nine species of the genus Pinus indicate that each species requires its own model, while comparisons among species of the genus Quercus indicate that Q. sideroxyla and Q. rugosa do not differ significantly. On the other hand, only 15 of 285 pairs (5 % of the cases) of the UMAFOR could not reject the hypothesis of a single model to evaluate regional differences in the volume of the species. According to the results, the species-specific and regional models developed in this study are recommended for the following species: P. cooperi, P. durangensis, P. arizonica, P. leiophylla, P. teocote, P. engelmannii, P. lumholtzii and Q. sideroxyla; and a state model for P. strobiformis and Q. rugosa, until more data are available to confirm this result.

