


 texto em
  Inglês (pdf)
 Artigo em XML
 Referências do artigo
 Enviar este artigo por email
 Citado por SciELO
  Similares em
SciELO
Similares em
SciELO 
 Permalink
Introduction
One of the most widely distributed conifers is the Scots pine (Pinus sylvestris L.), which has a range that extends along vast areas within Asia and Europe. A wide variety within this natural range is covered by this tree, and this helps to reflect the variability in productivity that is often displayed by this species (Boratynski, 1991).
The Scots pine extends as far North along the Norwegian coast as 70 °N, and as far south as the Sierra Nevada of Spain at 37 °N. The longitudinal range, spreading over Siberia, covers most of Europe as far as 138 °E. While the Scots pine stands may be unevenly distributed, it actually contributes to the largest proportion of forests within Europe. Broken down, the total forest cover is 65 % for Finland (Sevola, 1998), 20 % for the high forests within the United Kingdom (Christie & Lines, 1979), and only 9 % of the total forested area within France (Bazire & Gadant, 1991). Pinus sylvestris covers 0.32 % of the forests in Greece (Ministry of Agriculture, 1992). In a comparison study, Christie and Lines (1979) charted the yield and growth data of the Scots pine around Europe, and reviewed the national mean of annual increments that ranged to more than 18 m3∙ha-1∙yr-1. As all of these figures reference the optimal fertility conditions from a national level, any observed difference can be attributed primarily to climatic factors. As attempted by several other studies, an interpretation can be drawn from differences in structural traits, physiological responses, and differences in growth. All of this was done in order to identify which key and limiting factors are intraspecific, and climate-driven adjustments for the Scots pine (Mencuccini & Bonosi, 2001; Poyatos et al., 2007).
Our main concern, however, was how the difference in latitude and climate could lead to a difference in productivity. Productivity is commonly estimated in terms of volume; tree volume is usually calculated from individual tree regression models, using the breast height diameter and the total height as predictors (Van Laar & Akça, 2007). Therefore, in order to address and answer the question of productivity of Scots pine in Europe, a method of meta-analysis of individual tree volume estimation regression models, was applied.
Nowadays, the production rate and enrichment of knowledge is very rapid. The plethora of publications and the large volume of information make it difficult to evaluate and implement a research practice based on documented evidence. Under these circumstances, it is vital for the preservation of the quality of scientific publications. Authors and publishers are required to follow specific instructions and methods in order to ensure the usefulness and validity of existing information (Borenstein, Hedges, & Higgins 2009).
Conducting a meta-analysis is based on scientific principles and on the formulation of rules that must be followed by researchers/writers to minimize the mistakes, which, by definition, exist in every scientific paper (Borenstein et al., 2009). The aim of this work was to apply the method of meta-analysis in volume estimation models of Scots pine (P. sylvestris), to become a quantitative synthesis of data from different studies dealing with the same subject; to estimate a total - summary score from all studies (pooled effect); and to detect the existence of disputes between (heterogeneity) studies.
Materials and methods
Many researchers have proposed specific guidelines for conducting meta-analyses (Borenstein et al., 2009; Cooper, 2010; Lipsey & Wilson, 2001). The stages of meta-analysis in this paper are described below.
Definition of the problem - definition of effect size
In order to have a quantitative synthesis of different studies that estimate P. sylvestris volume, we have to standardize the dependent variable, i. e. the volume. In meta-analysis, the effect size (ES) is the dependent variable, which standardizes the findings in studies so that they can be compared directly. Each standard can be a variable effect size (e. g. the standardized mean difference, the correlation coefficient, the probability ratio) because the variable is comparable in all studies, represents the size and direction of the relationship that interests us and is independent of the size of the sample. Different meta-analyses may use different effect size variables. In this study, we used as ES the estimated volume of a tree with breast height diameter 41 cm and a total height of 24 m; these are the average breast height diameter and total height of the sample trees in the study of Kitikidou, Milios, and Lipiridis (2014). This work was used as reference, because the vast majority of relative European studies included these measurements (41 cm and 24 m) in their ranges for breast height diameter (D) and total height (H), respectively. The only conversion that was applied in the volume estimation models was the unit measurement; all models were converted to calculate the volume in m3.
Recovery studies
It is vital for there to be explicit criteria for inclusion and exclusion of studies participating in meta-analysis. There is a methodological dilemma: should low quality studies be included or excluded? If we are too strict, then we might limit the ability of generalization. On the other hand, if we include easy studies, then the accuracy of the conclusions can be weakened. Therefore, we must achieve a balance appropriate to the research question (Borenstein et al., 2009).
For the meta-analysis of volume (v) estimation for P. sylvestris in Europe, we collected all European studies, which describe individual tree volume estimation models. As a reference tree, we used a tree with breast height diameter of 41 cm and total height of 24 m. These dimensions are the averages of the sample trees in the study of Kitikidou et al. (2014); all European studies included in the meta-analysis had to have these measurements (41 cm and 24 m) in their ranges for breast height diameter (D) and total height (H), respectively. The use of a reference tree is essential, in order to have comparable volumes, i. e. the 41 cm, 24 m is an auxiliary pair of D, H values, for selecting studies with comparable D, H ranges. Eight models were included in the meta-analysis, retrieved from Google Scholar <http://scholar.google.com>, for the period 1900-2015 (Table 1).
Table 1 Descriptive statistics of the eight studies participated in the meta-analysis for Pinus sylvestris volume estimation.
| No. | Study | Equation | D min (cm) | D max (cm) | H min (m) | H max (m) | Sample size n | Estimated volume (m3) of a tree with D = 41 cm and H = 24 m |
| 1 | Laasasenaho (1982) | V = -2.2945 + 2.57025 * LN(D) | 0.9 | 50.6 | 1.5 | 28.3 | 2,050 | 1.007 |
| 2 | Laasasenaho (1982) | V = -5.39417 + 3.4806 * LN (2 + 1.25 *D)-0.039884 * D | 0.9 | 50.6 | 1.5 | 28.3 | 2,050 | 1.006 |
| 3 | Laasasenaho (1982) | V = 0.036089 (D 2.01395) (0.99676 D ) (H 2.07025) [(H-1.3)-1.07209] | 0.9 | 50.6 | 1.5 | 28.3 | 2,050 | 1.416 |
| 4 | Laasasenaho and Sevola (1971) | V = -2.37912 + 2.62903 * LN(D) + 0.000126 (D 2) | 7.0 | 50.0 | 5.0 | 28.0 | 1,291 | 1.007 |
| 5 | Corona and Ferrara (1987) | V = 1.480589 (D 1.982459514) (H 0.742674501) | 13.0 | 49.0 | 7.0 | 27.5 | 114 | 0.046 |
| 6 | Näslund (1947) | V = 0.1028 (D 2) + 0.02705 (D 2) H + 0.005215 (D 2) H | 5.0 | 49.9 | 3.0 | 32.9 | 4,421 | 1.474 |
| 7 | Näslund (1947) | V = 0.1072 (D 2) + 0.02427(D 2) H + 0.007315 * D(H 2) | 5.0 | 49.9 | 3.0 | 32.9 | 2,390 | 1.332 |
| 8 | Kitikidou et al. (2014) | V = 0.318 (D 2) H | 19.0 | 72.0 | 17.0 | 41.0 | 158 | 1.282 |
V: Volume, D: Diameter, H: Height
Analysis of effect size
Suppose we have a set of independent variables ES that have transformed and/or adapted, if necessary, for each ES for which we have a weighted variance w reverse. The average ES is equal to:
the standard error of the mean is:
The 95 % confidence interval is calculated as lower bound = ES - 1.96(se
ES
) and upper bound = ES + 1.96(se
ES
); the homogeneity analysis checks whether the assumption that all sizes estimate the average population itself applies. As you would expect, this case rarely applies, since different studies estimate differently the ESs. If you calculate the totals:
If the computed Q is less than the critical value of χ2 with known df and P-value (e. g. 0.05), we cannot reject the null hypothesis of homogeneity test. In this case, the variance in all sizes not exceed the expected result based on the sampling error. In addition to the Q, the heterogeneity can be controlled with the inconsistency index:
According to a very coarse categorization if 25 ≤ I 2 ≤ 50 % then the heterogeneity can be called small, if 50 < I2 ≤ 75 % moderate and I 2 > 75 great (Higgins, Thompson, Deeks, & Atman, 2003).
Graphs in meta-analysis
To detect if there is a systematic error of publication (publication bias). If the selection of the studies involved in the meta-analysis were biased according to score, used the graph of the inverted funnel (funnel plot) (Egger,Smith, Schneider, & Minder 1997; Sterne and Egger, 2001). The horizontal axis is the output size and vertical ES “study size” (sample size, standard error, or weighted reverse variation), so each point in the graph represents a study. If there is no publication error, graph is symmetrical. The funnel plot receives great review, because if the effect size of an s-s study is different because of different “study size”, then this graph can be misleading (Lau, Ioannidis, Terrin, Schmid, & Olkin, 2006).
It has been developed a graphical method, the so-called forest plot, for detecting heterogeneity (Panagiotakos, 2006). In this graph, we can visually examine the overlap of confidence intervals for individual studies in a meta-analysis. In a typical forest plot, the results of studies are represented by squares, while the ends of the horizontal line in each square represent the limits of the confidence interval for each study. The overall assessment of the meta-analysis for the study of the intensity of the relationship between studies and of confidence intervals is placed at the base of the diagram, with a distinct vertical line. The vertical line represents the average of ES or some other value.
Fixed effects and random effects models
If we consider that excessive variation in result sizes derived from random differences between studies (sources that cannot identify or count), you must use a model of fixed effects (Mantel & Haesnszel, 1959).
The fixed effects model weights each study with the inverse of the sampling variance:
In a random effects model (DerSimonian & Laird, 1986) we found that the effect sizes come at random from a larger number of effect sizes (including surveys). The random effects model, weighting each study with the inverse of the sampling variance and a constant that represents the variation of the effects in the population, is:
where
The component of variance of random effects based on Q; Q calculation type in the random effects model is:
The biggest difference you will notice by comparing the results of random and fixed effects models is the significance levels and confidence intervals. The confidence intervals in random effects models are larger, while effects were significant in the model of fixed effects may not be significant in the random effects model. If the sample size is associated closely with the effect size, then the mean ES will differ between the two models.
Results and discussion
Table 2 shows the statistics of the meta-analysis. The eight models that estimate the volume of P. sylvestris (Table 1) were significantly heterogeneous, since the estimated Q was greater than the critical value of I2, if we accept that differences between studies are random and cannot be measured. In this case, namely the fixed effects model, the heterogeneity is great (I2 = 99.8 %). In contrast, if we accept that the eight models were selected at randomly from a number of studies, i. e. applying random effects model, the heterogeneity is null (5.259 < 14.067 and I2 = 0). At this stage, it looks more like the model of fixed effects, taking into account that we made in the meta-analysis of all available studies that meet our criterion (models have ranges of breast height diameter D and heights H that include tree with breast height diameter of 41 cm and total height of 24 m). At this point, we should note that the comparison of studies refers to their D, H ranges, not the specific D, H pair of values 41 cm and 24 m. The average effect size does not seem to vary between fixed effects models (1.025) and random effects (1.071), which mean that the sample size does not seem to be highly correlated with the effect size.
Table 2 Statistics of the meta-analysis of the eight models for Pinus sylvestris volume estimation.
| Statistic | Fixed effects model | Random effects model | Number of models (k) | Degrees of freedom | Critical value χ2 (P-value) |
| Q | 3,353.167 | 5.226 | 8 | 7 | 14.067 |
| I2 | 99.791 | 0.000 | |||
| / | 1.025 | 1.071 | |||
| / | 0.008 | 0.187 | |||
| Confidence interval (lower-upper bound) | 1.008-1.042 | 0.705-1.437 |
Q: Cochran’s statistic, I2: inconsistency index, EQ \x \to(ES) : mean Effect Size, se EQ \x \to(ES) : standard error of the mean of the effect size
In the funnel plot (Figure 1), there seems to be a publication bias (spots are not forming an inverted triangle). With grey we symbolized the study in Italy (Corona & Ferrara, 1987), green for Finland (Laasasenaho, 1982; Laasasenaho & Sevola, 1971), brown for Sweden (Näslund, 1947) and blue for Greece (Kitikidou et al., 2014). If we look at the study coming out outside the triangle, namely study no. 5 in Italy, we see that it has the smallest sample size, just 114 trees (Table 1), which may create a misleading funnel plot regarding the publication bias, i. e. spots are not forming an inverted triangle due to the small sample size of one study, not due to biased selection of studies.
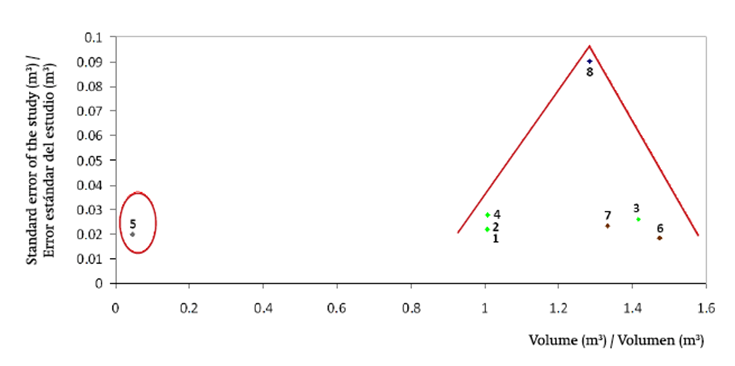
Figure 1 Funnel plot of the eight models included in the meta-analysis for Pinus sylvestris volume estimation in Europe. Study numbers 1-4 represent studies in Finland, 5 corresponds to Italy, 6 and 7 to Sweden and 8 to Greece.
In the forest plot (Figure 2), the center line represents the average of the studies, i. e. the average estimated volume of eight models, with tree breast height diameter of 41 cm and total height of 24 m. As in Figure 1, with grey color, we symbolized the study in Italy (Corona & Ferrara, 1987), using green for Finland (Laasasenaho, 1982; Laasasenaho & Sevola, 1971), brown for Sweden (Näslund, 1947) and blue for Greece (Kitikidou et al., 2014). There is a clear tendency for large volumes (well above average) in Greece and Sweden, while below average seems to be the volumes of P. sylvestris trees in Finland. Italy clearly has smaller volumes compared to the rest of Europe. In addition, observing the boundaries of the horizontal line errors, we find that the study in Greece shows a great confidence interval, which is due to the large standard error and thus the small sample size (165 trees), in relation to other studies.
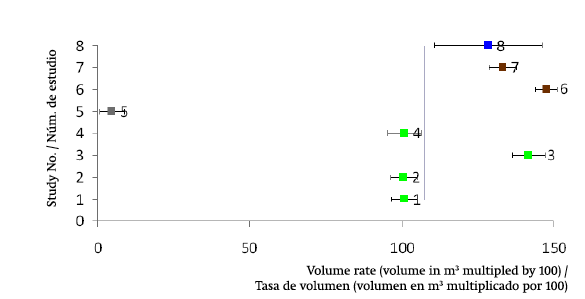
Figure 2 Forest plot of the eight models included in the meta-analysis for Pinus sylvestris volume estimation in Europe. Study numbers 1-4 represent studies in Finland, 5 corresponds to Italy, 6 and 7 to Sweden and 8 to Greece.
The systematic review and meta-analysis offer a reassessment of research data that refers to a particular scientific issue that emerged from various studies. The application of meta-analysis in forestry can help us in the following (Kitikidou, Milios, Stampoulidis, & Papageorgiou, 2013; Papakosta, Kitikidou, Bakaloudis, & Vlachos, 2014): enables the synthesis of a large number of forest research findings; may highlight gaps in the literature search, providing a solid foundation for the next generation of research into a forest theme; demonstrates the importance of repetition of an investigation; facilitates the generalization of knowledge acquired with short-range surveys.
In the meta-analysis conducted in this research, using volume estimation models for Scots pine (P. sylvestris), we found that:
The quantitative synthesis of data from different studies showed that Italy needs further investigation.
One study from Corona and Ferrara (1987) isn’t enough for clear conclusion (probably the sample size of this study is small).
By calculating a total - summary result from all studies (pooled effect), we found an average volume of P. sylvestris tree with breast height diameter of 41 cm and total height of 24 m equal to 1.072 m3, while a tree with these dimensions, in the study of Kitikidou et al. (2014), had a volume of 1.153 m3. The large confidence interval, however, should be pointed out for the study in Greece. This is probably the result of the influence of two factors; firstly, different growth conditions, leading in different form factors of trees (Kitikidou et al., 2014); secondly, small sample size (158 trees).
Concerning the heterogeneity between studies, if we consider that all appropriate and available studies were used, then heterogeneity is great (I2 = 99.8 %). The heterogeneity is maintained, even if we remove the study in Italy from the set of the eight models (in this case, the calculated I2 equals to 99.1 %). In general, the sample size does not seem to be highly correlated with the effect size, i. e. the volume.
Stand density affects the form of trees. Low stand densities lead to higher tree taper (Philip, 1994; Smith, Larson, Kelty, & Ashton, 1997). Moreover, the position of a tree in the stand influences its form, since suppressed and pure in vigor trees exhibit low taper trees, while dominant trees have high taper (Smith et al., 1997). The above-mentioned is the result of the tree ring distribution along the stem (see Smith et al., 1997; Wilson, 1984). Conditions of competition affect the distribution of diameter growth at different heights up to the bole, influencing the form and taper of a tree, while the taper of a tree changes, as growing conditions change during its life (Smith et al., 1997; Wilson, 1984).
A tree with high taper has lower volume compared to a tree with low taper, having the same breast-height diameter. As a result, volume differences among European forests may be due to different competition conditions, regarding stand densities and tree positions, and not of different geographical conditions (climate). That may be the reason for the Greek study to be relied between the volumes of Scandinavian studies, as shown in Figure 1. Different competition conditions reflect the result of different stand dynamics and thinning regimes (Oliver & Larson, 1996; Smith et al., 1997).
Conclusions
From the meta-analysis for the volume of P. sylvestris in Europe, the following conclusions are extracted: more research could be useful in Italy (volumes seem to be remarkably small). In Greece, there are large volumes of the species, comparable with those of Sweden; however, a Greek study with a larger sample size could contribute to the promotion of research. There is great heterogeneity among stands in Europe, regarding species’ volume, which indicates different competition conditions as the result of different stand dynamics and thinning regimes, which affected the taper of trees during their lives. For further research, the application of meta-analysis with use of effect size for meta-analysis of variance (meta-ANOVA) and meta-regression is proposed.

