


 texto en
  Inglés (pdf)
 Artículo en XML
 Referencias del artículo
 Enviar artículo por email
 Citado por SciELO
  Similares en
SciELO
Similares en
SciELO 
 Permalink
Introduction
Due to the increased variability of the climate in the last three decades (Hansen, Sato, & Ruedy, 2012), more understanding on the relationship between tree-ring width, basal area growth and climatic variables is needed to propose better forest practices. Establishing relationships between tree-ring measurements and basal area increments (BAI) with climatic variables allow the identification of patterns in tree growth. Forest growth depends on tree species, age, stand density, soil quality and climate (Skovsgaard & Vanclay, 2008), and the combined effect of these factors is registered in the ring width of forest species (Esper, Benz, & Pederson, 2012; Matisons, Elferts, & Brūmelis, 2013). Tree-rings of climate sensitive species preserve information about cyclic patterns of tree growth and climate relationships, providing useful information for modeling and forecasting purposes (Matisons et al., 2013; Návar & Lizárraga-Mendiola, 2013).
One of the most important species for dendrochronology purposes has been Douglas-fir (Pseudotsuga menziesii [Mirb.] Franco), due to its sensitivity in capturing signals of cyclic events of climate (Cerano, Villanueva, Valdéz, Méndez, & Constante, 2011; Griesbauer & Scott, 2010; González-Elizondo et al., 2005; Gugger, González-Rodríguez, Rodríguez-Correa, Sugita, & Cavender-Bares, 2011) but the reliability of that periodicity has not been tested in forecasting models. Time series analysis of tree species like Douglas-fir would also help to confirm extreme past events in atmospheric circulation patterns, water resources shortage, and its socioeconomic impact on the population (Cerano et al., 2011; Návar & Lizárraga-Mendiola, 2013). More recently, the use of time series analysis combined with wood isotopes and dendrochronology have showed to be useful to describe the relationship of tree physiology and climate variability according to increased atmospheric CO2 (Monserud & Marshall, 2001; Roden, Johnstone, & Dawson, 2011; Swetnam & Lynch, 1993).
Basic dendrochronology procedures use standardized the ring width index (RWI) to analyze trends in tree growth; nevertheless, when dominant trees with trunks of circular section are selected, direct measurements of BAI are highly correlated to RWI, allowing the study of tree growth trends overtime. Compared to ring with BAI is more convenient to separate tree growth rates because is a two-dimensional variable (Biondi & Qeadan, 2008). When tree-ring series are transformed into basal area increments (BAI) the practical use is that BAI has units in cm2•year-1 which allow direct interpretation of the tree growth trends; compared to BAI, RWI values are relative units and dimensionless (Rubino & McCarthy, 2000).
Time series analysis tools are frequently used in econometric studies, however, due to recent climate variation and its effects on tree growth, the use of time series analysis should be revaluated as a powerful tool to understand climate change and tree growth relationships.
This paper aimed to analyze trends for BAI of mixed stands of Douglas-fir using time series models to forecast tree growth for the next decades. Our hypothesis is that: BAI series of P. menziesii in the Western Sierra of Mexico reflect regional climate events and are reliable to build a time series model to explain and forecast tree basal area growth.
Material and methods
Study area
The study site is located in the Western Sierra of Mexico in the Chihuahua state (26° 27’ 59.14’’ N and 106° 21’ 14.95’’ W). The altitude ranges from 2,650 to 2,730 m and the climate is temperate sub-humid, with mean annual temperature and precipitation of 12 °C and 780 mm, (Figure 1). Associated tree species of the study site are Picea chihuahuana Martínez, Pinus arizonica Engelm., Pinus durangensis Martínez and Pinus ayacahuite Ehrenb. (García-Arévalo, 2008; González, González, & Márquez, 2007). There is not logging in the study area; it has been under conservation as P. menziesii is an endangered species according to Mexican regulations (NOM-059-SEMARNAT-2010). Total height of the individual of Douglas-fir range in the upper stratum range from 23 to 45 m, with DBH (diameter at breast height) from 60-104 cm. The mixed stand of the study area has an estimated stock of 8.4 m3•ha-1 of bole of the study species.

Wood core sampling
In summer of 2012, 20 healthy and dominant trees carefully selected by their circular section of the bole were sampled with a 12 mm borer (HAGLÖF, BS009, Germany). For each tree, one sample in transversal direction to the slope was collected at 1.3 m above the soil level. In the study site, Douglas-fir is present in mixed and open stand where the canopy cover ranges from 60 to 80 %. Collecting dominant and mature trees we assured lower variation for BAI as the basal area growth of Douglas-fir plateau and remain constant up to the age of 300 years (Poage & Tappeiner, 2002). We avoid old trees close to the biological age of the species because they have low growth rates overtime and poor relationship with climate variation (Black, Colbert, & Pederson, 2008).
Sample measurements
Samples were air dried and polished with sand paper for better contrast of tree-rings. Ring width was measured with a Velmex measuring system (Bloomfield, NY, USA) with a 0.001 mm accuracy (Robinson & Evans, 1980). Increment cores samples were processed following standard dendrochronology techniques (Stokes & Smiley, 1968). Most of the wood core samples included the pith (75 %) and the age of trees without pith was estimated by regression according to the trend of the rings of trees with known age. The total number of tree-ring measurements was 2,480. The average age for the sampled trees was 140 years, ranging from 67 to 203 years. The intercorrelation of the tree-ring measurements series of the wood cores was statistically tested with the COFECHA software (Holmes, 1983). A negative exponential model was used to standardize the ring series for each tree and to develop a tree-ring width chronology using the ARSTAN software (Cook & Holmes, 1984). The “spline” for tree-ring indices was fitted with a ten-year resolution.
Basal Area Increment (BAI) and Precipitation data
Basal area increments (BAI) were computed according to the following formula, where R is stem radius (cm) and n is the year of ring formation:
BAI increases in mature stages tend to be stable as long as the tree is not close to the extremes of juvenile stage or the biological senescence (Poage & Tappeiner, 2002; Weiner & Thomas, 2001). Although the age of sampled trees varied from 64 to 204 y, their age is far from the biological senescence for the study species which is at about 300 years (Villanueva-Diaz et al., 2010). In order to construct a representative BAI series for the study site, we averaged the BAI values at a yearly resolution for all samples. The maximum length of the BAI chronology was 203 years (1807 to 2010). The BAI and the standardized tree-ring with series (RWI) were tested for significant correlation (P < 0.05). Furthermore, the RWI and BAI chronology was related with the regional precipitation, for which the program DENDROCLIM 2002 was used (Biondi & Waikul, 2004). We used the information from the four closest meteorological stations as reported by the National Commission for Water in Mexico (Instituto Mexicano de Tecnología del Agua [IMTA], 2013). Additionally, to remove the effect for different tree ages, we reordered the data from calendar year to cambial age and fitted a five order polynomial equation to estimate the expected BAI according to the mean tree age in our sample (Briffa & Melvin, 2011).
Spectral analysis
A spectral analysis was performed to identify cycles of BAI. The time series was decomposed into the sum of sine and cosine waves with different amplitudes and lengths (Jenkins & Watts, 1968; Priestly, 1981):
Where:
xt = |
Data |
a0 = |
Mean term: |
m = |
Number of frequencies in the Fourier decomposition |
ak = |
Cosine coefficients |
wk = |
Fourier frequencies: |
t = |
Time subscript |
bk = |
Sine coefficients |
The Fisher’s Kappa and Bartlett´s Kolmogorov-Smirnov statistics were computed for the BAI chronology assuring that the series and the spectrum were not “white noise” and were statistically significant. In addition, spectral density and periodogram graphs were developed and tested to determine the presence of significant low-frequency cycles. The spectral density estimate was produced by smoothing the periodogram.
ARMA and ARIMA Box-Jenkins models
ARMA (p, q) Box-Jenkins models rely on second-order stationary; the presence of p autoregressive terms (AR) and q moving average parameters (MA) help to explain the behavior of the response variable (Box & Jenkins, 1970).
Where:
Zt = |
Mean deviation in time t of an equally spaced stationary series |
ϕi and ϕp = |
Auto-regressive terms (ϕp(B)=1-ϕiBi-…-ϕpBp)) |
B = |
Backshift operator |
θj and θq = |
Moving average terms(θq(B)=1-θjBi-…-θqBq)) |
ut = |
Randomly independent variables with zero mean and variance (white noise) |
Second-order stationary models are mean [E(Zt) =µ], variance [Var(Zt) = σ2] and covariance [Cov(Zt,Zt) = γk] not time dependent. One extension to the ARMA models is the class of autoregressive integrated moving average, or ARIMA process with dth difference. The d term is the number of times the series must be differentiated to be stationary. The stochastic trend can be removed applying a difference operator ∇d:
where Xt is the d times differenced series to be transformed into stationary series and Zt is the original series. The augmented Dickey-Fuller test of unit root proves that the time series is stationary, testing the hypothesis H0: ρ = 1 and the alternative H1: ρ < 1. If non-stationarity is associated with a variable variance we can use a transformation of power type InZt (Pankrats, 1983). It should be noticed that when it is necessary to remove trend and variable variance, the transformation of actual values into logarithms is required before the differentiation.
ARIMA models can describe cycles for annual data. It is convenient to use a cycle difference
operator
where Wt is the D times differenced series (length of the cycle C). Cyclical effects ARIMA models can be proposed under the following general model ARIMA (p, d, q) x (P, D, Q)C :
Where:
ϕp (B) = |
Noncyclic AR operator |
θq(B) = |
Noncyclic MA operator |
ϕP(BC) = |
Cyclic AR operator of length C |
ϴQ(BC) = |
Cyclic MA operator of length C |
|
Differencing operators for non and cyclical compounds |
In this work, we analyzed BAI chronology by autoregressive integrated moving average models (ARIMA Box-Jenkins Models) to find major cycles or periodicity in tree growth.
Estimation of ARIMA model components
The ARIMA modeling involved the comparison of estimated autocorrelation function graphs (ACF) and partial autocorrelation (ACFp) with theoretical ACF and ACFp. The pattern of decay of those functions and the lags with significant values are components to determine the order of parameters for the ARMA model (Box & Jenkins, 1970). We used the ACF to determine the moving average (MA) order (q) and the ACFp was used to determine the order (p) of the autoregressive model. Complementarily, the smallest canonical (SCAN) correlation method was used. This process is helpful to identify the orders of a stationary and non-stationary ARMA model. In general this method consist in identifying a rectangular pattern of a table which has the eigenvalues of a matrix product of the vector Ym,t = (Zt, Zt-1,... Zt-m) where Zt is time series, such that m = Pmin,...,Pmax and j = qmin,...,qmax; where m and j identify the possible order of the AR and MA process, respectively (Tsay & Tiao, 1984). Finally, the estimation of parameters was performed using conditional least squares (CLS) (Statistical Analysis System [SAS], 2011).
Strategy for diagnostic, checking and forecasting
The results of spectral analysis were considered to test the different cyclic component (C) of the ARIMA process and generate an appropriate model for understanding the behavior of tree growth. The statistical reliability of the model was verified through a chi-squared test (Ljung-Box test) by assuring that random shocks and ut were statistically independent (not autocorrelated) and “white noise”. The forecast was calculated with the infinite memory forecast, also called conditional forecast. The term conditional is used because the forecast is computed by assuming that the unknown values of the response series before the start of the data are equal to mean of the series. We performed a forecast of BAI for the next 15-year period and up to the year 2090 at the 95 % confidence level.
Results and discussion
Tree ring series, BAI and precipitation
Results showed that our strategy for selecting dominant and circular trunk section trees was reliable for dendrochronological purposes. The strength of the signal in ARSTAN was high with a value of 0.90, indicating the existence a common response in all the trees sampled (Cook, 1983, 1987). The inter-correlation for the series and the average mean sensitivity computed with COFECHA were adequate (P < 0.01), with values of 0.67 and 0.27, respectively. These values indicate that the ring measurements show a common trend and the suitability for cross-dating of the series (Figure 2a). The correlation between RWI and BAI was statistically significant (r = 0.80; P < 0.01) indicating that in this case direct BAI measurements are reliable to describe tree growth changes and useful for time series analysis (Figure 2b). RWI and BAI were also significantly (P < 0.05) correlated to the precipitation for the period January to July with values of 0.73 and 0.70, respectively. These results also confirms the sensitivity of Douglas-fir to climate variability and the suitability to use their tree ring series to predict tree growth series, as it has been found for P. menziesii trees growing in Durango and Zacatecas, Mexico (González-Elizondo et al., 2005).

Tree growth trends
Mean BAI of P. menziesii was 54 cm2•year-1 (SD ±12). This result is similar to that reported for stands of Douglas-fir growing western Oregon where trees age ranges from 100 to 300 years and plateau at 50 cm2•year-1 (Poage & Tappeiner, 2002). Our findings show a trend of reduced BAI overtime, which is an unexpected results because the sample was composed by healthy and dominant trees with average age of 140 years (range, 67-204 years); this is 150 years less than the natural senescence of the species. A reduction in BAI has also been reported for other forests suggesting that water and nutrient stress are one of the stress factors (Gomez-Guerrero et al., 2013; Park et al., 2013; Peñuelas, Canadell, & Ogaya, 2011; Silva, Gómez-Guerrero, Doane, & Horwath, 2015). A strong link between growth diameter and moisture has also been found for P. menziesii at the Eastern Sierra of Mexico with larger deviations in diameter growth according to extreme wet and dry episodes (Arreola-Ortiz, 2010).
Analyzing the results at a decadal resolution the reductions in BAI with respect to the previous decade, were 24 and 28 % for the periods of 1890-1899 and 1950-1959, respectively. Favorable periods resulted in increased BAI of about 16 % above the mean value (Figure 3a). In a percent basis and absolute values, the impact of favorable periods is lower than that of dry periods because the benefit of wet periods on BAI is limited to the water storing capacity of the soils (Castruita, 2014). The decadal drought spell of the 1950’s and 1990’s has also been reported in river flow analysis in Mexico (Návar, 2012) and soil moisture content evaluations using hydrological models (Návar, 2015).

Figure 3: (a) Mean basal area increment (BAI) trend according Chapman-Richards equation Y=(1-e-0.0043*t)1.1 P < 0.05 and (b) BAI and cambial age by age classes.
The reduction in BAI seen in this study is not related to the age of the trees because according to the cambial age in Figure 3b, the expected average in BAI for trees 140-year old is 50 cm2•year-1, very close to the mean value of 54 cm2•year-1. Thus, the reduced trend in BAI overtime is more likely due to the climate effect because RWI and BAI were statistically correlated and the precipitation from January to July. According to our results, water stress by major droughts might be the reason for important reductions of BAI in 1893, 1953 and 1996 to values of 23, 19 and 25 cm2•year-1, respectively. Prolonged droughts has been reported for these years; for example, a severe dry period around the year 1950 has been documented in North México (Díaz, Therrell, Stahle, & Cleaveland, 2002) affecting the south of United States and that for middle of the 90´s has also been detected in Taxodium mucronatum (Ten.) trees in Central Mexico (Stahle et al., 2009; Stahle et al., 2011).
New revisions for the standardization of tree-ring measurements suggest that the selection of dominant trees could lead to overestimations in tree growth (Nehrbass‐Ahles et al., 2014). We think that this is not the case of our sample of trees because ordering the data according to cambial age we did not see a disproportional difference in BAI between age classes, especially after the cambial age have reached 50 years (Figure 3b). The decreasing trends in tree growth sometimes is due to the inclusion of long-lived trees with slow growth rates (Black et al., 2008). However, the oldest age class of trees in this study (181-204 years) show expected BAI of 50 cm2•year-1 at cambial ages of 150 years, supporting that our sample was composed by mature (no old) trees with average growth rates for this age.
Spectral Analysis and Periodicity
The Fisher’s Kappa (P < 0.05) and the Bartlett´s Kolmogorov-Smirnov statistic were statistically significant (P < 0.0001), indicating that the series and their spectra are not white noise and the analysis is unbiased (Fuller, 1976). Results indicated periodicities of 7, 21, 27 and 60 years (Figure 4). Because we are analyzing a biological process, these periodicities represent approximated cycles. However, what is very remarkable is that the last cycle is in agreement with droughts recurrence of 60 years reported for northern Mexico (Cerano et al., 2011). Although it is difficult to establish a direct relationship with global circulatory events, the fact that deserves special attention is that the cycles found here have showed to be compatible with ENSO (El Niño Southern Oscillation) and PDO (Pacific Decadal Oscillation) cycles (Hare & Mantua, 2000; Návar & Lizárraga-Mendiola 2013; Trenberth, 1997). One explanation for this results might be the sensitivity of the study species in relation to moisture variations influenced by regional events (Griesbauer & Scott, 2010; Návar, 2015). Our results match with cycles of 7, 21 and 60-y associated to other global circulatory events like ENSO, PDO and AMO (respectively), as suggested by other authors (Návar & Lizárraga-Mendiola, 2013; Návar, 2015).

IAB Stationary transformation
The Dickey-Fuller Unit Root Tests and the autocorrelation function (ACF) of the original series indicated nonstationarity (Table 1). The transformation of the BAI into natural logarithm and its first difference (Yt) allowed that the series became grouped around the mean with a homogeneous variance. The logarithmic transformation is convenient to decrease heterocedasticity and the dth difference is suggested when the mean of series changes overtime (Pankrats, 1983). The ACF of the original Douglas-fir BAI chronology decays to no significant levels in three years, suggesting that the growth of the previous three years is correlated to current tree growth and diameter. Transformation and first differencing resulted in different trend of ACF, with significant negative autocorrelation at lag 1 year (Figure 5).
Table 1: Augmented Dickey-Fuller Unit Root Tests of the original BAI chronology.
| Type | Lags | Rho | Pr < Rho | Tau | Pr < Tau | F | Pr > F |
|---|---|---|---|---|---|---|---|
| 0 | 73.40 | 0.0013 | −4.80 | <0.0001 | 26.25 | 0.001 | |
| Single Mean | 1 | −49.21 | 0.0013 | −5.46 | <0.0001 | 14.97 | 0.001 |
| 2 | −53.23 | 0.0013 | −5.49 | <0.0002 | 11.58 | 0.001 | |
| 0 | −70.75 | 0.0005 | −6.09 | <0.0001 | 32.51 | 0.001 | |
| Trend | 1 | −73.06 | 0.0005 | −7.24 | <0.0001 | 18.70 | 0.001 |
| 2 | −89.03 | 0.0005 | −8.04 | <0.0001 | 15.16 | 0.001 |
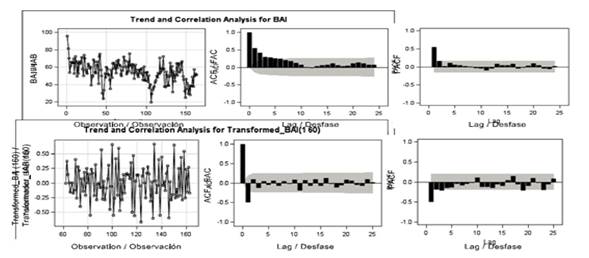
Identification and estimation ARIMA models
The pattern of decay for ACF and ACFp of the transformed BAI suggested a MA(1) model. The features of the model were defined by the spike at lag 1, that cuts off to 0 afterwards (Figure 5). The fact that the spike was negative with negative exponential trend (ACFp) indicates that θ > 0 (ACF) (Pankrats, 1983). This result was consistent with the smallest canonical (SCAN) correlation method that suggests an ARIMA (0,1,1) model. After considering the ACF and ACFp the selected model was ARIMA (0,1,1). This model has a moving mean parameter (q) involving random shocks, which is different from the AR(1) or ARMA (1,1) models that are frequently proposed for ring-width series (Meko, 1981). The selected model was evaluated with all the periodicities found (7, 21, 27 and 60) and without them to test their significance. Considering t and P values, all models were significant (C = 7, 21, 27 and 60). The moving average term (θ) for all cases was positive with values from 0.46 to 0.76, while the cyclic moving average term (Θ) varied from 0.45 to 0.83 (Table 2).
Table 2: Adjustment of models for Pseudotsuga menziesii.
| Model | Parameter* | Standard error | T value | Pr > |t| | Variance estimation | Standard error of the estimation | AIC** | SBC** | ||
|---|---|---|---|---|---|---|---|---|---|---|
| θ 1 | ϕ 1 | ΦP/ΘQ | ||||||||
| ARIMA (0,1,1) | 0.503 | -- | -- | 0.068 | 7.38 | <0.0001 | 0.043 | 0.207 | -49.23 | -46.14 |
| ARIMA (0,1,1) (0,1,1)7 | 0.458 | -- | -- | 0.071 | 6.38 | <0.0001 | 0.050 | 0.225 | -20.01 | -13.92 |
| -- | 0.832 | 0.047 | 17.54 | <0.0001 | -- | -- | -- | -- | ||
| ARIMA (0,1,1) (0,1,1)21 | 0.647 | -- | -- | 0.065 | 9.97 | <0.0001 | 0.054 | 0.232 | -8.81 | -2.91 |
| -- | 0.645 | 0.075 | 8.53 | <0.0001 | -- | -- | -- | -- | ||
| ARIMA (0,1,1) (0,1,1)27 | 0.492 | -- | -- | 0.076 | 6.49 | <0.0001 | 0.063 | 0.251 | 11.75 | 17.56 |
| -- | 0.780 | 0.074 | 10.46 | <0.0001 | -- | -- | -- | -- | ||
| ARIMA (0,1,1) (0,1,1)60 | 0.764 | -- | -- | 0.065 | 11.59 | <0.0001 | 0.060 | 0.246 | 5.72 | 10.97 |
| -- | 0.448 | 0.166 | 2.70 | <0.0001 | -- | -- | -- | -- | ||
* θ1 is the noncyclic moving average term, ϕ1 is the noncyclic autoregressive operator, ΦP is the cyclic autoregressive operator of length C and ΘQ is the cyclic moving average operator of length C.
** Akaike’s information criterion (AIC) and Schwartz’s Bayesian criterion (SBC).
For forecasting purposes the selected model was ARIMA (0,1,1) × (0,1,1)60. Two reasons support this selection: 1) First, its statistical strength is reflected in the significance of its terms, no correlated residuals, the Akaike’s information criterion (AIC) and Schwartz’s Bayesian criterion (SBC) (lowest values), and reliable fitting of the data; 2). Second, the periodicity of 60 years has been related to global circulatory patterns by other authors for the studied species (Cerano et al., 2011) and has a major impact in the tree growth at the study area.
Forecast of BAI
With the best statistical and climatic ARIMA model [ARIMA (0,1,1) x (0,1,1)60], we performed a forecast for BAI in the next eight decades using the SAS 9.3 software (SAS, 2011), with the following equations:
Using coefficients from Table 2:
This model ponder BAI based on the function of random shocks, subtracting 76 % of the same component of the previous year, 45 % of the occurred 60 years ago and adding 34 % of the occurred 61 years ago. In the long term, the forecast indicates reductions of 72 % in BAI with an average of 15 cm2•year-1, and a recovery about the year 2025. However the projected growth in 2025 for this species is below the historical mean (54 cm2•year-1) suggesting a net reduction in growth for the next 75 years (Figure 6). Nevertheless, the amplitude for the confidence intervals limits the interpretation for several decades.
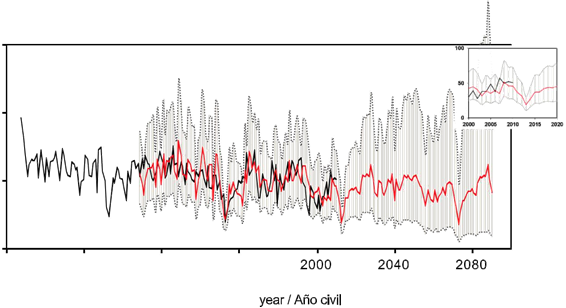
Figure 6: Extended forecast of basal area increment of Pseudotsuga menziesii from the ARIMA model. The black line is for real measurements and red line for estimations. The grey area defines the confidence interval at 95 %.
Because our results are assuming that the frequency of other stressing agents of the forests, such as pests and fires, remains constant, the health of the studied forest may be at risk with concomitant negative effects from other factors. The prevalence of healthy forests requires a base line study for tree growth as the one performed here.
Tree growth trends found here do not show indications of combined and beneficial effects on increased atmospheric CO2 and temperature as found in other studies (Soulé & Knapp, 2015). Our tree sample showed four phases of maximum tree growth which were decreasing overtime (approximately 1980-2000). The major implication of these results is the expected impacts of climate variation in the short-term future. The forecast of the model proposed is not considering implicitly climate variation and the trend for reduced tree growth may be an indication of a generalized response of the forest in other parts of the world (Silva, Anand, & Leithead, 2010).
We think that our data for BAI, RWI and precipitation were highly correlated because we used direct BAI for the year of ring formation. Regardless of the ages of the trees, all rings formed under the same environmental conditions reflect the strong effect of precipitation. Another reason is that tree growth rates derived from a wide span of tree ages included. According to some authors the analysis by cambial age indicated that BAI of Douglas-fir tends to be less sensitive to climate as tree ages (Black et al., 2008), but our results indicated that a sample composed by mature and dominant trees from open stands is reliable to detect a common signal in trees. One of the best methods for selecting a sample of trees for dendrochronological purposes and tree growth estimation is the random selection that include different ages and diameters (Nehrbass‐Ahles et al., 2014). We think that in that respect our selection method for tall and healthy trees in the mixed and open stands of Doulas-fir leads to a sample heterogeneous in age and diameters (40-104 cm) that worked well for the purposes of the study.
The approach used in this study shows potential to be used with other forests species to investigate climate change effects at geographical scales. The trends in tree growth we found are similar to that reported by other authors which indicated that extreme drought events like the ones in 1893 and 1952 were geographically important North Mexico and Southwest USA (Cerano et al., 2011; Stahle et al., 2009).
Although our study was not tested in a regional scale, our approach could have also some potential to correlate series of BAI with plant vigor indexes like the NDVI as proposed by other authors (Berner, Beck, Bunn, & Goetz, 2013). BAI series, should be reconsidered as proxy variable to study climate change effects particularly for sensitive forests species. Indeed, the new standardization process in dendrochronology proposes to standardize in terms of the stable BAI observed in the middle age of forests species (Biondi & Qeadan, 2008).
Conclusions
We found strong correlation among tree ring indices, basal area growth and precipitation for the studied species. Time series analysis of BAI of Douglas-fir of the Western Sierra of Mexico allowed identifying periodicity in tree growth which match with global atmospheric events like the ENSO cycles. The forecast for BAI indicates decreased tree growth within the present decade, although some degree of recovery will be reached by year 2025. However the projections of tree growth in the long-term will not be as high as that seen in the 1960s (60 cm2•year-1). The reduction in BAI seen in this study is not related to the age of the trees because we also analyzed the trends according to the cambial age. The use of time series analysis of BAI from dominant and mature trees can be helpful to predict future changes in tree growth and to propose in advance more suitable management practices.

