


 texto en
  Inglés (pdf)
 Artículo en XML
 Referencias del artículo
 Enviar artículo por email
 Citado por SciELO
  Similares en
SciELO
Similares en
SciELO 
 Permalink
Introduction
It is widely accepted that the diversity of plant species decreases as elevation increases; however, such a decline is not necessarily linear, since there are more species at intermediate elevations (Rahbek, 2005; Sánchez-González & López-Mata, 2005). In the specific case of ferns and lycophytes (Pteridophytes), some studies confirm the unimodal response in species diversity (Kluge, Kessler, & Dunn, 2006; Watkins, Cardelu, Colwell, & Moran, 2006). As elevation is an environmental variable that has no direct effect on plants (Körner, 2007), it has been proposed that the diversity of pteridophyte species is greater at intermediate elevations, because that is where the favorable conditions of high humidity and moderate temperature occur (Kluge et al., 2006).
Ferns and lycophytes represent an important structural component in forests, they are actively involved in forest regeneration, and they influence the light conditions in the understory and the availability of nutrients and water in the soil; therefore, both groups of plants are considered indicators of environmental quality (Karst, Gilbert, & Lechowics, 2005; Tejero-Díez, Torres-Díaz, & Gual-Díaz, 2014). Recent studies have focused on determining the richness, diversity and distribution patterns of ferns and lycophytes along environmental gradients in different regions and types of vegetation. The results of these studies indicate that regardless of the spatial scale analyzed, the diversity and distribution in both groups of plants are closely related to environmental humidity and topography (Jones et al., 2008; Karst et al., 2005; Sánchez-González, Álvarez-Zúñiga, & Tejero-Díez, 2010), and that at local scale, soil factors take on increased importance (Jones et al., 2008; Karst et al., 2005).
The mountain cloud forest (MCF) of Mexico is the type of vegetation with the greatest species richness per unit area (Rzedowski, 1978; Villaseñor, 2010). The distribution of MCF is discontinuous and fragmented into the form of archipelagos (Vázquez-García, 1995) and restricted to mountainous areas with very rugged terrain, where high humidity and moderate temperature conditions, ideal for the development of ferns and lycophytes, predominate (Tejero-Díez et al., 2014). The state of Hidalgo ranks third nationally in terms of area occupied by MCF. This type of vegetation is at serious risk of disappearing due to the increasing fragmentation resulting from land-use change and the lack of management and conservation plans (González-Espinosa et al., 2012; Villaseñor, 2010).
No studies on richness, diversity and distribution patterns of ferns and lycophytes at local or regional level in Mexico’s MCF fragments are known. In this context, the following objectives were set out: 1) to provide information on these patterns, along an elevational gradient in the MCF of Tlanchinol, Hidalgo, and 2) to establish the relationship of richness, diversity and structural importance values of both groups of plants, with respect to climatic and soil variables. It also proposes that climatic conditions characteristic of MCF represent an ideal natural model for testing whether: a) the soil and topographical factors are more important than climatic ones (temperature and humidity) to explain the diversity and distribution of ferns and lycophytes at local level, as suggested by Jones et al. (2008) and Karst et al. (2005), and b) the ecological preferences of both groups of plants are so specific as to be reflected in changes in the structural parameters between spatially nearby sites, as reported in other habitats and ecosystems (Cárdenas, Halme, & Tuomisto, 2007; Cuevas, Sánchez-González, & Tejero-Díez, 2013; Jones et al., 2008; Karst et al., 2005; Sánchez-González et al., 2010).
Materials and methods
Study area
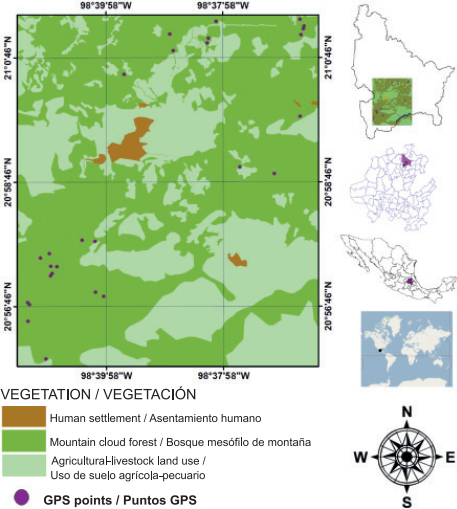
Tlanchinol is located in the northern portion of the state of Hidalgo; the municipality is bordered to the north by the state of San Luis Potosi, to the south by the municipality of Calnali, to the west by the municipality of Lolotla and to the east by the municipalities of Huazalingo and Huejutla (Figure 1). Tlanchinol covers an area of close to 380 km2 and accounts for 1.9 % of the state area; it is geographically located between parallels 21° 00’ - 21° 10’ NL and 98° 30’ - 98° 35’ WL, at an average elevation of 1,590 m (Instituto Nacional de Estadística, Geografía e Informática [INEGI], 1996). The terrain is rugged in much of the municipality with many canyons, in addition to plateaus and valleys; to the east there is a plain and to the west some other plains 90 % constituted by slopes greater than 10 % (INEGI, 1996). A temperate climate predominates with an average temperature of 17.2 °C and annual rainfall of 2,156 mm, with rainfall mainly in summer (May to September) and to a lesser extent in winter (INEGI, 2004; Pavón & Meza, 2009). The MCF of Tlanchinol is characterized by the presence of evergreen and some deciduous trees. One of the characteristic species is Liquidambar macrophylla Oerst., Alnus acuminata Kunth, Bejaria aestuans Mutis ex L., Clethra mexicana DC., Dalbergia palo-escrito Rzed. & Guridi-Gómez and Quercus spp. L. are also present; the shrub layer consists of Bocconia frutescens L. and Decatropis bicolor (Zucc.) Radlk. (Luna, Ocegueda, & Alcántara, 1994; Ponce-Vargas, Luna-Vega, Alcántara-Ayala, & Ruiz-Jiménez, 2006).
Field work
Sampling and collection of pteridophyte samples from the MCF in Tlanchinol, Hidalgo, were carried out during seven field trips made between March 2009 and February 2010. The sampling sites were selected based on three basic criteria: 1) elevation, determined with a geopositioner (Garmin, GPSMAP 60CS, Kansas, USA), 2) absence or lack of signs of disturbance by human activities or natural phenomena and 3) canopy cover ≥ 50 %, verified with a Spherical densitometer (Model A, Bartlesville, Oklahoma , USA). The last two criteria are considered indirect indicators of the presence of preserved primary vegetation (Pérez-Paredes, Sánchez-González, & Tejero-Díez, 2014).
The richness, diversity, structural values and distribution of fern and lycophyte species were determined based on the establishment of 24 sampling plots (one per selected locality) of 400 m2 each, in three different elevational ranges; the first stratum ranged from 1,100 to 1,400 m, the second from 1,401 to 1,700 m and the third from 1,701 to 2,000 m. The plot size chosen was the minimum area used in ecological studies with ferns and lycophytes in neotropical forests (Pérez-Paredes et al., 2014; Watkins et al., 2006). In each plot, standard coverage and density data were obtained for each species (Matteucci & Colma, 1982), considering three growth substrates: epiphyte, epipetric and terrestrial (Álvarez-Zúñiga, Sánchez-González, López-Mata, & Tejero-Díez, 2012).
Laboratory work
Determination of species. The species were determined based on the work of Mickel and Smith (2004), and for some genera recent literature was consulted (Ebihara, Dubuisson, Iwatsuki, Hennequin, & Ito, 2006; Labiak, 2011). A specimen of each species was mounted for integration into the HGOM herbarium collection, housed in the Biological Research Center at the Universidad Autónoma del Estado de Hidalgo. A duplicate of each specimen was deposited in the MEXU National Herbarium at the Universidad Nacional Autónoma de México.
Structural values. The structural importance along the elevational gradient was estimated based on the relative importance value (RIV) of each species, from coverage and relative density values (Matteucci & Colma, 1982).
Species richness and diversity. Species richness was defined as the number of species at each sampling location. Species diversity was estimated with the index proposed by Jost (2006), from the transformation of Shannon-Wiener index values obtained with the PAST 2.01 calculation program (Hammer, Harper, & Ryan, 2009).
Beta diversity. The species replacement rate between elevational ranges was estimated as the inverse of the Sørensen similarity index (Koleff, Gaston, & Lennon, 2003). The number of species shared between elevational ranges was also calculated using EstimateS 8.2 calculation software (Colwell, 2015).
Environmental variables. Based on the location (latitude and longitude) of each sampling plot, 19 climatic variables were estimated with the DIVA-GIS 7.3.0.1 program (Hijmans, Guarino, Jarvis, & O’Brien, 2007) using climate information for the years 1950-2000, available on the WorldClim-Global Climate Database website (2015): annual mean temperature (AMT), mean diurnal range (MDR = max temp - min temp), isothermality [I = (BIO2/Bio7) × 100], temperature seasonality (TS = standard deviation × 100), maximum temperature of warmest month (MTWM), minimum temperature of coldest month (MTCM), temperature annual range (TAR = BIO5-BIO6), mean temperature of wettest quarter (MTWQ), mean temperature of driest quarter (MTDQ), mean temperature of warmest quarter (MTWQ), mean temperature of coldest quarter (MTCQ), annual precipitation (AP), precipitation of wettest month (PWM), precipitation of driest month (PDM), precipitation seasonality (PS), precipitation of wettest quarter (PWQ), precipitation of driest quarter (PDQ), precipitation of warmest quarter (PWQ), and precipitation of coldest quarter (PCQ). Soil and topographic variables were: calcium (Ca), electrical conductivity (EC), organic carbon (OC), potassium (K), magnesium (Mg), organic matter (OM), sodium (Na), potential of hydrogen (pH), elevation (E), orientation (Or) and slope (Sl).
Relationship between structure, soil, and climatic variables. The relationship was established through redundancy analysis (RDA), a direct ordination technique (a special case of multiple regression) where the structural values of species are directly related to environmental variables (Palmer, 2015). The forward selection option, included in the CANOCO program (Ter Braak & Šmilauer, 1998), allowed choosing the variables that best explained the variation in the data. Based on the Monte Carlo test, it was determined whether the values of the ordination axes and the values of correlation between the species and the environmental variables obtained with RDA were statistically significant (P < 0.05).
Relationship of richness and diversity with climatic and soil variables. The relationship was estimated using parametric (linear regression analysis) and nonparametric (regression trees) methods with the STATISTICA version 7 data analysis software system (StatSoft Inc., 2004). Regression trees do not make a priori assumptions about some sort of association between the variables studied and facilitate the interpretation of their relationships, which is not achieved if linear statistical models are used (Sánchez-González & López-Mata, 2005).
Results and discussion
Species richness and diversity
The most conspicuous changes in the composition and diversity of plant species in mountainous regions are related to differences in elevation (Rahbek, 2005; Slik et al., 2009). In the present study, the total richness along the elevational gradient was 78 species of ferns and lycophytes; however, the richness and diversity values of both taxonomic groups showed no significant relationship (P < 0.05) with respect to elevation (Figure 2). This contrasts with the results of other investigations that refer to a unimodal response (Rahbek, 2005; Sánchez-González & López-Mata, 2005; Sang, 2008; Zhu, Jiang, Liu, Xiong, & Kang, 2007) or, less commonly, positive or negative responses between elevation and species richness, for different groups of plants and ecosystems (Rahbek, 2005; Slik et al., 2009). It is important to note that elevation is an environmental variable that affects the composition and structure of communities in an indirect and complex way, as species respond to an intricate combination of climatic (temperature, precipitation), soil and topographic variables (Pinokiyo, Singh, & Singh, 2008; Sang, 2008; Slik et al., 2009). In the case of ferns and lycophytes, it is common for richness and diversity to increase at intermediate elevations where humidity is suitable for reproduction and development (Kluge et al., 2006; Watkins et al., 2006), and to decrease at both low elevations, due to water shortages resulting from the increase in temperature, and at high altitudes due to low temperatures (Cuevas et al., 2013; Kluge et al., 2006; Sánchez-González et al., 2010). According to Whittaker, Willis, and Field (2001), it can be difficult to define a number of specific variables responsible for changes in species diversity, as these may differ significantly between ecological systems and across spatial and temporal scales. Sang (2008) mentions that in the Tianshan mountain area of China, water had the greatest influence on the diversity of plant species at low elevations, temperature at high elevations and soil physical and chemical characteristics at intermediate elevations.
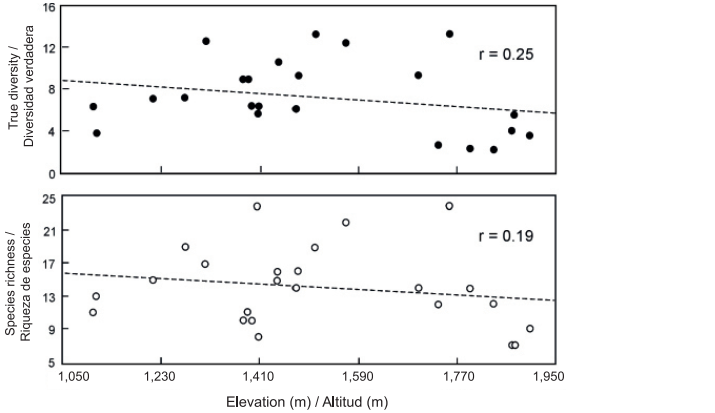
Figure 2 Richness and diversity of fern and lycophyte species along the elevational gradient studied (1,107 m - 1,903 m) in Tlanchinol, Hidalgo. The relationship with elevation was not statistically significant (P < 0.05).
In the municipality of Tlanchinol, humidity and temperature conditions showed no significant change trend as elevation increased, perhaps because the range studied was small (less than 1,000 m). For the same reason it was not possible to discern any pattern of change in species richness and diversity values along the elevational gradient. In addition, it is likely that factors such as slope, exposure, the area of the hills, gullies, canyons and mountains, or the soil factors (with more direct physiological impact) of the sampling plots, are more related than elevation with local variation in humidity and temperature and, therefore, with the richness and diversity of fern and lycophyte species (Pausas & Austin, 2001).
Table 1 shows the number of species per collection range. The number of species shared between contiguous elevational ranges was high (low beta diversity); by contrast, the number of shared species was low (high beta diversity) in the farthest elevational ranges, located at the ends of the gradient (1,107-1,903 m). The change in species composition is more evident as the geographical distance between sites increases and, therefore, when local environmental differences become more pronounced (Sánchez-González & López-Mata, 2005; Sang, 2008; Wana & Beierkuhnlein, 2011).
Table 1 Number of fern and lycophyte species per collection range (diagonal), number of shared species (upper diagonal) and beta diversity (lower diagonal) between elevational ranges of the mountain cloud forest in Tlanchinol, Hidalgo.
| Elevational ranges (m) | 1,100-1,400 | 1,401-1,700 | 1,701-2,000 |
|---|---|---|---|
| Number of shared species | |||
| 1,100-1,400 | 44 | 36 | 23 |
| 1,401-1,700 | 0.33 | 63 | 31 |
| 1,701-2,000 | 0.45 | 0.39 | 39 |
| Beta diversity | |||
Relationship between species richness and environmental variables
Based on the significant correlation (r = 0.56, P < 0.01) between richness and the estimated diversity indices, only species richness was used as a response variable in the simple regression analysis and regression tree. The linear relationship between richness and environmental variables was not statistically significant (P < 0.05), so the correlation matrix is not shown. The statistical analysis methods that assume some kind of relationship between variables (linear, unimodal) are not entirely adequate to study the association between richness, species diversity and environmental variables, because the most common relationships in nature are nonlinear (Kallimanis, Ragia, Sgardelis, & Pantis, 2007; Sánchez-González & López-Mata, 2005).
In the present study, the regression tree facilitated and simplified the interpretation of the results. Figure 3 shows the tree structure, which has two related options with lower or higher species richness: the first option suggests that species richness was low (arrows with dashed lines) at sites where minimum temperature of coldest month (MTCM) was less than 0.77 %. The second option suggests that species richness was higher at sites with MTCM above 0.77 % and precipitation of warmest quarter (PWQ) below 2.67 %. By contrast, species richness was low at sites where PWQ was greater than 2.67 %, the orientation (Or) greater than 1.82 % and the slope (Sl) greater than 89.75 %. All selected variables are directly or indirectly related to the temperature and water availability conditions for ferns and lycophytes. Richness values differed little with respect to the slope of the terrain. This is consistent with the view that only when the slope is closely related to other environmental variables is the impact of this factor evident on the composition and structure of the vegetation of Mexico (Rzedowski, 1978).
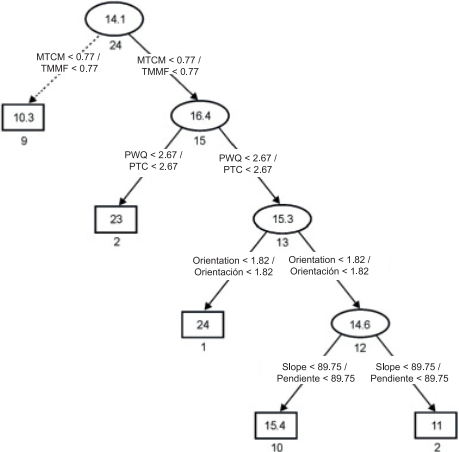
Figure 3 Regression tree outlining species richness in the mountain cloud forest of Tlanchinol, Hidalgo. Rectangles and ellipses represent terminal and non-terminal nodes, respectively. Numbers in each ellipse or rectangle indicate average species richness. Numbers under each ellipse or rectangle are the sum of squares associated with the arithmetic average of the samples. Values in the connections between nodes represent decision criteria. Vectors with solid lines show the path with higher species richness and vectors with dotted lines indicate the path with lower species richness. MTCM: minimum temperature of coldest month, PWQ: precipitation of warmest quarter.
Richter (2008) mentions that a complex topography is essential to explain the petrographic, soil and climatic structure, and species diversity. He adds that, in many tropical mountains, there is an extraordinary variety of humid, sub-humid and dry habitats in close proximity, due to the presence of extremely heterogeneous terrain with slopes of different exposure. The MCF in Tlanchinol is an example of this; because of its intricate orography, rainfall and temperature may differ significantly in relatively close sites, only a few kilometers away, having an impact on the changes in richness and diversity of fern and lycophyte species.
Relative importance value of the species
Table 2 presents the RIV of the species studied in the MCF in Tlanchinol, Hidalgo. Species with a RIV greater than 10 % (dominant species) in the lower elevational range (1,100 to 1,400 m) were: Alsophila firma (Baker) D. S. Conant, Asplenium sessilifolium Desv. var. sessilifolium, Ctenitis melanosticta (Kunze) Copel., Cyathea fulva (M. Martens & Galeotti) Fée, Dennstaedtia bipinnata (Cav.) Maxon and Lophosoria quadripinnata (J. F. Gmel.) C. Chr.; in the middle elevational range (1,401-1,700 m): A. firma, Asplenium cuspidatum Lam., Blechnum appendiculatum Willd., C. fulva, Elaphoglossum sartorii (Liebm.) Mickel, Hypolepis repens (L.) C. Presl., L. quadripinnata, Phanerophlebia juglandifolia (Humb. Onpl. ex Willd.) J. Sm. and Plagiogyria pectinata (Liemb.) Lellinger; and in the upper elevational range (1,701-2,000 m): E. obscurum (E. Fourn.) C. Chr., E. sartorii, L. quadripinnata, P. pectinata and Polystichum ordinatum Liebm. Species with a high RIV are distributed over the first two elevational ranges of the gradient analyzed, which influences the physiognomy of the vegetation, since they are the most important from a structural point of view. The remaining species with a low RIV were variably distributed along the elevational gradient, including some restricted to a single range and others present throughout the gradient studied. In the three elevational ranges, larger-sized fern species had the highest RIV, highlighted by L. quadripinnata due to its wide distribution along the gradient (1,100 to 1,950 m).
Table 2 Relative importance value of fern and lycophyte species in the mountain cloud forest in Tlanchinol in three different elevational ranges. Elevational ranges: A = 1,100-1,400 m, B = 1,401-1,700 m, C = 1,701-2,000 m.
| Species | Relative importance value | ||
|---|---|---|---|
| A | B | C | |
| Adiantum andicola Liebm. | - | 1.8 | 1.7 |
| Adiantum braunii Mett. ex Kuhn | 8.2 | - | - |
| Alsophila firma (Baker) D. S. Conant | 25.3 | 10.5 | - |
| Arachniodes denticulada (Sw.) Ching | - | 8.9 | - |
| Asplenium abscissum Willd. | 7.5 | 2.1 | - |
| Asplenium auriculatum Sw. | 1.7 | 8.6 | 3.2 |
| Asplenium cuspidatum Lam. | - | 10.5 | - |
| Asplenium monanthes L. | - | 5.6 | 3.8 |
| Asplenium serra Langsd. & Fisch. | 3.5 | - | - |
| Asplenium sessilifolium Desv. var. sessilifolium | 11.7 | 1.5 | 4.5 |
| Asplenium tuerckheimii Maxon | - | 1.5 | - |
| Blechnum appendiculatum Willd. | - | 11.6 | - |
| Blechnum occidentale L. | 6.3 | 3.4 | 3 |
| Blechnum schiedeanum Hieron. | 0.9 | - | - |
| Botrychium decompositum M. Martens & Galeotti | - | 6.2 | - |
| Campyloneurum angustifolium (Sw.) Fée | 3.4 | 2.1 | 0.2 |
| Campyloneurum xalapense Fée | 5.2 | 3.5 | - |
| Ctenitis equestris (Kunze) Ching var. equestris | 6.8 | 1.9 | - |
| Ctenitis erinacea A.R. Sm. | 9.6 | - | - |
| Ctenitis melanosticta (Kunze) Copel. | 13.9 | 6.3 | - |
| Cyathea fulva (M. Martens & Galeotti) Fée | 37.3 | 25.2 | - |
| Cystopteris fragilis (L.) Bernh. | 1 | - | - |
| Dennstaedtia bipinnata (Cav.) Maxon | 12.1 | 3.7 | - |
| Dennstaedtia cicutaria (Poir) Hieron. | 1 | 8 | - |
| Didymoglossum reptans (Sw.) C. Presl | - | 0.6 | - |
| Diplazium franconis Liebm. | 0.3 | 2.2 | - |
| Diplazium lonchophyllum Kunze | 6.7 | 2.8 | 5.7 |
| Diplazium ternatum Liebm. | 5.2 | 0.7 | - |
| Diplopterygium bancroftti (Hook.) A.R. Sm. | - | 1.8 | - |
| Elaphoglossum erinaceum T. Moore | - | - | 5.2 |
| Elaphoglossum glaucum T. Moore | - | 5.6 | 0.3 |
| Elaphoglossum obscurum (E. Fourn.) C. Chr. | 1.7 | 0.3 | 17.5 |
| Elaphoglossum peltatum (Sw.) Urb. | - | 1.3 | - |
| Elaphoglossum potosianum Christ. | - | - | 2.1 |
| Elaphoglossum sartorii (Liebm.) Mickel | - | 16.9 | 18.5 |
| Hymenophyllum polyanthos Sw. | 0.3 | 4.3 | - |
| Hypolepis repens (L.) C. Presl | 2.6 | 13.2 | - |
| Lophosoria quadripinnata (J. F. Gmel.) C. Chr. | 70.2 | 17.7 | 37 |
| Lycopodiella cernua (L.) Pic. Serm. | - | 0.2 | - |
| Marattia weinmanniifolia Liebm. | 1.8 | 4.2 | 3.7 |
| Melpomene leptostoma Fée | - | - | 0.2 |
| Pecluma alfredii (Rosents.) M. G. Price | 6.6 | 4.6 | 3.1 |
| Phanerophlebia gastonyi Yatsk. | 5.4 | 5 | - |
| Phanerophlebia juglandifolia (Humb. & Bonpl. ex Willd.) J. Sm. | 1 | 10.6 | 8.4 |
| Phlebodium pseudoaureum (Cav.) Lellinger | 9.1 | 0.5 | 3.4 |
| Pityrogramma ebenea (L.) Proctor | - | 1.2 | - |
| Plagiogyria pectinata (Liemb.) Lellinger | - | 13.3 | 39.9 |
| Pleopeltis crassinervata (Fée) T. Moore | 1.1 | 2 | 0.7 |
| Pleopeltis lepidotricha (Fée) A. R. Sm. & Tejero | 3.6 | 2.1 | 1.9 |
| Pleopeltis mexicana Feé | - | 7.6 | 2.9 |
| Pleopeltis plebeia (Schltdl. & Cham.) A.R.Sm. & Tejero | 9.1 | 4 | 4.2 |
| Pleopeltis polylepis (Roem. ex Kunze) T. Moore var. polypepis | 1.4 | - | 0.9 |
| Pleopeltis polypodioides (L.) E. G. Andrews & Windham | - | 3.2 | - |
| Polyphlebium hymenophylloides (L.) Ebihara & Dubuisson | - | 0.3 | - |
| Polypodium fraternum Schltdl. & Cham. | - | 4.6 | 1.3 |
| Polypodium longepinnulatum E. Fourn. | 3.7 | 2 | 2.7 |
| Polypodium plesiosorum Kunze | 3.9 | 1.4 | 2.4 |
| Polypodium rhodopleuron Kunze | 1.7 | 3.3 | 3.6 |
| Polystichum ordinatum Liebm. | - | - | 11.9 |
| Psilotum complanatum Sw. | 1.7 | 3.2 | - |
| Pteridium arachnoideum (Kaulf.) Maxon | - | 7.1 | - |
| Pteridium caudatum (L.) Maxon | - | - | 4.2 |
| Pteris orizabae M. Martens & Galeotti | 4.8 | 6 | 6.8 |
| Selaginella arsenei Weath. | - | 5.9 | - |
| Selaginella hoffmannii Hieron. | 2.6 | - | - |
| Selaginella lineolata Mickel & Beitel | - | - | 0.3 |
| Selaginella pallescens (C. Presl) Spring in Martius | 4.3 | 0.4 | - |
| Selaginella silvestris Aspl. | - | 3.5 | - |
| Selaginella stellata Spring | 7.1 | - | - |
| Stenogrammitis prionodes (Mickel & Beitel) Labiak | - | 0.6 | 0.1 |
| Thelypteris atrovirens (C.Chr.) C.F. Reed | 3.4 | 1.2 | 2.8 |
| Thelypteris dentata (Forssk.) E. P. St. John | - | 0.3 | - |
| Thelypteris kunthii (Desv.) C. V. Morton | - | - | 1.5 |
| Thelypteris oligocarpa (Humb. & Bonpl. ex Willd.) Ching | 4.1 | - | - |
| Vandesboschia radicans (Sw.) Copel. | 4.1 | 5.2 | 1.1 |
| Vittaria graminifolia Kaulf. | - | 2.3 | 0.15 |
| Woodwardia semicordata Mickel & Beitel | 2.8 | 4.3 | 2.9 |
| Woodwardia spinulosa M. Martens & Galeotti | - | 1.2 | - |
It is likely that the variation in the structural values of the ferns and lycophytes lies in the characteristics of the MCF, where there are several plant associations that differ in terms of height, phenology and dominant species (Rzedowski, 1978). Environmental heterogeneity in the Tlanchinol MCF is expressed in such a way that in each locality or sampling plot there are particular environmental conditions, regardless of the elevation, which affect or favor the dominance and relative importance (RIV) of one or more species. However, not all the environmental variables analyzed have the same influence on the density and coverage of the individuals of the fern and lycophyte species (Álvarez-Zúñiga et al., 2012). It has been documented that in the high parts of the mountains, the composition and structure of the plant communities are often related to temperature or other climatic parameters, whereas in the lower parts they may be determined by other biotic and abiotic factors (Ohmann & Spies, 1998; Sánchez-González & López-Mata, 2005; Sang, 2008).
Relationship between structural values and environmental variables
Figure 4 shows the ordination of the sites and environmental factors obtained by Redundancy Analysis (RDA). According to Table 3, the eigenvalues indicate that there is good separation between sites (each site marked with a symbol in Figure 4 represents the centroid of the distribution of a set of species) along the two first axes of variation, associated with environmental gradients. In the ordination diagram, a group consisting of sampling plots 1, 2, 7, 11, 13, 14 and 15, another group comprising plots 5, 12, 16, 17, 18 and 24, and a third group formed by plots 4, 8, 9, 10, 20, 21, 22 and 23 stand out. Sampling plots 3, 6 and 19 are seen separated from each other and from the others, too, so they are not constituted as a group.
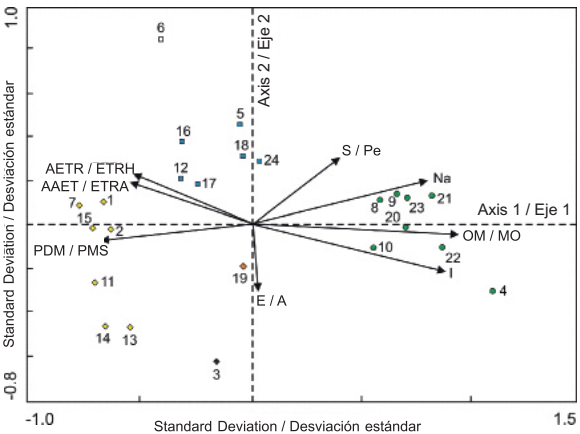
Figure 4 Ordination diagram of the 24 sampling sites and the eight environmental variables that showed the highest correlation values with respect to the first two axes of variation in the mountain cloud forest of Tlanchinol, Hidalgo. E: Elevation, AAET: Annual actual evapotranspiration, AETR: Actual evapotranspiration in the rainy season of the year; I: Isothermality, OM: Organic matter, Na: Sodium, S: Slope, PDM: Precipitation of driest month.
Table 3 Redundancy analysis conducted with data from structural values of fern and lycophyte species from 24 sampling sites and 12 environmental variables in the mountain cloud forest in Tlanchinol, Hidalgo.
| Estimated values | Ordination axes | |
|---|---|---|
| 1 | 2 | |
| Eigenvalues | 0.31 | 0.08 |
| Species-environmental factors correlation | 0.87 | 0.80 |
| Cumulative variance (%) | ||
| Of the species | 31.60 | 40.20 |
| Of the species-environment relationship | 54.30 | 69.10 |
The environmental variables that had a higher positive correlation with the first ordination axis were, in order of importance: organic matter, isothermality and sodium content (Table 4, Figure 4). The variables with the highest negative correlation for the same axis were: precipitation of driest month, annual actual evapotranspiration and actual evapotranspiration during the rainy season. As to the second ordination axis, the variable with the greatest negative correlation was elevation and the variables with the greatest positive correlation were slope and annual mean temperature (Table 4, Figure 4). According to the variance inflation factor (VIF) value, three of the selected variables contributed significantly and independently to ordination (VIF < 12): organic matter, slope and isothermality. The values of the remaining variables showed high autocorrelation.
Table 4 Correlation between the first two ordination axes and eleven environmental variables chosen with the CANOCO software “forward selection” option, to evaluate the relationship between the structural values of fern and lycophyte species and climatic and soil variables in Tlanchinol, Hidalgo.
| Environmental variable | Axis 1 | Axis 2 |
|---|---|---|
| Organic matter | 0.61 | -0.05 |
| Slope | 0.26 | 0.36 |
| Annual actual evapotranspiration | -0.36 | 0.22 |
| Actual evapotranspiration of the rainy season | -0.36 | 0.22 |
| Orientation | -0.13 | 0.14 |
| Isothermality | 0.57 | -0.25 |
| Sodium | 0.52 | 0.24 |
| Precipitation of warmest quarter | -0.31 | 0.08 |
| Elevation | 0.01 | -0.34 |
| Precipitation of driest month | -0.44 | -0.09 |
| Annual mean temperature | -0.14 | 0.27 |
Randomized data generated with Monte Carlo permutations indicate that the eigenvalue of the first ordination axis was statistically significant (P < 0.05). This suggests that the values obtained with RDA are not due to chance and that the ordination diagram provides a significant representation of the distribution of fern and lycophyte assemblages in the sampling plots (Table 4). While there is a gradual change in the composition of species along the elevational gradient examined by ordination analysis, it was possible to distinguish groups formed by assemblages of fern and lycophyte species, separated from other groups likely because they have different environmental requirements and tolerances (Rodríguez, Pacheco, & Zavala, 2008).
Elevational gradients are considered among the most powerful “natural experiments” for testing ecological and evolutionary responses of biota to environmental influences. However, it is appropriate that the results are interpreted considering factors that are not necessarily elevation specific, such as humidity, hours of sunshine, wind, season length, geology (Körner, 2007) and even human activities (Rodríguez et al., 2008).
In the Tlanchinol MCF, the richness, distribution and abundance of fern and lycophyte species are primarily defined by the organic matter, isothermality, sodium content, precipitation of driest month, annual actual evapotranspiration and actual evapotranspiration in the rainy season; these variables were not dependent on elevation or correlated with it. In the MCF, in particular, the role of climate should be highlighted as an element that not only acts directly on the plants, but also influences, often decisively, the soil formation and topography-shaping processes (González-Espinosa et al., 2012; Rzedowski, 1978).
The influence of soil factors on the distribution and abundance of different plant groups at local level has been confirmed in several studies (Jones et al., 2008; Karst et al., 2005; Sánchez-González & López-Mata, 2005). Organic matter is very important for the stability of soil aggregates, has an impact on the porosity and, therefore, the gas and water exchange, and by being a reservoir of nutrients it is related to the availability thereof (Schoenholtz, Van Miegroet, & Burger, 2000). The other variables (precipitation of driest month, annual actual evapotranspiration and actual evapotranspiration in the rainy season of the year), which were important in explaining the structure and distribution of the species, are directly related to moisture retention in both the soil and plants. Differences in the composition and dominance (RIV) of the species in each sampling plot are probably the result of the combined effect of multiple environmental variables, with the organic matter, sodium content, precipitation and temperature being of special relevance for both groups of plants (Kluge et al., 2006).
Conclusions
The results of this study confirm that ferns and lycophytes are excellent indicators of environmental conditions at local and landscape scale. Species richness and diversity values were mainly related to changes in humidity and temperature conditions at landscape scale, but changes in the structural values of the species were more informative of ecological preferences at local level. Species composition differed more noticeably as the geographical distance between sites increased, probably due to more pronounced environmental differences at the ends of the elevational gradient. Ordination showed that soil factors, humidity and temperature are the environmental variables that best relate to the composition and degree of synecological importance of species along the elevational gradient studied (1,107-1,903 m).

