


 texto en
  Inglés (pdf)
 Artículo en XML
 Referencias del artículo
 Enviar artículo por email
 Citado por SciELO
  Similares en
SciELO
Similares en
SciELO 
 Permalink
Introduction
Moniliophthora roreri (Cif. & Par.) Evans et al. is the causal agent of frosty pod rot in cacao (Theobroma cacao L.) (Phillips-Mora & Wilkinson, 2007). In Mexico, M. roreri was reported in 2005, making it the main parasitic limitation on the production of cacao (Phillips-Mora et al., 2006). It has been reported that M. roreri may reduce up to 80 % of the production of cacao, causing negative socio-economic and environmental effects (Torres-de la Cruz, Ortiz-García, Téliz-Ortiz, Mora-Aguilera, & Nava- Díaz, 2011).
Cultural practices have been the most commonly used method for the fight against frosty pod rot in cacao (Soberanis et al., 1999). The use of fungicides has been a scarcely used practice, due to the erratic strategies of fungicide evaluations and to the fluctuating price of cacao (Bateman et al., 2005). Programs for the development of resistant genetic material have also been established (Phillips-Mora, Arciniegas-Leal, Mata-Quiros, & Motomajor-Arias, 2012); however, notable progress has not been obtained in the commercial use of clones with resistance to the disease. Krauss and Soberanis (2001) mention that biocontrol offers some potentials in the sustainable handling of the frosty pod rot through the use of antagonists. The authors reported that the species of the Trichoderma genus showed control on M. roreri.
In the search of biological control agents, one of the basic strategies should be the initial exploration of the natural native enemies (Vázquez, Matienzo, Veitía, & Alfonso, 2008). Based on this reasoning, in the state of Tabasco, Mexico, there are 50 isolates of Trichoderma obtained from the T. cacao rhizosphere which have been grouped into nine species and may be evaluated for the control of M. roreri. Due to this, the objective of this study was to select isolates native to Trichoderma with the best in vitro antagonist and physiological characteristics for the control of M. roreri.
Materials and methods
Trichoderma isolates
Fifty isolates of Trichoderma grouped in nine species were characterized in the present work (Table 1). These isolates were obtained from the T. cacao rhizosphere as a part of a diversity study of Trichoderma in the cacao agroecosystem in the state of Tabasco, Mexico, which were confirmed in kind through morphology and ITS sequences (Torres-de la Cruz et al., 2015). Currently, these isolates are a part of the Trichoderma collection of the División Académica de Ciencias Biológicas, Universidad Juárez Autónoma de Tabasco. The M. roreri isolate was provided by the Laboratorio de Fitopatología of the Colegio de Postgraduados Campus Tabasco, previously identified through morphology and ITS sequences (GenBank access number: GU108605). All isolates were preserved and multiplied in the middle of the Potato Dextrose Agar (PDA) culture.
Table 1 Isolates native to Trichoderma evaluated against Moniliophthora roreri, which causes frosty pod rot in cacao in the state of Tabasco, Mexico. Isolates: T. asperellum (Samuels, Lieckf & Nirenberg), T. pleuroticola (Yu & Park), T. spirale (Bissett), T. harzianum (Rifai), T. virens (Mill, Giddens & Foster) Arx., T. koningiopsis (Samuels, Suárez & Evans), T. longibrachiatum (Rifai), T. brevicompactum (Kraus, Kubicek & Gams) and T. reesei (Simmons).
| Municipality | Locality | North Latitude | West Longitude | IsolateZ | Species | Isolate number |
|---|---|---|---|---|---|---|
| Paraíso | Ranchería Moctezuma 1 | 18° 22’ 19.3” | 93° 13’ 42.4” | TTC001 | T. asperellum | 4 |
| TTC002 | T. pleuroticola | |||||
| TTC003 | T. spirale | |||||
| TTC004 | T. spirale | |||||
| Ejido Occidente- San Francisco | 18° 20’ 37.9” | 93° 15’ 24.5” | TTC007 | T. pleuroticola | 2 | |
| TTC008 | T. pleuroticola | |||||
| Cardenas | Poblado C-28 | 18° 01’ 46.7” | 93° 29’ 42.0” | TTC009 | T. harzianum | 1 |
| TTC014 | T. virens | |||||
| Ranchería Ocampo | 18° 01’ 49.3” | 93° 21’ 29.7” | TTC015 | T. virens | 3 | |
| TTC016 | T. virens | |||||
| Ranchería Rio Seco 1 | 18° 03’ 47.2” | 93° 23’ 04.4” | TTC017 | T. virens | 1 | |
| Comalcalco | Ranchería Arena 4 | 18° 13’ 25.4” | 93° 23’ 31.1” | TTC020 TTC021 | T. koningiopsis | |
| TTC023 | T. virens | |||||
| TTC024 | T. asperellum | 4 | ||||
| T. asperellum | ||||||
| Ranchería Gregorio | 18° 14’ 59.9” | 93° 17’ 12.7” | TTC026 TTC027 TTC028 | T. longibrachiatum | ||
| Méndez 1 | T. longibrachiatum | 3 | ||||
| T. longibrachiatum | ||||||
| Cunduacán | Ejido José María | 18° 08’ 30.1” | 93° 17’ 29.1” | TTC031 TTC032 | T. virens | |
| Pino Suárez | T. longibrachiatum | 2 | ||||
| Ranchería La Piedra 1 | 18° 07’ 45.2” | 93° 11’ 52.4” | TTC035 | T. asperellum | ||
| TTC037 TTC039 | T. harzianum | 3 | ||||
| T. longibrachiatum | ||||||
| Huimanguillo | Ranchería Villa Flores 2 | 17° 48’ 06.6” | 93° 24’ 16.5” | TTC045 TTC047 | T. brevicompactum | |
| T. brevicompactum | 2 | |||||
| Ranchería Paredón 1 | 17° 44’ 59.6” | 93° 23’ 57.8” | TTC050 | T. brevicompactum | 2 | |
| TTC051 | T. asperellum | |||||
| Ejido Rafael Martínez | 17° 42’ 56.8” | 93° 23’ 45.7” | TTC054 | T. spirale | 1 | |
| Jalpa de Méndez | Ranchería Hermenegildo | 18° 10’ 33.4” | 93° 08’ 48.5” | TTC056 | T. harzianum | |
| Galeana 2 | TTC058 TTC059 | T. virens | 3 | |||
| T. virens | ||||||
| Ejido Huapacal | 18° 11’ 48.1” | 93° 10’ 28.5” | TTC062 | T. harzianum | 2 | |
| TTC063 | T. koningiopsis | |||||
| Centro | Ranchería Plátano y cacao 4 | 17° 59’ 04.2” | 93° 10’ 07.9” | TTC077 | T. harzianum | |
| TTC081 | T. reesei | 3 | ||||
| TTC084 | T. koningiopsis | |||||
| Ranchería Buena vista 1 | 17° 56’ 59.2” | 93° 06’ 23.2” | TTC085 | T. spirale | ||
| TTC086 | T. brevicompactum | 2 | ||||
| Ranchería González 4 | 17° 57’ 29.6” | 93° 05’ 25.7” | TTC090 | T. harzianum | ||
| TTC088 | T. longibrachiatum | 2 | ||||
| Tacotalpa | Ejido Zunuy y patastal | 17° 28’ 10.3” | 92° 50’ 56.7” | TTC093 | T. spirale | 1 |
| T. harzianum | ||||||
| Ranchería Puyacatengo 1 | 17° 39’ 37.2” | 92° 54’ 20.7” | TTC100 | T. longibrachiatum | 4 | |
| TTC101 | T. virens | |||||
| TTC102 TTC104 | T. virens | |||||
| Teapa | Ejido Vicente Guerrero | 17° 30’ 15.7” | 92° 54’ 02.5” | TTC115 | T. harzianum | 2 |
| TTC113 | T. reesei | |||||
| Ranchería Allende | 18° 09’ 38.1” | 93° 02’ 00.8” | TTC073 TTC076 | T. harzianum | ||
| T. harzianum | ||||||
| Ejido Allende 2 | 17° 33’ 20.0” | 92° 59’ 08.7” | TTC109 | T. harzianum | 1 | |
| Total | 50 |
zThe isolates were identified with the letters TTC (Trichoderma Tabasco Cacao) followed by the number of isolates.
Mycoparasitism of Trichoderma on M. roreri
The mycoparasitic ability of the Trichoderma isolates on M. roreri was evaluated according to the pre-colonized Petri dish method (Evans, Holmes, & Thomas, 2003). A fragment of 5 mm in diameter was obtained from M. roreri colonies of 10 days of age and was placed near the edge of a Petri dish with 9 cm in diameter with half PDA. The Petri dishes with an inoculated medium were incubated during 37 days at 25 ± 1 °C in the dark. Subsequently, a 0.5 x 2.5 cm fragment of the Trichoderma inoculum, obtained from a 4 day old colony, was planted on the opposite side of the M. roreri inoculum. The dishes pre-colonized by M. roreri and inoculated with Trichoderma were incubated during 15 days under the same conditions indicated for pre-colonization. Five repetitions of the isolate and five of the control treatment were established. The control treatment comprised pre-colonized dishes of M. roreri without the inoculation of Trichoderma.
After the incubation, 10 samples of 0.5 mm in diameter were extracted initiating the inoculum of M. roreri in direction to the inoculum of Trichoderma. The samples were planted in Petri dishes with PDA mediums and were incubated at 25 ± 1 °C in the dark. The samples were observed during 7 days in order to detect the presence of the mycoparasite (Trichoderma) or phytopathogen (M. roreri) and evaluate the percentage of mycoparasitism with the following formula:
PP = (CT x 100) / N
Antibiosis of Trichoderma on M. roreri
The antibiosis of Trichoderma isolates on M. roreri was evaluated on cultures coupled according to Holmes, Schroers, Thomas, Evans, and Samuels (2004). Antibiosis was calculated by the percentage of radial growth reduction of M. roreri. For this, a fragment of 10 day old M. roreri of 5 mm in diameter was placed on a Petri dish with PDA medium. The inoculated dishes were incubated in the dark during 7 days at 25 ± 1 °C in order to establish the colony. Subsequently, the colony of M. roreri was controlled with the mycoparasite, for which a 5 mm fragment of 4 day old Trichoderma was planted on the opposite side of the M. roreri. All dishes were incubated at 25 ± 1 °C in the dark; five repetitions per isolate and control treatment were established. The control treatment comprised colonies of M. roreri without confrontation with Trichoderma. The radial growth was recorded daily until one of the isolates had mycelial contact with M. roreri. The percentage of mycelial growth inhibition was determined with the Abbott formula (1925):
PA = [(CR - CRT) / CR] x 100
Potential antagonism of Trichoderma on M. roreri
The potential antagonism of the Trichoderma isolates on M. roreri was obtained through the formula:
AP = (MP + PA) / 2
Mycelial growth of Trichoderma
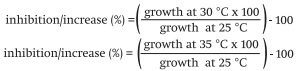
Mycelial growth was evaluated according to Dimbi, Maniania, Lux, and Mueke (2004). A fragment of 5 mm in diameter was obtained from the margins of 4 days old Trichoderma colonies and was placed in the middle of a Petri dish with a PDA medium. The boxes were incubated at 25, 30 and 35 °C (the three temperatures with ± 1 °C) with a photoperiod of 12 h in the light and 12 h in the dark; five repetitions per isolate and per temperature were established. The rate of mycelial growth was recorded each 12 h; the test was finalized when one of the colonies filled the Petri dish. The measurements of the last record were used in the statistical analysis. Radial growth (r) was transformed into the growth area (A, cm2) with the formula A = πr2. The corresponding area to each mm of radial growth was expressed in percentages. Thus, the effect of the temperature on the mycelial growth was evaluated through the inhibition percentage and the increase of the area, when increasing the temperature from 25 to 30 °C and from 25 to 35 °C.
Production of Trichoderma conidia
From the 4 days old Trichoderma cultures, a fragment of 5 mm in diameter was planted in Petri dishes with PDA medium. The inoculated fragment was incubated at 25, 30 and 35 °C (the three temperatures with ± 1 °C), with a photoperiod of 12 h in the light and 12 h in the dark during 16 days. Five repetitions per isolate and per temperature were established. The conidia were cultivated from the culture surface and the count was done in a Neubauer chamber (Hausser Scientific, USA). The concentration of conidia·mL-1 was estimated through the following formula:
C = (Cc) (4 x 10⁶) (Fd / 80)
where:
C = |
Concentration (conidia·mL-1) |
Cc = |
Average conidia counted in the Neubauer chamber |
Fd = |
Dilution factor |
The effect of the temperature on the production of conidia was evaluated in the same manner as indicated for mycelial growth.
Statistical analysis
The information on mycoparasitism, antibiosis, potential antagonism, mycelial growth and production of conidia were analyzed under a completely random design. Mycoparasitism, antibiosis and potential antagonism consisted of 50 treatments (each one of the evaluated isolates). Mycelial growth and the production of conidia comprised 40 treatments, as the isolates that did not show mycoparasitism and that had the lowest AP values were discarded. Prior to the analysis, the information on mycoparasitism, antibiosis and potential antagonism were transformed to the arc sine of the square root of the proportion, and the information on mycelial growth and production of conidia was transformed to log (x + 1). The information was subjected to an ANOVA and a separation of Tukey means test (P < 0.05) through SAS® (Statistical Analysis System [SAS], 1998).
Results and discussion
Mycoparasitism of Trichoderma on M. roreri
Table 2 presents the percentage of mycoparasitism of the 50 isolates native of Trichoderma evaluated on M. roreri. The isolates showed significant differences (P = 0.0001) and the percentage varied between 0 and 100 %. New isolates reached 100 % mycoparasitism at 15 days of incubation and 10 isolates did not show this characteristic. The isolates with mycoparasitism on M. roreri belong to the T. harzianum (Rifai), T. virens (Mill, Giddens & Foster) Arx, T. spirale (Bissett), T. brevicompactum (Kraus, Kubicek & Gams), T. koningiopsis (Samuels, Suárez & Evans) and T. asperellum (Samuels, Lieckf & Nirenberg) species. It could be hypothesized that these species produce a matrix of enzymes that allow parasitism of M. roreri. In this regard, mycoparasitism of T. harzianum, T virens, T. asperellum and T. koningiopsis isolates on M. roreri has been reported by Evans et al. (2003) and Krauss et al. (2006), while mycoparasitism of T. brevicompactum and T. spirale was documented for the first time. In this study, the parasitism of isolates of one same species varied, which is consistent with Hoyos-Carvajal, Duque, and Orduz (2008), who indicated that isolates of the same species can act in different ways.
Table 2 Mycoparasitism of 50 isolates native to Trichoderma on Moniliophthora roreri.
| Isolate | Mycoparasitism (%) | Isolate | Mycoparasitism (%) |
|---|---|---|---|
| TTC015 | 100 ± 0 a | TTC050 | 54 ± 5.4 gh |
| TCC023 | 100 ± 0 a | TTC037 | 54 ± 5.4 gh |
| TTC017 | 100 ± 0 a | TTC016 | 54 ± 5.4 gh |
| TTC100 | 100 ± 0 a | TTC045 | 52 ± 4.4 gh |
| TTC104 | 100 ± 0 a | TTC084 | 42 ± 4.4 hi |
| TTC058 | 100 ± 0 a | TTC032 | 42 ± 4.4 hi |
| TTC059 | 100 ± 0 a | TTC031 | 34 ± 5.4 ij |
| TTC014 | 100 ± 0 a | TTC020 | 30 ± 0 ijk |
| TTC062 | 100 ± 0 a | TTC093 | 26 ± 5.4 jkl |
| TTC004 | 96 ± 5.4 ab | TTC035 | 24 ± 5.4 jkl |
| TTC047 | 94 ± 5.4 b | TTC051 | 22 ± 4.4 jkl |
| TTC090 | 92 ± 4.4 b | TTC002 | 20 ± 0 klm |
| TTC039 | 84 ± 5.4 c | TTC001 | 16 ± 5.4 lm |
| TTC085 | 78 ± 4.4 cd | TTC063 | 16 ± 5.4 lm |
| TTC115 | 76 ± 5.4 cde | TTC024 | 10 ± 0 m |
| TTC073 | 74 ± 5.4 cdef | TTC003 | 0 n |
| TTC086 | 74 ± 5.4 cdef | TTC007 | 0 n |
| TTC077 | 66 ± 5.4 defg | TTC008 | 0 n |
| TTC056 | 64 ± 5.4 efg | TTC026 | 0 n |
| TTC054 | 64 ± 5.4 efg | TTC027 | 0 n |
| TTC009 | 62 ± 4.4 fg | TTC028 | 0 n |
| TTC076 | 56 ± 5.4 gh | TTC088 | 0 n |
| TTC102 | 56 ± 5.4 gh | TTC101 | 0 n |
| TTC109 | 56 ± 5.4 gh | TTC081 | 0 n |
| TTC021 | 54 ± 5.4 gh | TTC113 | 0 n |
± Standard deviation of the mean. Identical letters do not show a significant difference according to the Tukey test (P = 0.0001).
The isolates that did not show parasitism on M. roreri correspond to T. pleuroticola (Yu & Park), T. longibrachiatum (Rifai) and T. reesei (Simmons). The foregoing coincides with Garcia-Simoes, Tauk-Tornisielo, Rocha-Niella, and Tapia-Tapia (2012), who evaluated this species without finding parasitism on M. perniciosa (Stahel) Aime and Phillips-Mora, a species that is related to M. roreri. Trichoderma pleuroticola has also been reported as a pathogen of edible mushrooms (Sobieralski et al., 2012). The absence of mycoparasitism of these species suggests that M. roreri is not in the group of hosts.
Trichoderma antibiosis on M. roreri
Table 3 presents the results of the antibiosis test of Trichoderma on M. roreri. All isolates showed antibiosis with significant differences between them (P = 0.0001). The percentage of antibiosis fluctuated from 6.8 to 55.5 %; the highest values (40 to 55.5%) were obtained with some isolates of T. asperellum (TCC051 and TCC024) T. koningiopsis (TCC084, TCC020 and TCC063), T. pleuroticola (TCC002), T. virens (TCC021) and T. harzianum (TCC056, TCC077 and TCC115). The antibiotic action of the T. harzianum isolates has also been described on the mycelial growth of M. roreri and M. perniciosa (Bailey et al., 2008).
Table 3 Antibiosis of 50 native species to Trichoderma on Moniliophthora roreri.
| Isolate | Antibiosis (%) | Isolate | Antibiosis (%) |
|---|---|---|---|
| TTC051 | 55.5 ± 4.0 a | TTC016 | 30.9 ± 3.0 ghijklmno |
| TTC084 | 52.8 ± 2.7 ab | TTC026 | 29.7 ± 4.0 hijklmnop |
| TTC020 | 48.9 ± 5.0 abc | TTC058 | 28.5 ± 3.7 hijklmnopq |
| TTC002 | 46.0 ± 3.7 abcd | TTC076 | 28.5 ± 4.8 Ijklmnopq |
| TTC021 | 44.3 ± 3.8 bcde | TTC062 | 27.8 ± 1.5 Ijklmnopq |
| TTC024 | 43.2 ± 4.9 bcdef | TTC109 | 27.3 ± 7.2 jklmnopq |
| TTC056 | 41.2 ± 2.7 cdefg | TTC003 | 26.6 ± 3.2 klmnopq |
| TTC077 | 41.0 ± 4.0 cdefg | TTC113 | 25.8 ± 4.2mnopq |
| TTC115 | 40.5 ± 0.6 cdefg | TTC037 | 25.1 ± 4.7 mnopqr |
| TTC063 | 40.2 ± 5.6 cdefg | TTC054 | 24.7 ± 3.8 nopqrs |
| TTC027 | 38.7 ± 1.2 cdefgh | TTC015 | 23.0 ± 1.5 opqrst |
| TTC017 | 37.9 ± 3.7 defghi | TTC045 | 21.1 ± 2.0 pqrstu |
| TTC102 | 37.5 ± 6.7 defghi | TTC081 | 20.3 ± 2.6 pqrstuv |
| TTC085 | 37.1 ± 2.3 defghij | TTC047 | 19.9 ± 2.6 qrstuvw |
| TTC039 | 36.1 ± 4.0 defghijk | TTC104 | 19.8 ± 6.3 qrstuvw |
| TTC035 | 35.6 ± 5.0 defghijkl | TTC014 | 16.8 ± 3.7 rstuvw |
| TTC001 | 35.3 ± 3.3 efghijkl | TTC031 | 16.2 ± 2.6 stuvw |
| TTC004 | 34.9 ± 1.4 efghijklm | TTC086 | 16.0 ± 1.4 stuvw |
| TTC088 | 34.7± 3.9 efghijklm | TTC093 | 15.9 ± 4.0 tuvw |
| TTC073 | 33.9 ± 3.5 efghijklmn | TTC023 | 15.6 ± 2.9 tuvw |
| TTC007 | 33.4 ± 2.9 fghijklmn | TTC059 | 14.8 ± 3.9 tuvw |
| TTC028 | 32.4 ± 2.1 ghijklmno | TTC101 | 14.5 ± 3.4 uvw |
| TTC090 | 32.4 ± 3.7 ghijklmno | TTC008 | 13.1 ± 4.1 vwx |
| TTC050 | 31.7 ± 2.1 | TTC032 | 12.3 ± 1.5 wx |
| TTC009 | 31.5 ± 2.6 | TTC100 | 6.8 ± 2.5 x |
± Standard deviation of the mean. Identical letters do not show a significant difference according to the Tukey test (P = 0.0001).
The isolates of T. longibrachiatum, T. reesei and T. pleuroticola showed antibiosis on M. roreri (Table 3), even though they did not present mycoparasitism (Table 2). The presence of antibiosis without mycoparasitism suggest that the isolates have metabolites with antifungal activity, or that they do not allow the growth of the pathogen, due to the space and nutrient competition mechanisms (García-Simoes et al., 2012).
Potential antagonism of Trichoderma on M. roreri
Table 4 shows that there were significant differences (P = 0.0001) in the potential antagonism of Trichoderma on M. roreri; the percentage varied between 6.8 and 68.8 %. To evaluate the antagonism potential, such as the sum of mycoparasitism and antibiosis acting synergistically, it was observed that some isolates of T. virens (TTC017, TTC058 and TTC015), T. harzianum (TTC062 and TTC090) and T. spirale (TTC004) showed the highest values, while the lowest percentages were obtained with the isolates that did not show mycoparasitism. According to Monte (2001), the combination of parasitism and antibiosis could result in significant antagonistic levels.
Table 4 Potential antagonism of 50 isolates native to Trichoderma on Moniliophthora roreri.
| Isolate | Antagonism (%) | Isolate | Antagonism (%) |
|---|---|---|---|
| TTC017 | 68.8 ± 1.79 a | TTC016 | 42.2 ± 3.03 hijk |
| TTC004 | 65.2 ± 2.59 ab | TTC076 | 42.2 ± 3.56 hijk |
| TTC058 | 64.2 ± 1.92 abc | TTC109 | 41.6 ± 6.31 hijk |
| TTC062 | 64.0 ± 0.71 abc | TTC020 | 39.6 ± 2.19 ijkl |
| TTC090 | 62.2 ± 1.79 abc | TTC037 | 39.4 ± 3.21 ijkl |
| TTC015 | 61.6 ± 0.89 abcd | TTC051 | 38.6 ± 3.21 jkl |
| TTC104 | 60.0 ± 2.74 bcde | TTC045 | 36.6 ± 2.19 klm |
| TTC039 | 59.8 ± 3.90 bcde | TTC002 | 33.0 ± 1.87 lmn |
| TTC014 | 58.8 ± 1.79 bcde | TTC035 | 29.8 ± 3.96 mno |
| TTC115 | 58.2 ± 2.95 bcde | TTC063 | 28.0 ± 5.05 no |
| TTC085 | 57.6 ± 2.79 cde | TTC032 | 27.0 ± 1.73 nop |
| TTC059 | 57.6 ± 1.82 cde | TTC024 | 26.6 ± 2.50 nop |
| TCC023 | 57.6 ± 1.52 cde | TTC001 | 25.6 ± 2.30 opq |
| TTC047 | 57.0 ± 3.16 cde | TTC031 | 25.0 ± 3.80 opq |
| TTC073 | 54.0 ± 2.35 def | TTC093 | 20.8 ± 3.96 pqr |
| TTC077 | 53.4 ± 3.78 ef | TTC027 | 19.6 ± 0.55 qr |
| TTC100 | 53.2 ± 1.30 ef | TTC088 | 17.2 ± 1.92 rs |
| TTC056 | 52.4 ± 2.19 efg | TTC007 | 16.8 ± 1.48 rs |
| TTC021 | 49.2 ± 4.32 fgh | TTC028 | 16.2 ± 1.00 rs |
| TTC084 | 47.4 ± 1.40 fgh | TTC026 | 15.0 ± 2.00 rst |
| TTC009 | 46.8 ± 2.17 fghi | TTC003 | 13.2 ± 1.64 st |
| TTC102 | 46.8 ± 5.17 fghi | TTC113 | 13.0 ± 2.12 st |
| TTC086 | 45.0 ± 3.67 ghij | TTC081 | 10.0 ± 1.22 tu |
| TTC054 | 44.4 ± 3.21 hij | TTC101 | 7.2 ± 1.48 u |
| TTC050 | 42.8 ± 2.17 hijk | TTC008 | 6.8 ± 1.79 u |
± Standard deviation of the mean. Identical letters do not show a significant difference according to the Tukey test (P = 0.0001).
Mycelial growth of Trichoderma
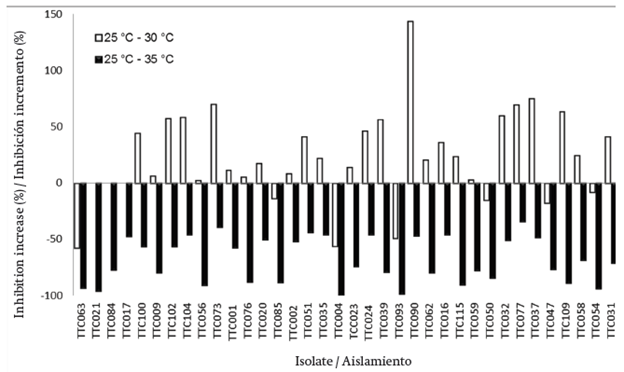
The statistical analysis showed significant differences (P = 0.0001) in the mycelial growth of the Trichoderma isolates in each temperature that was assessed. The results are presented in Table 5. At 25 °C, mycelial growth varied between 21 and 40 mm. The TTC063 and TTC084 strains of T. koningiopsis, and TTC021 and TCC017 of T. virens obtained the highest growth at 60 h. At 30 °C, the mycelial growth fluctuated between 18.3 and 40 mm; the TCC021, TCC017, TCC102 and TCC104 strains of T. virens, TCC084 of T. koningiopsis, and TCC100, TCC073 and TCC090 of T. harzianum expressed the highest growth. When going from 25 to 30 °C, 30 out of 40 isolates increased their growth and three maintained it (TTC021, TTC084 and TTC017). Figure 1 shows the graphic comparison of the changes that happened on the mycelial growth of the Trichoderma isolates with temperature changes. At 35 °C, mycelial growth fluctuated from 2.1 to 29 mm and the TCC017 strain (T. virens) presented the highest growth. At this temperature, all the isolates decreased the mycelial growth with respect to the one obtained at 25 and 30 °C; the inhibition fluctuated from 23 to 99.5 % (Figure 1). All isolates grew in the three increased temperatures; however, the range of favorable temperatures for 82 % of the isolates was 25 to 30 °C. In this regard, Jalil, Norero, and Apablaza (1997) reported that the optimal temperature for T. harzianum is 27 °C. The notable growth of all strains in an interval between 25 and 35 °C suggests the adaptability of the high temperatures where cacao is grown.
Table 5 Mycelial growth of 40 isolates native to Trichoderma at 25, 30 and 35 °C.
| Isolate | Mycelial growth (%) | ||
|---|---|---|---|
| 25 °C | 30 °C | 35 °C | |
| TTC063 | 40.0 ± 0 a | 26.1 ± 0.3 efgh | 10.1 ± 0.2 hi |
| TTC021 | 40.0 ± 0 a | 40.0 ± 0 a | 7.9 ± 0.1 jk |
| TTC084 | 40.0 ± 0 a | 40.0 ± 0 a | 19.0 ± 0.7 cd |
| TTC017 | 40.0 ± 0 a | 40.0 ± 0 a | 29.0 ± 1.0 a |
| TTC100 | 33.3 ± 1.0 b | 40.0 ± 0 a | 21.9 ± 0.1 bc |
| TTC090 | 32.7 ± 1.0 b | 34.0 ± 1.2 b | 14.7 ± 0.3 ef |
| TTC102 | 31.9 ± 1.4 bc | 40.0 ± 0 a | 21.0 ± 0.7 bc |
| TTC104 | 31.8 ± 1.1 bc | 40.0 ± 0 a | 23.3 ± 0.1 b |
| TTC056 | 31.6 ± 2.2 bcd | 32 ± 1.7 bc | 9.6 ± 0.1 ij |
| TTC073 | 30.7 ± 2.8 bcde | 40.0 ± 0 a | 23.9 ± 0.5 ab |
| TTC001 | 30.5 ± 0.5 bcdef | 32.2 ± 0.9 bc | 19.9 ± 0.8 bcd |
| TTC076 | 30.0 ± 0.1 bcdeg | 30.8 ± 2.0 bcd | 10.4 ± 0.3 hi |
| TTC020 | 29.7 ± 0.5 bcdefgh | 32.2 ± 1.4 bc | 20.9 ± 0.3 bc |
| TTC085 | 29.4 ± 0.6 bcdefghi | 27.3 ± 0.6 defg | 10.0 ± 0.02 hi |
| TTC002 | 29.2 ± 1.8 bcdefghij | 30.4 ± 0.5 bcde | 20.2 ± 0.5 bcd |
| TTC051 | 28.8 ± 1.1 bcdefghij | 34.2 ± 0.2 b | 21.5 ± 0.9 bc |
| TTC035 | 28.6 ± 0.9 bcdefghij | 31.6 ± 1.2 bcd | 21.0 ± 1.0 bc |
| TTC004 | 27.6 ± 3.2 cdefghijk | 18.3 ± 1.3 k | 2.1 ± 1.0 n |
| TCC023 | 27.6 ± 2.0 cdefghijk | 29.5 ± 0.6 bcdef | 14.0 ± 1.1 efg |
| TTC024 | 26.9 ± 1.5 defghijkl | 32.5 ± 1.2 bc | 19.8 ± 0.9 bcd |
| TTC039 | 26.9 ± 0.2 efghijkl | 33.6 ± 1.7 b | 12.3 ± 0.2 fgh |
| TTC093 | 26.0 ± 0.6 fghijkl | 18.5 ± 0.7 k | 3.2 ± 0.2 m |
| TTC090 | 25.6 ± 1.0 ghijklm | 40.0 ± 0 a | 18.7 ± 1.5 cd |
| TTC062 | 25.6 ± 0.7 ghijklm | 28.1 ± 0.3 cdefg | 11.6 ± 0.4 ghi |
| TTC016 | 25.5 ± 1.1 hijklmn | 29.7 ± 0.6 bcdef | 18.7 ± 0.2 cd |
| TTC115 | 25.1 ± 0.5 ijklmn | 28.0 ± 1.2 cdefg | 7.7 ± 0.2 k |
| TTC059 | 24.5 ± 0.6 jklmno | 24.9 ± 1.1 ghi | 11.6 ± 1.1 ghi |
| TTC050 | 24.3 ± 2.2 klmno | 22.3 ± 0.4 hij | 9.7 ± 0.5 ij |
| TTC032 | 24.0 ± 1.3 klmnop | 30.3 ± 0.7 bcdef | 16.8 ± 1.0 de |
| TTC077 | 23.6 ± 0.6 klmnop | 30.8 ± 1.5 bcd | 19.1 ± 0.5 cd |
| TTC037 | 23.2 ± 1.2 lmnop | 30.6 ± 0.8 bcd | 16.6 ± 0.5 de |
| TTC047 | 22.2 ± 2.8 mnop | 20.0 ± 2.1 jk | 10.6 ± 0.2 hi |
| TTC109 | 22.1 ± 0.8 mnop | 28.3 ± 1.0 cdefg | 7.4 ± 0.3 k |
| TTC058 | 22.0 ± 0.7 mnop | 24.6 ± 0.1 ghi | 12.3 ± 0.1 fgh |
| TTC054 | 22.0 ± 1.1 mnop | 21.1 ± 3.6 jk | 5.5 ± 0.08 l |
| TTC031 | 21.8 ± 0.5 nop | 25.9 ± 0.1 fghi | 11.7 ± 0.9 ghi |
| TTC086 | 21.1 ± 1.4 opq | 22.3 ± 3.2 ij | 10.5 ± 0.7 hi |
| TTC014 | 20.9 ± 0.3 opq | 23.1 ± 1.0 hij | 11.7 ± 0.4 ghi |
| TTC015 | 20.6 ± 2.0 pq | 22.3 ± 1.3 hij | 11.6 ± 0.1 ghi |
| TTC045 | 18.6 ± 2.6 q | 25.3 ± 3.5 ghi | 6.7 ± 0.1 kl |
± Standard deviation of the mean. Identical letters do not show a significant difference according to the Tukey test (P = 0.0001).
Production of Trichoderma conidia
The statistical analysis showed significant differences (P = 0.0001) in the production of conidia of the Trichoderma isolates in each evaluated temperature (Table 6). At 25 °C, the production fluctuated from 1.4 x 10⁷ to 3.1 x 10⁹ conidia·mL-1. The strains with the highest production were TTC063 and TTC051 of the T. koningiopsis and T. asperellum species, respectively. At 30 °C, the production of conidia varied between 0.05 x 10⁸ and 2.6 x 10⁹ conidia·mL-1; the TTC102 and TTC017 strains of T. virens, and TTC115 of T. harzianum presented the highest production. At this temperature, 65 % of the isolates increased the production of conidia in relation to the production obtained at 25 °C (Figure 2). At 35 °C, the production of conidia varied between 0 and 3.9 x 10⁸ conidia·mL-1. The TTC084 isolates (T. koningiopsis), TTC104 and TTC016 (T. virens) showed the highest production. At this temperature, 97.5 % of the isolates decreased the production of conidia, with respect to the obtained conidia at 25 and 30 °C; six isolates showed total inhibition (Figure 2). The inhibition fluctuated from 12.3 to 100 %. Only the TTC104 (T. virens) isolate increased the production of conidia, in regards to the values obtained at 25 and 30 °C.
Table 6 Conidia production of 40 isolates native to Trichoderma at 25, 30 and 35 °C.
| Isolate | Production (conidia·mL-1) | |||||
|---|---|---|---|---|---|---|
| 25 °C | 30 °C | 35 °C | ||||
| TTC063 | 3.1 x 10⁹ ± 1.6 x 10⁸ | a | 1.3 x 10⁹ ± 3.3 x 10⁸ | efgh | 1.2 x 10⁶ ± 2.1 x 10⁵ | lm |
| TTC051 | 2.1 x 10⁹ ± 2.4 x 10⁸ | b | 1.1 x 10⁹ ± 1.6 x 10⁸ | fghij | 2.7 x 10⁶ ± 1.0 x 10⁵ | I |
| TTC001 | 1.9 x 10⁹ ± 3.5 x 10⁷ | bc | 1.8 x 10⁹ ± 5.4 x 10⁷ | bc | 4.9 x 10⁶ ± 1.5 x 10⁵ | h |
| TTC035 | 1.8 x 10⁹ ± 1.1 x 10⁸ | bc | 1.2 x 10⁹ ± 1.0 x 10⁸ | efghi | 1.3 x 10⁷ ± 2.7 x 10⁶ | g |
| TTC102 | 1.8 x 10⁹ ± 1.4 x 10⁸ | bc | 2.6 x 10⁹ ± 2.4 x 10⁸ | a | 4.2 x 10⁷ ± 3.5 x 10⁶ | e |
| TTC084 | 1.6 x 10⁹ ± 1.2 x 10⁸ | bcd | 8.9 x 10⁸ ± 3.9 x 10⁶ | ijklm | 3.9 x 10⁸ ± 2.6 x 10⁷ | a |
| TTC002 | 1.6 x 10⁹ ± 2.1 x 10⁸ | cd | 1.3 x 10⁹ ± 2.2 x 10⁸ | efgh | 2.1 x 10⁶ ± 5.1 x 10⁵ | Ij |
| TTC020 | 1.4 x 10⁹ ± 3.6 x 10⁷ | de | 1.2 x 10⁹ ± 5.2 x 10⁷ | efghij | 1.7 x 10⁶ ± 1.0 x 10⁵ | jk |
| TTC015 | 1.3 x 10⁹ ± 2.1 x 10⁸ | def | 1.2 x 10⁹ ± 1.1 x 10⁸ | efghi | 2.5 x 10⁵ ± 0 | pq |
| TTC073 | 1.3 x 10⁹ ± 2.3 x 10⁸ | defg | 1.1 x 10⁹ ± 1.3 x 10⁸ | fghij | 6.4 x 10⁶ ± 3.5 x 10⁵ | h |
| TTC024 | 1.3 x 10⁹ ± 2.8 x 10⁷ | defg | 1.7 x 10⁹ ± 7.4 x 10⁷ | bcd | 1.3 x 10⁶ ± 3.0 x 10⁵ | kl |
| TTC037 | 1.2 x 10⁹ ± 1.3 x 10⁸ | efg | 1.5 x 10⁹ ± 1.4 x 10⁸ | cdef | 8.6 x 10⁷ ± 1.7 x 10⁶ | cd |
| TTC045 | 1.1 x 10⁹ ± 1.2 x 10⁸ | efgh | 2.8 x 10⁸ ± 2.8 x 10⁷ | opqr | 6.6 x 10⁷ ± 1.0 x 10⁶ | d |
| TTC021 | 1.0 x 10⁹ ± 8.7 x 10⁷ | fghi | 1.7 x 10⁸ ± 1.0 x 10⁷ | qr | 1.3 x 10⁶ ± 1.7 x 10⁵ | klm |
| TTC016 | 1.0 x 10⁹ ± 6.8 x 10⁷ | fghij | 1.4 x 10⁹ ± 1.4 x 10⁸ | defg | 1.6 x 10⁸ ± 1.5 x 10⁷ | b |
| TTC090 | 1.0 x 10⁹ ± 8.9 x 10⁷ | fghij | 1.5 x 10⁹ ± 1.9 x 10⁸ | bcde | 1.4 x 10⁶ ± 1.9 x 10⁵ | kl |
| TTC115 | 9.9 x 10⁸ ± 4.1 x 10⁷ | ghijk | 2.3 x 10⁹ ± 6.8 x 10⁷ | a | 1.0 x 10⁶ ± 0 | m |
| TTC032 | 8.4 x 10⁸ ± 3.7 x 10⁷ | hijkl | 9.7 x 10⁸ ± 8.2 x 10⁷ | hijkl | 7.4 x 10⁷ ± 4.4 x 10⁶ | d |
| TTC017 | 8.2 x 10⁸ ± 2.7 x 10⁷ | ijklm | 1.9 x 10⁹ ± 2.1 x 10⁸ | b | 2.6 x 10⁷ ± 3.0 x 10⁶ | f |
| TTC109 | 7.9 x 10⁸ ± 2.3 x 10⁷ | jklmn | 1.4 x 10⁹ ± 2.7 x 10⁷ | defg | 1.0 x 10⁸ ± 2.7 x 10⁶ | c |
| TTC058 | 7.6 x 10⁸ ± 4.4 x 10⁷ | klmn | 1.0 x 10⁹ ± 1.5 x 10⁸ | ghijk | 2.8 x 10⁵ ± 3.7 x 10⁴ | nop |
| TCC023 | 7.2 x 10⁸ ± 7.8 x 10⁶ | lmno | 1.3 x 10⁹ ± 8.5 x 10⁷ | efgh | 3.5 x 10⁵ ± 1.7 x 10⁴ | n |
| TTC085 | 7.1 x 10⁸ ± 1.6 x 10⁷ | lmno | 8.1 x 10⁸ ± 1.0 x 10⁸ | jklm | 0 ± 0 | r |
| TTC077 | 6.6 x 10⁸ ± 1.5 x 10⁷ | lmno | 1.7 x 10⁹ ± 3.4 x 10⁸ | bcd | 4.1 x 10⁷ ± 2.7 x 10⁶ | e |
| TTC062 | 6.3 x 10⁸ ± 3.6 x 10⁷ | mno | 9.0 x 10⁸ ± 1.0 x 10⁸ | ijklm | 2.6 x 10⁵ ± 2.3 x 10⁴ | nopq |
| TTC039 | 6.3 x 10⁸ ± 2.1 x 10⁷ | mno | 1.5 x 10⁹ ± 8.8 x 10⁷ | cdef | 1.4 x 10⁷ ± 5.1 x 10⁵ | g |
| TTC031 | 6.3 x 10⁸ ± 2.6 x 10⁷ | mno | 7.1 x 10⁸ ± 4.1 x 10⁷ | klmn | 2.2 x 10⁶ ± 2.1 x 10⁵ | Ij |
| TTC014 | 6.3 x 10⁸ ± 1.2 x 10⁷ | no | 1.4 x 10⁹ ± 1.1 x 10⁸ | defg | 2.5 x 10⁵ ± 1.1 x 10⁴ | opq |
| TTC047 | 6.2 x 10⁸ ± 2.3 x 10⁷ | no | 9.0 x 10⁸ ± 5.0 x 10⁷ | ijklm | 0 | r |
| TTC086 | 5.8 x 10⁸ ± 2.6 x 10⁷ | op | 8.2 x 10⁸ ± 8.0 x 10⁷ | jklm | 2.5 x 10⁵ ± 0 | pq |
| TTC009 | 4.7 x 10⁸ ± 3.1 x 10⁷ | pq | 8.0 x 10⁸ ± 8.6 x 10⁷ | jklm | 1.3 x 10⁷ ± 3.8 x 10⁶ | g |
| TTC100 | 4.7 x 10⁸ ± 4.1 x 10⁷ | pq | 1.5 x 10⁹ ± 2.6 x 10⁸ | cdef | 1.3 x 10⁷ ± 3.4 x 10⁶ | g |
| TTC004 | 4.3 x 10⁸ ± 1.9 x 10⁶ | qr | 5.6 x 10⁸ ± 2.7 x 10⁷ | mnop | 0 | r |
| TTC059 | 4.3 x 10⁸ ± 2.7 x 10⁷ | qr | 4.1 x 10⁸ ± 5.6 x 10⁷ | nopq | 3.4 x 10⁵ ± 2.5 x 10⁴ | no |
| TTC050 | 3.6 x 10 8 ± 5.0 x 10⁷ | r | 6.0 x 10⁸ ± 1.1 x 10⁸ | lmno | 0 | r |
| TTC054 | 3.4 x 10⁸ ± 2.4 x 10⁷ | r | 3.8 x 10⁸ ± 2.3 x 10⁷ | nopq | 0 | r |
| TTC076 | 3.3 x 10⁸ ± 1.4 x 10⁷ | r | 2.0 x 10⁸ ± 2.6 x 10⁷ | pqr | 2.7 x 10⁵ ± 2.9 x 10⁴ | nopq |
| TTC104 | 1.8 x 10⁷ ± 3.7 x 10⁶ | s | 0.05 x 10⁸ ±4.8 x 10³ | r | 1.9 x 10⁸ ± 1.7 x 10⁷ | b |
| TTC056 | 1.5 x 10⁷ ± 3.5 x 10⁶ | s | 1.1 x 10⁸ ± 2.2 x 10⁷ | qr | 2.0 x 10⁵ ± 0 | q |
| TTC093 | 1.4 x 10⁷ ± 2.8 x 10⁶ | s | 1.1 x 10⁸ ± 1.4 x 10⁷ | qr | 0 | r |
± Standard deviation of the mean. Identical letters do not show a significant difference according to the Tukey test (P = 0.0001).
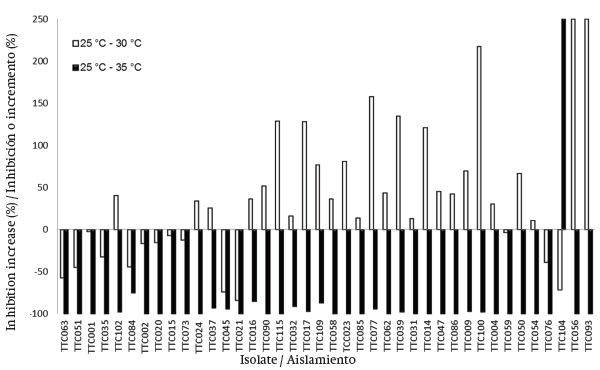
Figure 2 Inhibition changes or increase in the production of isolate conidia native to Trichoderma when surpassing 25 to 30 °C and 25 to 35 °C.
Given that the spores are the active structures of the mushrooms that are the agents for biocontrol, the production of conidia is an important characteristic for the selection of promissory isolates (Vélez-Arango, Estrada-Valencia, González-García, Valderrama- Fonseca, & Bustillo-Pardey, 2001). In this regard, 85 % of the isolates produced conidia in the interval from 25 to 35 °C (Table 6), which could be explained by the tropical origin of the isolates; however, the range of the favorable temperature for production was 25 to 30 °C. The isolates with the most production of conidia in the range of evaluated temperatures were: TTC063 (T. koningiopsis); TTC051, TTC001, TTC035 (T. asperellum); TTC102 (T. virens); and TTC115 (T. harzianum), with a superior production of 1 x 10⁹ conidia·mL-1.
Conclusions
The results show that in the cacao agroecosystem, six out of nine existing species of Trichoderma present antagonistic capacities on M. roreri. According to the data presented in this work, the Trichoderma spp. isolates showed an intraspecific variability in regards to parasitism, antibiosis, mycelial growth and sporulation. The rank of favorable temperature for the native isolates of Trichoderma was 25 to 30 °C. Based on the evaluated characteristics, the promissory isolates for the biological control of M. roreri are: TTC017 of T. virens, and TTC090, TTC039 and TTC073 of T. harzianum. The variability of the isolates in the assessed characteristics demonstrates the importance of in vitro characterization and manifests the potential of the native species of Trichoderma for the development of bio fungicides on M. roreri. Future studies will have to be implemented for the evaluation of the isolates selected under field conditions.

