


Servicios Personalizados
Revista
Articulo
 Inglés (pdf)
 Artículo en XML
 Referencias del artículo
 Enviar artículo por email
Indicadores
-
 Citado por SciELO
 -
 Accesos
Links relacionados
-
 Similares en
SciELO
Similares en
SciELO
Compartir

 Permalink
Revista Chapingo serie ciencias forestales y del ambiente
versión On-line ISSN 2007-4018versión impresa ISSN 2007-3828
Rev. Chapingo ser. cienc. for. ambient vol.21 no.2 Chapingo may./ago. 2015
https://doi.org/10.5154/r.rchscfa.2014.10.049
Modeling of land use/cover changes: prospective scenarios in the Estado de Mexico. Case study – Amanalco de Becerra
Modelado de cambios de cobertura y uso del suelo: escenarios prospectivos en el Estado de México. Estudio de caso Amanalco de Becerra
José M. Camacho-Sanabria1*; José I. Juan-Pérez2; Noel B. Pineda-Jaimes3
1 Ciencias Ambientales, Facultad de Química, Universidad Autónoma del Estado de México. Paseo Colón esquina Paseo Tollocan s/n. C. P. 50120. Toluca, Edo. de México, MÉXICO. Correo-e: jmanuelcs@live.com.mx, Tel.: (722) 1581 333 (*Autor para correspondencia).
2 Instituto de Estudios sobre la Universidad, Universidad Autónoma del Estado de México. Paseo Tollocan 1402 pte., Ciudad Universitaria. C. P. 50110. Toluca, Edo. de México, MÉXICO.
3 Facultad de Geografía, Universidad Autónoma del Estado de México. Cerro de Coatepec s/n, Ciudad Universitaria. C. P. 50110. Toluca, Edo. de México, MÉXICO.
Received: October 14, 2014.
Accepted: June 17, 2015.
ABSTRACT
The aim of this study is to assess the dynamics and processes of change that have occurred in the municipality of Amanalco de Becerra, State of Mexico, through the construction of a spatially explanatory model of land use/cover changes (LUCC). The modeling process was carried out using DINAMICA EGO a mapping tool. Land use/cover maps for the years 1989, 1997 and 2009, as well as various explanatory physical-geographical, environmental and land tenure proximity variables, were used as map inputs. The LUCC for 2020 were modelled under two scenarios: 1) the trend model, which assumes that the annual change rates for the period 1997-2009 remain unaltered, and 2) the agropastoral model, which assumes that annual deforestation rates increase because of the establishment and development of farming activities. The analysis of the absolute values of the forest category, for each year, shows a trend towards the loss of forest cover; by contrast, the annual rates of change in the forest category show a trend towards recovery-revegetation-reforestation processes, as a result of the implementation of government environmental programs.
Keywords: DINAMICA EGO, rates of change, spatial model.
RESUMEN
El presente estudio tiene como propósito evaluar la dinámica y los procesos de transformación ocurridos en el municipio de Amanalco de Becerra, Estado de México, mediante la construcción de un modelo espacialmente explicativo de cambios de cobertura y uso del suelo (CCUS). El proceso de modelado se realizó con la herramienta DINAMICA EGO, utilizando como insumos cartográficos los mapas de uso de suelo y vegetación de los años 1989, 1997 y 2009, y algunas variables explicativas de proximidad, físico-geográficas, ambientales y de explotación de la tierra. Los CCUS se modelaron para el año 2020 bajo dos escenarios: tendencial y agropastoril. El escenario tendencial supone que las tasas anuales de cambio del periodo 1997-2009 se mantienen, mientras que el agropastoril presume que las tasas anuales de deforestación aumentan a causa de la apertura, establecimiento y desarrollo de actividades agropecuarias. El análisis de los valores absolutos de la categoría bosque, para cada año, muestra tendencia hacia la pérdida de la cobertura forestal; por lo contrario, las tasas anuales de cambio de esta misma cobertura tienden hacia procesos relacionados con la recuperación-revegetación-reforestación, producto de la implementación de programas ambientales gubernamentales.
Palabras clave: DINÁMICA EGO, Tasas de cambio, modelo espacial.
INTRODUCTION
The Estado de Mexico is a territory in which there is wide geographical, ecological and environmental diversity, associated with different cultural patterns and spatially-organized processes that in interaction make up a complex dynamic system (Juan, 2013a). The territory is characterized by the presence of important forest resources consisting of coniferous forest, broadleaf forest, mixed forest and cloud forest (together forming the temperate forest ecosystem). The usefulness and importance of these resources lie not only in the production of raw materials and economic goods, but also in the essential role they play in the functioning of the natural system (Pineda, Bosque, Gómez, & Plata, 2009). In the temperate and semi-cold environments of the Estado de Mexico, there are pine (Pinus sp.), sacred fir (Abies religiosa [Kunth] Schltdl. & Cham.), oak (Quercus sp.), pine-sacred fir and pine-oak forest ecosystems that characterize the municipality of Amanalco de Becerra. The inhabitants of this territory, particularly ejido members and communal land owners, try as much as possible to take care of, conserve and restore ecosystems.
In recent decades, due to the development of government environmental programs, not only are forest ecosystems conserved, but they are also used sustainably. The ejido members and communal land owners of Amanalco de Becerra have benefited from these programs, among which "Community Forest Management," "Commercial Forest Plantations" and "Payment for Hydrological Environmental Services" stand out (Comisión Nacional Forestal [CONAFOR], 2008; Protectora de Bosques del Estado de México [PROBOSQUE], 2008a, 2008b, 2009, 2010). Despite the existence and implementation of these programs, there is still great concern over the need to address environmental issues such as illegal logging, wildfires, overgrazing and growth of the agricultural frontier into forest areas. These problems contribute and, in a way, cause changes in plant cover and land use. For this reason, it is of utmost importance that the authorities responsible for the care, conservation and management of forest resources, in collaboration with specialists in the area, strive to design strategies that contribute to the maintenance and restoration of forest ecosystems that characterize Amanalco de Becerra. It is therefore advisable to make a multi-temporal analysis of the land use/cover changes that have occurred in this municipality, and thus build prospective scenarios to simulate their behavior.
In recent decades, the methods and techniques related to remote sensing (Chuvieco, 2008; Lira, 2010) and geomatics (Álvarez, 2012), applied to the study, monitoring and evaluation of natural resources, have led to significant progress in public policy decision- making aimed at the conservation, management and restoration of terrestrial, aquatic, marine and wetland ecosystems. Also, the use of geographic information systems (GIS) has contributed to the development of studies with the following objectives: a) describe and evaluate, from a quantitative point of view, the dynamics of land use/cover changes in a given territory and in a temporal dimension; b) identify and predict the areas most susceptible to change; c) understand the processes that lead to changes, in relation to use and application of explanatory spatial variables and d) model change processes for building prospective scenarios (Mas & Flamenco, 2011; Veldkamp & Lambin, 2001; Xiang & Clarke, 2003).
The aim of this study was to develop a spatial model of land use/cover changes in the municipality of Amanalco de Becerra, from land-use and vegetation maps for the years 1989, 1997 and 2009, in conjunction with explanatory cartographic variables, using the DINAMICA EGO tool. This was done in order to assess the dynamics of land use and transformation processes that have occurred in the plant cover and thus build prospective scenarios.
MATERIALS AND METHODS
Characterization of study area
The municipality of Amanalco de Becerra is located in the western portion of the State of Mexico; the geographical location corresponds to the extreme coordinates: 19° 10' 36" and 19° 19' 55" NL, and 99° 54' 09" and 100° 04' 20" WL. Amanalco de Becerra covers an area of 219.5 km2, of which 123 km2 correspond to forest land use (56 %), 81.5 km2 to agricultural use (37.1 %), 13.5 km2 to livestock use (6.2 %) and 1.5 km2 to urban use (0.7 %) (Instituto Nacional de Estadística y Geografía [INEGI], 2002).
From a biogeographical perspective, the study area is located in the Mexican Transition Zone (MTZ), considered one of the major biomes of Mexico and the result of the overlapping of ecosystems that characterize the Nearctic and Neotropical floristic regions (Halffter, 2003). According to Juan (2013b), the area is an ecological transition or ecotone zone (Figure 1). The geographical and ecological conditions that describe the MTZ have made possible the origin, development and spatial distribution of various terrestrial ecosystems, especially those related to tropical and temperate environments (Halffter, 2003). In the latter, where the terrestrial ecosystems that characterize Amanalco de Becerra are located, namely: coniferous forest (sacred fir forest and pine forest), broadleaf forest (oak forest), coniferous- broadleaf forest (pine-oak forest) and pasture (PROBOSQUE, 2010).
Modeling of land use/cover changes
The explanatory model of land use/cover changes (LUCC) was built using land-use and vegetation (LUV) maps derived from the visual interpretation (interdependent classification method: Food and Agriculture Organization of the United Nations [FAO, 1996]) of Landsat TM (Thematic Mapper) satellite images for the following dates: a) December 27, 1989, b) December 9, 1997 and c) November 24, 2009 (corresponding to path 27 and row 47). The LUV maps were subjected to the thematic reliability assessment process (Mas, Diaz, & Pérez, 2003) considering the following as reference data: 1) images of very high spatial resolution of dates close to those used in this study, such as Global Map images (0.4 m) available on the Google Earth web server (Champo, Valderrama, & España, 2012); and 2) control points collected during on-site field trips on October 27, 2012 and July 4, 2013. The model was also built using proximity (at pixel level) environmental, physical-geographic and land tenure cartographic variables. Table 1 shows the map inputs used to build the model. The use and application of these inputs helped to explain the changes that have occurred in plant cover and land use in Amanalco de Becerra, from a quantitative approach.
The modeling process was performed with the DINAMICAEGO geotechnologicaltool, anenvironmental modeling program (Soares-Filho, Rodrigues, & Costa, 2009) used by the scientific community in various studies associated with modelling processes related to deforestation in tropical environments (Maeda et al., 2011; Mas & Flamenco, 2011; Pérez, Mas, & Ligmann, 2012) and urban growth (Bahadur & Murayama, 2011; Godoy & Soares-Filho, 2008). According to Mas, Kolb, Paegelow, Camacho, and Houet (2014), the DINAMICA EGO tool, compared to other programs used for LUCC modeling, is much better due to its flexibility and its possibilities of interaction with other tools, as it has most of the GIS operators and enables the development of sophisticated models.
Land use/cover change rates
To assess the dynamics and processes of land use/cover changes that have occurred in Amanalco de Becerra, change rates in the periods 1989-1997 and 1997-2009 were determined from the areas obtained for each category and each date, and based on the FAO equation (1996):

where:
r = Rate of change
A1 = Area covered by a given land use/cover at time 1
A2 = Area of the same land use/cover at time 2
n = Number of years in the period evaluated
Construction of the dynamic model of change
Building the dynamic model of change required implementing the following stages (Mas & Flamenco, 2011):
Calibration. At this stage, the LUV maps for 1989 and 1997 were overlaid to generate the probability of change matrices for the analysis categories through the Markov chain method (Eastman, 2009; Paegelow & Camacho, 2008). These matrices correspond to the transition probability rates of the observation period (1989-1997 = 8 years) and annual transition probability rates (Soares-Filho, Pennachin, & Cerqueira, 2002). Based on the latter rates, projections related to LUCC were made.
The relationship between the explanatory cartographic variables and the probability of change was established with the weights of evidence method (Bonham-Carter, 1994), which is implicit in the DINAMICA EGO tool. Weights of evidence were calculated (Soares-Filho et al., 2010) for each transition based on the explanatory mapping variables. Because weights of evidence can only be calculated for the categorical variables, it was necessary to determine intervals to categorize the continuous variables, which are shown in Table 2.
The coefficients derived from the calculation of weights of evidence were modified for some explanatory variables, based on expert knowledge. The explanatory variables for each transition were selected by observing and analyzing the graphical behavior (trend based on differentiated values) expressed by the weights of evidence and the statistical significance of their value (Mas & Flamenco, 2011). The weights of evidence method assumes that maps used as inputs in building a model must be spatially independent (Bonham-Carter, 1994). The independence shown by the explanatory cartographic variables was verified with the Crammer index. The calculation of this indicator enabled differentiating those variables that registered a high spatial correlation (Crammer > 0.5).
Simulation. Based on the weights of evidence and the aforementioned map inputs, a probability map for each transition was developed. From these maps, in association with the annual transition matrix (calibrated for the period 1989-1997), prospective land- use and vegetation change maps for 2009 (simulated maps) were made.
The DINAMICA EGO tool uses two cellular automata so that the modeled changes have a realistic spatial configuration: a) EXPANDER, which simulates changes by expansion and b) PARCHER, which generates new patches of change (Soares-Filho et al, 2002). The calculation of the parameters required by this tool for the expansion and creation of new patches (average size, variance and isometrics) was performed in ArcMap 10.1 software (Environmental Systems Research Institute [ESRI], 2012).
Evaluation. The performance of the prospective model of LUCC was assessed using a comparative analysis of the simulated 2009 map and the LUV map of the same year; the latter was a product of the visual interpretation of the 2009 Landsat TM satellite image. The comparison was based on the fuzzy similarity method that allows handling different tolerance levels (window sizes) in order to identify cases in which there is not a perfect match between the location of the simulated and observed change areas (Hagen, 2003).
Scenario building. Two scenarios for the year 2020 were projected: 1) the "trend" scenario, which assumes that the annual rates (Markov matrix) and the distribution of changes remain constant between the calibration period (1989-1997) and the simulated period (1997-2009); and 2) the "agropastoral" scenario, which assumes an increase in deforestation rates, resulting from the opening up of new spaces for the establishment and practice of farming activities. The construction of the latter scenario was based on the analysis and comparison of geospatial data associated with the LUV of the study area, which were obtained from the maps published by the INEGI (1997) and the Valle de Bravo-Amanalco de Becerra Watershed Commission (Comisión de la Cuenca de Valle de Bravo-Amanalco de Becerra, 2011).
RESULTS AND DISCUSSION
Figure 2 shows the three land-use and vegetation maps of Amanalco de Becerra, for the years 1989, 1997 and 2009. The overall reliability or accuracy of these map inputs was above 95 %. This coefficient exceeds the minimum percentage of cartographic validation, which is 80 % (Mas & Couturier, 2011).
Rates of change
In Amanalco de Becerra, the most important change processes relate to deforestation, agricultural and livestock expansion and urban growth. Table 3 reports the annual rates of change by category and period. The deforestation rate recorded for the period 1989- 1997 was -0.56 %. This coefficient is considered high compared to the overall annual deforestation rate of Nevado de Toluca National Park (located in the Estado de Mexico), which was -0.48 % over a 28-year period (1972-2000) (Franco, Regil, & Ordónez, 2006). However, this comparison requires considering the number of years of each period to compare, to avoid errors of interpretation and analysis. On the other hand, the annual deforestation rate for the 1997-2009 period decreased to -0.15 %. This behavior is similar to that recorded by the urban growth process, with 5.95 % for the first period and 1.60 % for the second. The annual rate of change for the agricultural expansion process was 0.28 % in both periods. Regarding the livestock expansion process, in the period 1989-1997 a rate of 1.96 % was recorded, whereas for the period 1997-2009 the rate decreased to -0.44 %.
Based on the data derived from the LUV maps obtained from the INEGI (1997) and the Valle de Bravo-Amanalco de Becerra Watershed Commission (2011), annual change rates recorded in the study area were 0.28 % for the forest category, -0.20 % for agriculture and -2.37 % for pasture in an 18-year period (1993-2011). Analysis of these data indicates that Amanalco de Becerra is experiencing a recovery-revegetation-reforestation process (Rosete et al., 2014), resulting from activities related to reforestation and the establishment of commercial forest plantations. By comparing the above data with the results obtained in the present study, it can be seen that, indeed, annual deforestation rates between the periods 1989-1997 and 1997-2009 decreased considerably; therefore, the forest cover of Amanalco de Becerra shows a trend towards recovery- revegetation-reforestation.
Modelling process
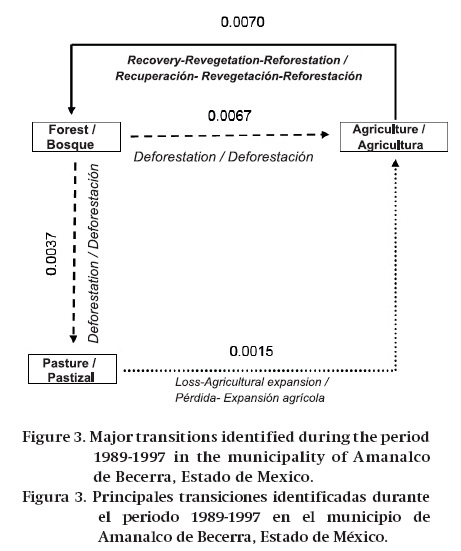
During the calibration period (1989-1997), four major transitions in the territory comprising the municipality of Amanalco de Becerra were identified: two are processes related to deforestation, one to recovery-revegetation-reforestation and the other to loss-agricultural expansion. Figure 3 shows a diagram with these transitions.
The results of the analysis and observation of the graphic behavior of the weights of evidence of each explanatory cartographic variable show that in the case of the forest-agriculture transition (deforestation), the variable distance to urban areas was excluded. This is because the weights of evidence values of this variable showed a pattern of heterogeneous behavior and complexity for modeling. Under this criterion, the explanatory variables digital elevation model (DEM), distance to urban areas, distance to roads and slopes were discarded from the forest- pasture transition (deforestation). Also, the variables distance to urban areas and distance to agriculture were not considered for the agriculture-forest transition (recovery-revegetation-reforestation). In the case of the transition from pasture to agriculture (loss-agricultural expansion), the variables slope and distance to urban areas, rural roads, highways, towns and pasture were discarded.
Based on the correlation analysis of the explanatory variables, it can be seen that due to the high values recorded, the variable protected natural areas (PNA) was excluded from the forest-agriculture, agriculture- forest and pasture-agriculture transitions. In the case of the forest-pasture transition, the PNA variable was not excluded from the simulation and scenario building phases, despite having registered values 0.5 above the Crammer index. The inclusion of PNA is attributed to the fact it constitutes an important explanatory factor in the study area for predicting deforestation- related processes. On the other hand, the explanatory variables federal property, maximum and minimum environmental fragility, and areas close to towns, pasture, highways and rural roads recorded the highest probabilities in the transitions involving deforestation. By contrast, the probabilities of this change process are lower at higher elevations (> 3,200 m).
The results obtained in this study are consistent with the data reported by Pineda et al. (2009), who argue that proximity to roads remains a determining factor in deforestation processes in the Estado de Mexico. Thus, the two studies agree that proximity to highways and rural roads is one of the main causes that influences and determines the loss of forest cover. These same authors state that the loss of forest tracts increases in ecologically fragile areas; that is, that the most fragile areas that characterize ecosystems in the Estado de Mexico have processes related to forest degradation, which is ecologically unsustainable. Indeed, the highest probabilities of deforestation in the study area were recorded in environments with maximum and minimum environmental fragility. By contrast, the DEM was one of the main explanatory variables that influenced the decrease in the probability associated with deforestation processes in the physical analysis space, especially at elevations above 3,200 m. On the other hand, it was noted that the variables slope (over 48°), distance to rural roads (1,000 to 1,400 m) and land tenure (land granted during colonial times) favor the probability of processes related to recovery- revegetation-reforestation.
In the case of the transition showing a loss-agricultural expansion process, the explanatory variables DEM, especially in the elevation range from 0 to 2,500 m, and mean environmental fragility act as the main factors benefitting the process.
In the simulation stage, transitions involving deforestation processes, particularly from forest to agriculture and forest to pasture, were observed; 92 % of the change resulted from the expansion of areas that were previously deforested, or that experienced some form of degradation. The same pattern was recorded in the transition expressing a recovery- revegetation-reforestation process, with 87 % of the change due to expansion. On the other hand, the loss- agricultural expansion process was the only transition that exhibited a higher percentage of changes due to patches (65 %).
As a result of the validation it was observed that, by using a 1 x 1 pixel window, the matching between simulated and observed changes is low: 7 % for the agropastoral scenario and 17 % for the trend scenario. However, it can be said that in the case of the trend scenario, the simulation reaches a similarity fit value of over 50 % at a tolerance distance of 135 m; for the agropastoral scenario, this percentage is noticeable at a distance of 285 m. Figure 4 represents the fuzzy similarity index in relation to window size.
Figure 5 shows an approximation of the spatial representation of the LUCC in the municipality of Amanalco de Becerra; that is, the observed changes in the 2009 map (Figure 5a) and the simulated changes for that same year and for each of the constructed scenarios (Figures 5b, 5c). Maps for the prospective scenarios (Figures 5d, 5e) are also included.
The results derived from the construction of the prospective scenarios predict two major change processes: a) an increase in annual deforestation rates (-0.51 % for the trend scenario and -1.58 % for the agropastoral scenario) and b) an increase in the annual rates associated with agricultural frontier growth processes (0.20 % for the first scenario and 1.03 % for the second) and expansion of areas for the establishment and development of livestock activities (1.58 and 2.14 %, respectively) (Figure 6).
CONCLUSIONS
Amanalco de Becerra underwent significant land use/ cover changes. The annual rates of change of the forest category between 1989-1997 and 1997-2009 indicate that forest ecosystems show a trend towards recovery- revegetation-reforestation, a situation attributed to the implementation of government environmental programs. However, the multi-temporal analysis of the forest category areas (absolute values) shows a trend towards deforestation-related processes. On the other hand, the annual change rates for the trend and agropastoral scenarios expressed a pattern of behavior that involves a decrease in forest areas and an increase in areas devoted to establishing, developing and carrying out farming activities. This would lead to the loss of diversity of biological species, deterioration and degradation of soils, changes in the microclimate and modification of the functioning of the Amanalco river and Molino-Los Hoyos river hydrographic sub-basins, and the Valle de Bravo-Amanalco watershed (included in the Cutzamala system that provides drinking water to Mexico City and the Estado de Mexico). The constructed model is a useful tool to predict land use/ cover changes in Amanalco de Becerra, as well as the potential impacts under the assumption referred to above. However, the model results are not exact and should be interpreted based on the limitations of the approach (quantitative), methods and materials used in this study.
REFERENCES
Álvarez, P. (2012). Aplicaciones de geomática para la toma de decisiones. Revista Internacional de Estadística y Geografía, 3(1), 90–99. Obtenido de http://www.inegi.org.mx/RDE/RDE_05/Doctos/RDE_05_opt.pdf [ Links ]
Bahadur, R., & Murayama, Y. (2011). Urban growth modeling of Kathmandu metropolitan region, Nepal. Computers, Environmental and Urban Systems, 35, 25–34. doi: 10.1016/j.compenvurbsys.2010.07.005 [ Links ]
Bonham-Carter, G. F. (1994). Geographic information systems for geoscientists: Modelling whit GIS. New York, USA: Pergamon. [ Links ]
Champo, O., Valderrama, L., & España, M. L. (2012). Pérdida de cobertura forestal en la Reserva de la Biósfera Mariposa Monarca, Michoacán, México (2006- 2010). Revista Chapingo Serie Ciencias Forestales y del Ambiente, 18(2), 143–157. doi: 10.5154/r.rchscfa.2010.09.074 [ Links ]
Chuvieco, E. (2008). Teledetección ambiental: La observación de la Tierra desde el espacio (3a ed.). Barcelona, España: Editorial Ariel S. A. [ Links ]
Comisión de la Cuenca de Valle de Bravo-Amanalco de Becerra (2011). Atlas informático de Valle de Bravo- Amanalco de Becerra, México. México: Autor. [ Links ]
Comisión Nacional Forestal (CONAFOR). (2008). Programa Nacional Forestal 2007-2012. México: Autor. [ Links ]
Eastman, R. (2009). IDRISI Taiga: Guide to GIS and image processing. Manual version 16.02. Worcester, MA, USA: Clark University. [ Links ]
Environmental Systems Research Institute (ESRI). (2012). ArcMap 10.1. ArcGIS Resource Center. Desktop 10. Redlands, CA, USA: Author. Obtenido de http://help.arcgis.com/es/arcgisdesktop/10.0/help/index.html#//006600000001000000 [ Links ]
Franco, S., Regil, H., & Ordóñez, J. (2006). Dinámica de perturbación-recuperación de las zonas forestales en el Parque Nacional Nevado de Toluca. Madera y Bosques, 12(1), 17–28. Obtenido de http://www.redalyc.org/articulo.oa?id=61712103 [ Links ]
Gobierno del Estado de México (2006). Actualización del modelo de ordenamiento ecológico del territorio del Estado de México. Obtenido de http://portal2.edomex.gob.mx/impactoambiental/programas_regionales/ordenamiento_estatal/index.htm [ Links ]
Godoy, M. M. G., & Soares-Filho, B. S. (2008). Modelling intra- urban dynamics in the Savassi neighbourhood, Belo Horizonte city, Brazil. In M. Paegelow, & M. T. Camacho (Eds.), Modelling environmental dynamics (pp. 319–338). Germany: Springer-Verlag. [ Links ]
Hagen, A. (2003). Fuzzy set approach to assessing similarity of categorical maps. International Journal of Geographical Information Science, 17(3), 235–249. doi:10.1080/13658810210157822 [ Links ]
Halffter, G. (1964). La entomofauna americana, ideas acerca de su origen y distribución. Folia Entomológica Mexicana, 1, 1–108. Obtenido de http://www.sea-entomologia.org/ [ Links ]
Halffter, G. (2003). Biogeografía de la entomofauna de montaña de México y América Central. En J. J. Morrone, y J. Llorente-Bousquets (Eds.), Una perspectiva latinoamericana de la biogeografía (pp. 87–97). México: Facultad de Ciencias, UNAM. [ Links ]
Instituto Nacional de Estadística y Geografía (INEGI). (1995). Marco geoestadístico municipal. México: Autor. [ Links ]
Instituto Nacional de Estadística y Geografía (INEGI). (1996). Información topográfica digital escala 1:50 000, serie II, año 1993. México: Autor. [ Links ]
Instituto Nacional de Estadística y Geografía (INEGI). (1997). Carta de uso del suelo y vegetación 1:250 000. México: Autor. [ Links ]
Instituto Nacional de Estadística y Geografía (INEGI). (1998). Información topográfica digital Escala 1:50 000. México: Autor. [ Links ]
Instituto Nacional de Estadística y Geografía (INEGI). (1999). Información topográfica digital escala 1:50 000. México: Autor. [ Links ]
Instituto Nacional de Estadística y Geografía (INEGI). (2000). Información topográfica digital escala 1:50 000. México: Autor. [ Links ]
Instituto Nacional de Estadística y Geografía (INEGI). (2002). Conjunto de datos vectoriales de uso del suelo y vegetación serie III escala 1: 250 000. México: Autor. [ Links ]
Instituto Nacional de Estadística y Geografía (INEGI). (2003). Datos de relieve. México: Autor. [ Links ]
Instituto Nacional de Estadística y Geografía (INEGI). (2007). Sistema de consulta de información geoestadística agropecuaria. México: Autor. [ Links ]
Instituto Nacional de Estadística y Geografía (INEGI). (2009). Información topográfica digital escala 1: 50 000. México: Autor. [ Links ]
Instituto Nacional de Estadística y Geografía (INEGI). (2010a). Marco geoestadístico estatal. México: Autor. [ Links ]
Instituto Nacional de Estadística y Geografía (INEGI). (2010b). Marco geoestadístico municipal. México: Autor. [ Links ]
Juan, P. J. I. (2013a). Análisis del cambio de uso del suelo en una región del Altiplano Mexicano. Retos e impactos: 1986-2011. Revista OIDLES, 7(13). Obtenido de http://www.eumed.net/rev/oidles/13/cambio-uso-suelo.html [ Links ]
Juan, P. J. I. (2013b). Manejo de recursos naturales y procesos agrícolas para el turismo rural campesino en un ejido de transición ecológica de México. (Primera parte). PASOS Revista de Turismo y Patrimonio Cultural, 11(2), 237–342. Obtenido de http://www.redalyc.org/pdf/881/88125790005.pdf [ Links ]
Lira, J. (2010).Tratamiento digital de imágenes multiespectrales (2da. ed.). México: Universidad Nacional Autónoma de México. [ Links ]
Maeda, E., Almeida, C. M., Carvalho, A., Formaggio, A., Shimabukuro, Y., & Pellikka, P. (2011). Dynamic modeling of forest conversion: Simulation of past and future scenarios of rural activities expansion in the fringes of the Xingu National Park, Brazilian Amazon, International Journal of Applied Earth Observation and Geoinformation, 13, 435–446. doi:10.1016/j.jag.2010.09.008 [ Links ]
Mas, J. F., Díaz, J. R., & Pérez, A. (2003). Evaluación de la confiabilidad temática de mapas o de imágenes clasificadas: Una revisión. Investigaciones Geográficas, Boletín del Instituto de Geografía, UNAM, 51, 53–72. Obtenido de http://www.redalyc.org/pdf/569/56905105.pdf [ Links ]
Mas, J. F., & Couturier S. (2011). Evaluación de bases de datos cartográficas. En F. Bautista (Ed.), Técnicas de muestreo para manejadores de recursos naturales (2da. ed., pp. 675–703). México: Centro de Investigaciones en Geografía Ambiental-Instituto de Geografía. [ Links ]
Mas, J. F., & Flamenco, A. (2011). Modelación de los cambios de coberturas/uso del suelo en una región tropical de México. GeoTrópico, 5(1), 1–24. Obtenido de http://www.geotropico.org/NS_5_1_Mas-Flamenco.pdf [ Links ]
Mas, J. F., Kolb, M., Paegelow, M., Camacho, M. T., & Houet, T. (2014). Inductive pattern-based land use/cover change models: A comparison of four software packages. Environmental Modelling & Software, 51, 94–111. doi: 10.1016/j.envsoft.2013.09.010 [ Links ]
Organización de la Naciones Unidas para la Alimentación y la Agricultura (FAO). (1996). Forest resources assessment 1990. Survey of tropical forest cover and study of change processes. Obtenido de http://www.fao.org/docrep/007/w0015e/w0015e00.htm [ Links ]
Paegelow, M., & Camacho, M. T. (2008). Advances in geomatic simulations. In M. Paegelow, & M. T. Camacho (Eds.), Modelling environmental dynamics (pp. 3–54). Germany: Springer-Verlag. [ Links ]
Pérez, A., Mas, J. F., & Ligmann, A. (2012). Comparing two approaches to land/use cover change modeling and their implications for the assessment ofbiodiversityloss in a deciduous tropical forest. Environmental Modelling & Software, 29, 11–23. doi: 10.1016/j.envsoft.2011.09.011 [ Links ]
Pineda, N., Bosque, J., Gómez, M., & Plata, W. (2009). Análisis de cambio del uso del suelo en el Estado de México mediante sistemas de información geográfica y técnicas de regresión multivariantes. Una aproximación a los procesos de deforestación. Investigaciones Geográficas, Boletín del Instituto de Geografía, UNAM, 69, 33–52. Obtenido de http://www.revistas.unam.mx/index.php/rig/article/view/18003 [ Links ]
Protectora de Bosques del Estado de México (PROBOSQUE). (2008a). Programa pago por servicios ambientales. Resultados convocatoria 2007. México: Autor. [ Links ]
Protectora de Bosques del Estado de México (PROBOSQUE). (2008b). Programa pago por servicios ambientales. Resultados convocatoria 2008. México: Autor. [ Links ]
Protectora de Bosques del Estado de México (PROBOSQUE). (2009). Programa pago por servicios ambientales. Resultados convocatoria 2009. México: Autor. [ Links ]
Protectora de Bosques del Estado de México (PROBOSQUE). (2010). Inventario forestal 2010. México: Secretaría de Desarrollo Agropecuario. [ Links ]
Rosete, F. A., Pérez, J. L., Villalobos, M., Navarro, E. N., Salinas, E., & Remond, R. (2014). El avance de la deforestación en México. Madera y Bosques, 20(1), 21–35. Obtenido de http://www1.inecol.edu.mx/myb/resumeness/20.1/myb2012135.pdf [ Links ]
Smith, H. M. (1949). Herpetogeny in Mexico and Guatemala. Annals Association American Geographers, 39(3), 219–238. doi:10.1080/00045604909352007 Soares- [ Links ]Filho, B. S., Pennachin, C. L., & Cerqueira, G. (2002). DINAMICA – a stochastic cellular automata model designed to simulate the landscape dynamics in an Amazonian colonization frontier. Ecological Modelling, 154(3), 217–235. doi:10.1016/S0304-3800(02)00059-5 [ Links ]
Soares-Filho, B. S., Rodrigues, H. O., & Costa, W. L. S. (2009). Modelamiento de dinámica ambiental con Dinamica EGO. Obtenido de http://www.csr.ufmg.br/dinamica/tutorial/Dinamica_EGO_guia_pratica.pdf [ Links ]
Soares-Filho, B. S., Moutinho, P., Nepstad, D., Anderson, A., Rodrigues, H., Garcia, R., ...Maretti, C. (2010). Role of Brazilian Amazon protected areas in climate change mitigation. Proceedings of the National Academy of Sciences of the United States of America (PNAS), 107(24), 10821–10826. doi: 10.1073/pnas.0913048107 [ Links ]
Veldkamp, A., & Lambin, E. (2001). Predicting land-use change. Agriculture, Ecosystems and Environment, 85, 1–6. doi:10.1016/S0167-8809(01)00199-2 [ Links ]
Xiang, W. N., & Clarke, K. C. (2003). The use of scenarios in land-use planning. Environment and Planning B: Planning and Desing, 30(6), 885–909. Obtenido de http://www.geog.ucsb.edu/~kclarke/Papers/XiangClarke.pdf [ Links ]

