nueva página del texto (beta)
 Inglés (pdf)
 Artículo en XML
 Referencias del artículo
 Enviar artículo por email
 Citado por SciELO
  Similares en
SciELO
Similares en
SciELO 
 Permalink
Introduction
SARS-CoV-2 is a virus classified in the coronavirus subfamily, named based on its characteristics and closely related to other viruses of clinical importance as SARS-CoV and MERS-CoV (Li et al., 2020). The coronavirus is an enveloped single-stranded RNA virus with crown-like spikes on its surface and a size ranging from 60 to 220 nm. SARS-CoV-2 was first detected in Wuhan City, in the province of Hubei in China, and was rapidly reported across other countries (WHO, 2020a), producing a clinical disease later known as Coronavirus disease 2019 (COVID-19) (WHO, 2020b). A wide range of symptoms (pneumonia-like and GI-like symptoms) and sequelae threaten the lives of those infected (Grant et al., 2020). As of 2022, COVID-19 caused more than 6.9 million deaths worldwide, SARS-CoV-2, at the same time has infected approximately 768 million people, and many more remain undetected due to the poorly tracing strategies, especially in developing countries (WHO, 2022). By the beginning of 2021, the concern Delta (B.1.617.2) variant represented a global threat by substituting the other variants in many world regions. On November 26, 2021, the variant Omicron (B.1.1.529) was declared a variant of concern by the World Health Organization due to the mutations in this variant which represent a more significant risk of reinfection (WHO, 2021).
Under this scenario, many investigations focused on identifying markers for SARS-CoV-2 presence in environmental samples; SARS-CoV-2 on surfaces (Kumar et al., 2020; Pasquarella et al., 2020; Razzini et al., 2020; Zhou et al., 2020), air samples (Chia et al., 2020; Lednicky et al., 2020; Razzini et al., 2020), and water (Bivins et al., 2020; Haramoto et al., 2020), particularly important on determining the population health. However, long-term studies on SARS-CoV-2 RNA detection on different water matrices still need to be done. In this regard, Basavaraju et al. (2021) suggest the epidemiological study of coronavirus in wastewater for two purposes: early detection of outbreaks and estimating the number of people infected to help mitigate its impact on the community. According to the previous, wastewater-based epidemiology (WBE) becomes a valuable early warning tool to direct public health actions, where wastewater and other aquatic matrices are useful for pathogen surveillance. The presence of SARS-CoV-2 in the urine and feces of infected patients is confirmed by qPCR in several countries (Kim et al., 2020). However, detecting the viral genome or fragments of genetic material in the fecal discharge does not necessarily guarantee the presence of a live virus particle that can cause contagion. Further, viruses excreted through fecal matter tend to remain aggregated in the water matrix due to the Brownian movement or nucleation of aquatic particles (Mitic et al., 2021); because of the later SARS-CoV-2 is present in aquatic matrices. This study aimed to assess the recuperation rate of SARS-CoV-2 RNA in different raw aquatic matrices: wastewater (untreated and treated), seawater, and tap water, to determine the decay rate of SARS-CoV-2 RNA under controlled conditions.
Material and methods
Water matrices
Four types of water were selected to test the RNA identification and quantification through time on different water matrices: Seawater (M), two treatment plant waters: effluent (E) and influent (I), and tap water (T). The absence of SARS-CoV-2 in each water matrix before inoculation was determined by RT-PCR in real time as described in this work.
Sampling sites
500 mL of each water matrix was sampled from the sources used in the experiment. a) Seawater from Navolato, Sinaloa, México, "Nuevo Altata" 24°38ˈ42"N 107°59ˈ23"W; b) Tap water from Campo El Diez Culiacán, Sinaloa, México 24°44ˈ02"N 107°27ˈ17"W; and c) Influent and Effluent samples were taken from wastewater treatment plant, Culiacán, Sinaloa, México 24°42ˈ31"N 107°25ˈ00"W. In situ physicochemical parameters (pH, oxidation-reduction potential, total dissolved solids, dissolved oxygen, conductivity, resistivity, salinity, seawater sigma, turbidity, and temperature) of each water type were measured with the multiparameter meter Hanna HI9829 (Hanna, USA), to determine the initial conditions for each water type (Table 1).
Microcosms configuration
35 mL of water was placed into 50 mL conic tubes, and an aliquot of 2 mL from the confirmed RT-PCR positive sample was added for a final volume of 37 mL. The inoculated tube was gently mixed and incubated at room temperature (24 °C) for 62 days. Mean initial concentrations of SARS-CoV-2 RNA were determined with a standard curve using Quantitative Synthetic SARSCoV2 RNA: ORF, E, N (ATCC) in serial dilutions 105, 104, 103, 102, 101 copies uL-1.
RNA extraction
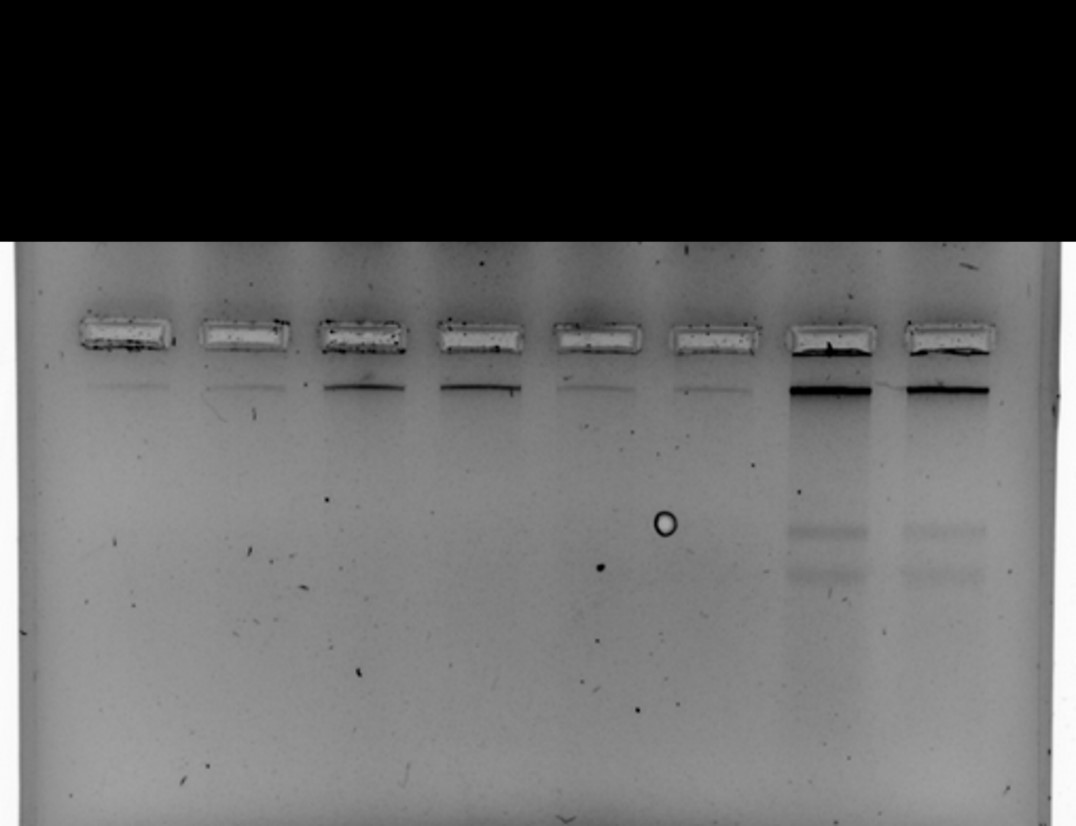
RNA extraction for SARS-CoV-2 RNA detection in the different microcosms was performed at different time intervals for 62 days; RNA was extracted by TACOTM Nucleic Acid Automatic Extraction System (GeneReach, Taiwan), using aliquots of 200 µL from each microcosm. The integrity of RNA after extraction was determined by agarose gel electrophoresis under denaturing conditions (Supplemental Figure 1).
SARS-CoV-2 detection in water samples. The detection of SARS-CoV-2 was performed by RT-PCR in real-time, and the reverse transcription of viral RNA and PCR was performed by GoTaq® 1-Step RT-qPCR using the detection 2019-nCov CDC EUA Kit (IDTechnologies, USA) with the primers and probes as follows: 2019-nCoV_N1-F 5’-GAC CCC AAA ATC AGC GAA AT-3’, 2019-nCoV_N1-R 5’-TCT GGT TAC TGC CAG TTG AAT CTG-3’, 2019-nCoV_N1-P 5’-FAM-ACC CCG CAT TAC GTT TGG TGG ACC-BHQ1-3’, 2019-nCoV_N2-F 5’-TTA CAA ACA TTG GCC GCA AA-3’, 2019-nCoV_N2-R 5’-GCG CGA CAT TCC GAA GAA-3’ and 2019-nCoV_N2-P 5’-FAM-ACA ATT TGC CCC CAG CGC TTC AG-BHQ1-3’ to detect two regions of the nucleocapsid gen of SARS-CoV-2. Samples were deemed positive when N1 and N2 amplicons were detected. Thermocycle protocol was realized in a CFX 96 (Bio-Rad, USA) with a reaction mix as follows: nuclease-free water (3.1 µL), Combined Primer/Probe Mix (1.5 µL), GoTaq Probe qPCR Master Mix with dUTP (10 µL) and Go Script RT Mix for 1-Step RT-qPCR (0.4 µL).
For positive samples the N1 amplicon of N gen of SARS-CoV-2 was used to quantify viral load in every microcosm following Liotti et al. (2021), using Quantitative Synthetic SARSCoV2 RNA: ORF, E, N (ATCC) in serial dilutions 105, 104, 103, 102, 101 copies uL-1, RNA of each time (n = 3) was used for RT-qPCR (CFX 96, Bio-Rad). Values of the standard curve were used to determine the number of copies on unknown samples. To calculate kinetic decay, the following formula was used: Number of viral copies (copies/mL) = (1000/Ve) (Ev/Ea) where Ve: sample volume for extraction; Ev: eluted sample from extraction y Ea: extracted volume used for amplification.
Statistical analyses.
Two-way ANOVA, Tukey´s media comparison (Factors water matrix and days), and main effects graphics were realized with GraphPad 8.0.1 (Prism). The same software was used to analyze the one-phase decay analyses to determine the half-life, r2, RSME, and k values for each water matrix. K values were used to calculate the T90, the time required to achieve a 90 % (one log) reduction as described by (Ahmed et al., 2020).
Results and discussion
The in vitro kinetics of SARS-CoV-2 RNA was determined on different water matrices (Figure 1): seawater, two wastewater (Influent and effluent), and one domestic use matrix (tap water). All water samples had similar pH~7. Influent water had the lowest percentage of dissolved oxygen, followed by tap water (0 and 0.2 ppt TDS, respectively), and influent was also the most turbid water. Sea water had more conductivity than any other and the highest salinity value (Table 1). After inoculating SARS-CoV-2 into each water type microcosm, they were tested for the next 62 days to determine the longest time SARS-CoV-2 RNA could be detected (Supplemental table 1).
Table 1 Water physicochemical parameters
| Parameter | Units | Water matrix | |||
|---|---|---|---|---|---|
| Seawater | Influent | Effluent | Tap water | ||
| pH | pH | 7.97 | 7.28 | 7.30 | 7.09 |
| ORP1 | mV | 155.5 | -118.4 | 164.7 | 323.5 |
| Dissolved Oxygen | % | 7.5 | 0.0 | 6.7 | 0.2 |
| Conductivity | mS/cm2 | 54.80 | 1.046 | 0.955 | 0.287 |
| Resistivity | MΩ∙cm | 0.0 | 0.0010 | 0.0010 | 0.0035 |
| TDS2 | ppt Tds | 27.32 | 492 | 477 | 144 |
| Salinity | PSU | 36.14 | 0.48 | 0.47 | 0.14 |
| Sea Water Sigma | σt | 23.9 | - | 0.0 | 0.0 |
| Turbidity | FNU | 12.3 | 262 | 7.9 | 0.0 |
| Temperature | °C | 26.03 | 28.31 | 28.54 | 24.25 |
1Oxidation-reduction potential, 2Total dissolved solids
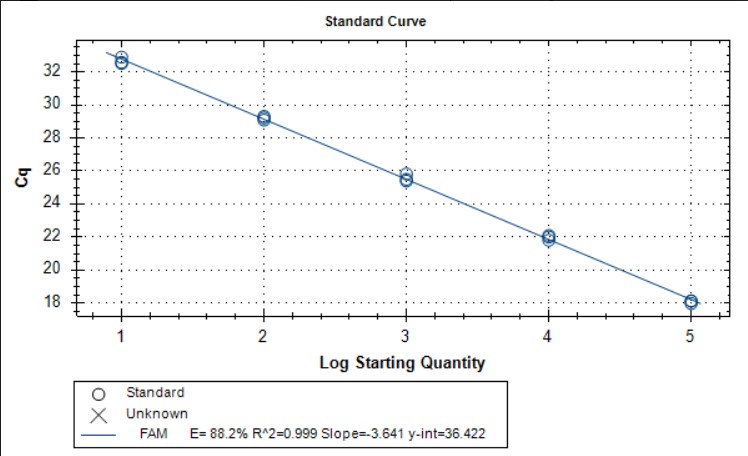
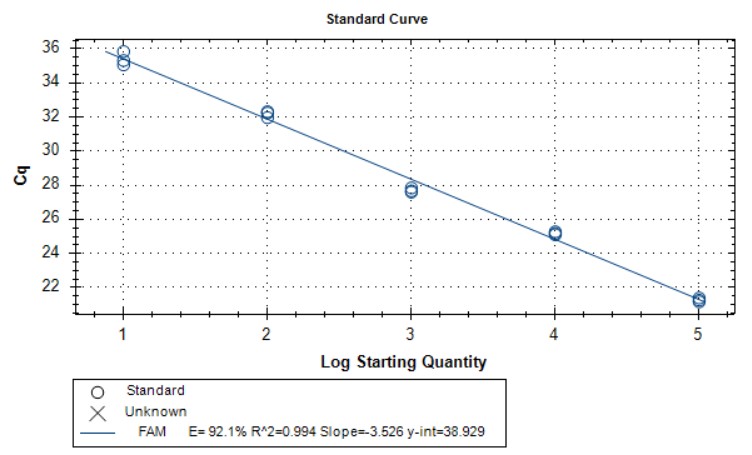
Positive RNA samples detected at different times were used to determine the viral load using Quantitative Synthetic SARS-CoV-2 RNA: ORF, E, N (ATCC) in serial dilutions 105, 104, 103, 102, 101 copies µL-1 (n = 3). The values of each water sample at each time (n = 3) were used following Liotti et al. (2021) to determine the total concentration per mL in each initial sample. Samples were analyzed in two batches each one with a respective standard curve with values of E=92.1 %, R2=0.994, Slope= -3.526 and E=88.2 %, R2=0.999, Slope= -3.641 (Supplemental figures 2 and 3 figure s 3).
ANOVA and main effects analyses
As expected by the nature of RNA molecules, the two-way ANOVA (Table 2; supplemental table 2) indicates the significance not only of both factors: days (p = 0.0001) and water matrix (p = 0.0001) on the viral load detected, but also the significance of the interaction of both factors (p = 0.0001).
Table 2 Source of variation and significance of each factor and interaction.
| Source of variation | % of total variation | P value |
|---|---|---|
| Interaction | 22.48 | <0.0001 |
| Days | 55.58 | <0.0001 |
| Water matrix | 20.77 | <0.0001 |
| Subject | 0.5095 | 0.0003 |
The factor days (Figure 2) had an inverse relationship between the viral load and the time lapsed. The more time SARS-CoV-2 viral particle remained in the water; the less RNA detected by RT-PCR in real time. Interestingly even during the full time of this experiment (62 days), SARS-CoV-2 RNA was still detected, this has implications for the use of RNA as a biomarker for genomic surveillance of SARS-CoV-2. Results of Tukey´s comparison of main factor days and water matrix are presented in supplemental tables 3 and 4 table 4.
On the other hand, the water matrix had a significant impact on the recuperation of viral RNA through time (Figure 2), highlighting the tap water matrix where the viral load detection was constant during the experiment time. Also, the mean values after 62 days for effluent wastewater and seawater showed no difference till the end of the experiment.
Water matrix and viral load
The concentration of viral RNA detected showed the highest decay between the 9 and 20 days in effluent and influent wastewater matrices, but not for seawater, where the decay was constant in the experiment post-inoculation (Figure 2).
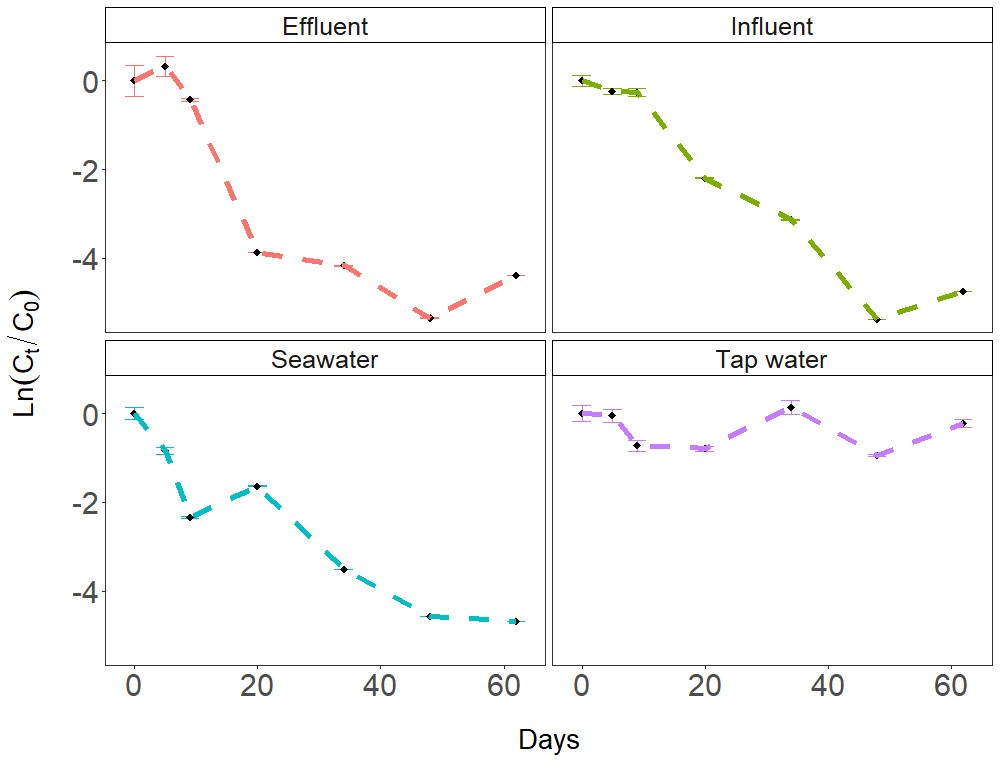
Figure 1 Viral load of SARS-CoV-2 on different water matrices. Ln (Ct/C0) of the viral load vs time in days post inoculation of microcosmos (n = 3). The upper and lower bars for each point represent the standard deviation.
Seawater viral RNA was detected until the final of the experiment of 62 days. Seawater is a recreational matrix where people gather in large numbers, sometimes in extreme proximity, which is a reasonable argument to consider monitoring SARS-CoV-2 can be useful for WBE studies. Mordecai & Hewson (2020) suggest that members of the Nidovirales group, which includes human coronaviruses, may be distributed in diverse environments such as seawater; other studies have assessed the risk of the presence of SARS-CoV-2 on this environmental matrix. To date, Sala-Comorera et al. (2021) suggest that viral particles show a rapid infectivity decay in seawater, also, De Rijcke et al. (2021) detected a rapid decay in viral particles in seawater, with a maximum decay of 99 % of viral load in 2 days of exposition under this scenario. In our study in the seawater matrix, the SARS-CoV-2 RNA was still detected for 62 days at 24 °C under controlled laboratory conditions, Ahmed et al. (2020) work remark on the importance of temperature on SARS-CoV-2 detection, finding that temperatures near 4 ºC are related with a lower decay in SARS-CoV-2 viral load when compared with 15, 25 and 37 ºC. Moreover, temperature and physicochemical parameters such as salinity (Table 1) become a hurdle in SARS-CoV-2 detection for the data generation for WBE studies.
In untreated (Influent) and treated (Effluent) wastewater, the analysis showed that SARS-CoV-2 is detectable from 0 to 62 days (1,488 h). Monitoring wastewater treatment plants has been used as a window to know about community health status through wastewater-based epidemiology of viral pathogens, including COVID-19 (Aguiar-Oliveira et al., 2020). Considering both sources of wastewater from a treatment plant: influent and effluent, the viral load on the influent sample showed a steady decline during the experiment; meanwhile, in effluent water, it can be noted a faster reduction of the SARS-CoV-2 detection, the first 20 days (Figure 2). Ahmed et al. (2020) showed the decay of SARS-CoV-2 RNA in untreated wastewater at 25 ºC ranging from 10.5 to 15.5 days as necessary to reduce 1 Log10. Our results show a similar decay for the initial stages of wastewater from both influent (untreated municipal wastewater) and effluent; however, it is important to consider that influent (Untreated) and effluent (Treated) waters may vary depending on the location of the water treatment plant, this is due that influent water composition is dependent of completely of the surrounding human activities.
Finally, in tap water, SARS-CoV-2 RNA could be detected along the study, from time 0 to day 62 (1,488 h), at minimal variation. These results suggest the stability of viral genetic material in this type of water, which did not show a notable logarithmic reduction between time intervals, thus, becoming a potential risk to the community health. The lack of harsh conditions in this matrix (Table 1) could have helped the most prolonged detection of all water tested. These results suggest the suitability of tap water as a reservoir for long-time SARS-CoV-2 viral particles; despite the low probability of occurrence, this result not only highlights that the decay effect is dependent on the water matrix, but also, can be a source to identify potential risks associated to sub-optimal tap water treatment.
The long-term stability of SARS-CoV-2 RNA in this study reflects the potential use of wastewater as an indicator of the presence of this virus in the environment, making it a valuable tool for epidemiological surveillance at early and advanced stages of sanitary emergencies in developing and developed countries (Gerrity et al., 2021; Giraud-Billoud et al., 2021). The use of wastewater-based epidemiology is relevant for estimating the prevalence of COVID-19 in communities due to the possibility of detecting the virus in wastewater before the clinical cases outburst; however, it is necessary to implement an adequate strategy for sampling and clinical testing. The inclusion of environmental parameters for correlational studies and the evaluation or refining of methodologies to improve the possibilities and sensitivity for SARS-CoV-2 RNA detection in wastewater (Kumar et al., 2020; Randazzo et al., 2020; Sherchan et al., 2020; Thompson et al., 2020). Polo et al. (2020) also highlighted the importance of wastewater-based epidemiology, considering several factors like sampling, viral recovery, and identifying viral RNA as key to reporting the indirect effect on RNA levels in wastewater. In this sense, it is crucial to consider the implementation of QMRA to evaluate the potential risk of SARS-CoV-2 to better understand and prevent its burden on human health (Kitajima et al., 2020).
Viral load decay of SARS-CoV-2 RNA in environmental raw aquatic matrices
GraphPad 8.0.1 (Prism) was used to determine the half-life (days to half total decay), r2 (model fit), RSME (root mean square error), and k (decay rate constant) values for each water matrix. k values were used to calculate the T90 (time required to achieve a 90 % (one log) reduction). The behavior of the tap water during the 62 days of the experiment did not have an appropriate fit (0.1297) for the one-phase decay model used to determine the data mentioned above. However, this model was fit for the other three water matrices with r2 from 0.8930 to 0.9240 (Supplemental Table 5); the fastest time for the half-life of SARS-CoV-2 RNA was on the effluent wastewater with 15 days average. Since effluent water from treatment plants has physical and chemical treatments before being liberated to the wild, this environment represents a harsh place for viral RNA detection. The most prolonged half-life of all the water matrices was influent wastewater with 43 days; this water could be considered a harsher environment for viral RNA detection. However, its physicochemical characteristics depend entirely on the nearby population and the activities developed in the community. Because of that, the detection of SARS-CoV-2 viral RNA could vary from community to community. Interestingly till the finalization of the experiment (62 days), the effluent water required around 50 days for one log reduction; meanwhile, influent water required 143 days on average for the same reduction. Seawater has different physicochemical parameters to the other water matrices; nonetheless, it has a similar decay rate to the influent water with a half-life of 32.23 days and a T90 of 107 days.
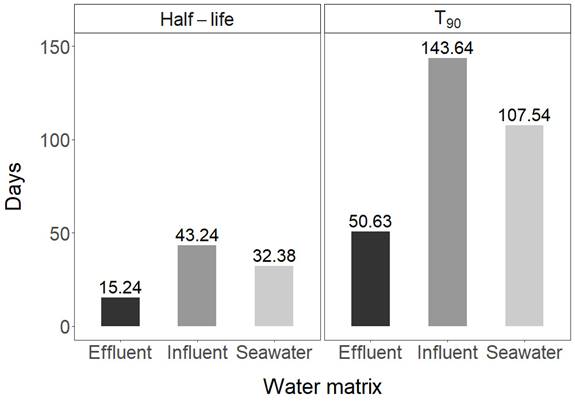
Figure 2 Viral load decay of SARS-CoV-2 RNA in environmental raw aquatic matrices, Half-life, and T90 values for each water matrix are shown for each water matrix. r2 for one-step decay of effluent, influent, and seawater was 0.89, 0.92, and 0.89 respectively.
In this study, we successfully demonstrated the different kinetics of detection of SARS-CoV-2 RNA on different water matrices where the dynamic of SARS-CoV-2 was shown to have the potential to be used as a monitoring tool. However, our study is limited to the controlled conditions in the laboratory environment. Hence, more information about the other environmental variables that could affect SARS-CoV-2 RNA detection is needed. In this regard, Ahmed et al. (2020) evaluated the decay of SARS-CoV-2 under different temperatures (4, 15, 25 and 37 ºC); their results suggest that temperature is an essential factor for the stability and decay of SARS-CoV-2 in water samples such as untreated wastewater, autoclaved wastewater, and tap water. Despite of limitations of our study, results allow us to imply that wastewater is an essential matrix for viral genetic material surveillance for WBE, widely studied in recent years as a product of the sanitary emergence of COVID-19 by SARS-CoV-2 (Ahmed et al., 2020; Gerrity et al., 2021). Nonetheless, the detection of viral SARS-CoV-2 RNA cannot be related to the structural integrity of the virus, even more, some studies demonstrate the absence of cytopathic effects in cell culture when exposed to SARS-CoV-2 isolated from wastewater and rivers (Rimoldi et al., 2020), in some cases detecting the decay on infectivity after only 4 h, also has been found that that this process rate is dependent on the water matrix in which SARS-CoV-2 is present (Sala-Comonera et al., 2021). However, in less harsh water matrices such as tap water, it is possible to find infectious viral particles of SARS-CoV-2 for 35 days (Fukuta et al., 2021); more studies need to apply cell culture and microscopy to determine the infective potential of the viral particles isolated in this study.
Conclusions
In this study, we demonstrate the stability and kinetics of the detection of SARS-CoV-2 RNA in different water matrices. The effect of environmental factors on the survivability of SARS-CoV-2 in aqueous environments can help in risk assessment and the planning of sanitation infrastructure. Seawater and wastewater harsh conditions constrain SARS-CoV-2 RNA recovery, while in tap water, the viral genetic material remained for the longest time. The surveillance of seawater and wastewater for SARS-CoV-2 can be a leading indicator of dynamics in the COVID-19 burden or its possible re-emergence in a community and serve as a tool for Water-Based Epidemiology, especially where resources are limited. The high stability of SARS-CoV-2 RNA in several water matrices is valuable as a tool for viral surveillance but also as being subjected to QMRA studies since data imply these waters as viable routes of SARS-CoV-2 dissemination and possibly transmission.