


![Características productivas del pasto rosado [Melinis repens (Willd.) Zizka]](/img/es/prev.gif)


 nueva página del texto (beta)
 Inglés (pdf)
 Artículo en XML
 Referencias del artículo
 Enviar artículo por email
 Citado por SciELO
  Similares en
SciELO
Similares en
SciELO 
 Permalink
Introduction
Sugarcane (Saccharum officinarum) represents the largest source of sucrose production worldwide (Lu et al., 2017). By 2021, sugarcane cultivation worldwide reached 1,869, million tons (FAO. 2022) of which 10,859,800 tn are from sugarcane production in Peru (MIDAGRI, 2022), therefore it can be recognized that it is a crop of economic relevance.
One of the problems in the sugar industry is starch presence, a natural component of sugarcane, which causes losses and operational inconveniences during the sugar production process, negatively affecting the quantity and quality of sugar crystals obtained as processing products (Nascimento & Verbi, 2019; Zhou et al., 2008). This component is a natural polysaccharide produced in the green leaves of plants and is stored in multiple plant tissues as insoluble granules (Cole et al., 2015). Starch consists of two types of glucose polymers: amylose which is essentially a linear molecular chain, and amylopectin which is a branched molecule (Quintero et al., 2016). In sugarcane, unlike most carbohydrate-storing plants, the most stored carbon is in the form of sucrose, not starch. Consequently, starch levels in sugarcane stalks are very low, reaching approximately only 0.01% of their fresh weight (Ferreira et al., 2008). However, the starch content is higher in leaves and growth points (Figueira et al., 2011). It is noteworthy that the amount of starch present in sugarcane depends on various factors such as the season, plant variety, prevalent diseases, degree of maturity, processing method, analytical method, weather conditions, stress, and soil type (Eggleston et al., 2007). Nevertheless, even in small quantities, the presence of starch in sugarcane juice can cause issues due to an increase in viscosity (Viginotti et al., 2014; Misra et al., 2022) and it inhibits crystallization and increases sucrose loss through molasses (Figueira et al., 2011).
The adverse effects of starch presence during sugarcane processing result from the behavior of starch granules during hydration and heating (Zhou et al., 2008). When starch granules are heated between 60 °C and 70 °C, they begin to absorb water as the temperature rises and start to swell, increasing their volume. This process of gelatinization is characteristic of starch. Furthermore, if heat is further increased, the granules can break and disperse amylose and amylopectin, forming a gel (Peña, 2009). Upon cooling, amylose chains undergo a process known as retrogradation, which influences the distribution of starch in sugarcane juice processing products (Zhou et al., 2008).
If the amount of starch that passes into the molasses, after clarification, exceeds 150 ppm, it will affect the process. This starch coagulation will lead to the formation of larger particles with higher density and increased molasses viscosity, which negatively impacts the crystallization speed in the tanks. It prevents the exhaustion of syrups and complicates purging in the centrifuges (Penados, 2004). Similarly, the change in the molecular order of starch granules that occurs within a narrow temperature range, leading to the gelatinization of granules, results in irreversible swelling and the loss of crystalline structure (Brumovsky, 2014). Due to the effects of starch on the process, industries seek alternative solutions to avoid these operational issues and material losses in sugar production.
Traditionally, starch present in sugarcane juice has been treated by acid hydrolysis; however, the specificity of the enzymes, and the absence of secondary reactions, among other advantages, have placed enzymatic hydrolysis as a promising alternative for the industry (Klasson et al., 2022; Rajesh & Gummadi, 2021; Quinteros et al., 2016; Monteiro & De Olivera. 2010). The enzymes used at the industrial level for starch removal in sugarcane juice are α-amylases (E.C.3.2.2.1.1), which catalyze the hydrolysis of α-1, 4-glycosidic bonds in starch forming low molecular weight products such as glucose, maltose, maltotriose and other oligosaccharides (Monteiro & De Olivera, 2010). The enzymatic conversion of starch includes a gelatinization stage, which comprises the dissolution of starch granules to form a viscous solution; liquefaction, which comprises partial hydrolysis and loss of viscosity; and saccharification, which comprises the production of glucose and maltose by hydrolysis (Li et al., 2019).
The alpha-amylase enzyme from Bacillus licheniformis is one of the most efficient solutions for starch hydrolysis since it works in a high-temperature range and acts only on the α -1,4 glycosidic bonds found in the amylose and amylopectin chains that make up starch, randomly breaking them down to produce glucose and maltose as end products (Martinez, 2005), thus eliminating the production problems mentioned above. Furthermore, it is known that enzymatic hydrolysis of starch by amylases is influenced by the physicochemical characteristics of the substrate, the nature and concentration of the enzyme, and the environmental conditions in which the process is carried out, such as temperature and pH, and the reaction time (Sirohi et al., 2021; Prompiputtanapon et al., 2020; Quinteros et al., 2016). Therefore, this research aimed to optimize the environmental conditions (enzyme concentration and reaction time) for the enzymatic starch hydrolysis in sugarcane juice using response surface methodology.
Material and Methods
Raw material, enzyme and starch
Sugarcane (Saccharum spp hybrid) of the Mex 73-523 variety, harvested in Caylan, district of Nepeña, province of Santa, Ancash region, Peru, was used. A commercial enzyme α-amylase from Bacillus licheniformis (Sigma-Aldrich/ CAS RN®: 9000-85-5) marketed by Merck Peruana S.A. was used in all the experiments. This product has a pH range of 5-9, and is stable between 40 to 60 °C at pH 7, according to the technical data sheet its maximum activity was shown at 90 °C. Corn starch (GRM198 from BioGenicsLab) and pure sucrose ≥ 99.5% analytical grade from Bioxtra/ CAS RN®: 57-50-1, were used.
Enzymatic characterization
Preparation of reagents and samples
A 0.05 M potassium phosphate buffer solution was prepared at pH 7 to be used as a solvent in all experiments. Subsequently, a corn starch solution (500 ppm) was prepared in the buffer, heated in a microwave oven for 1:30 minutes, then placed in an ice bath for 1 minute. Finally, the solution was subjected to 30 min sonication, thus obtaining a homogeneous solution (Cole et al., 2016). Also, a 0.25 M HCl solution was prepared for acid inactivation of the enzyme in all experiments.
Determination of Optimal pH and Temperature
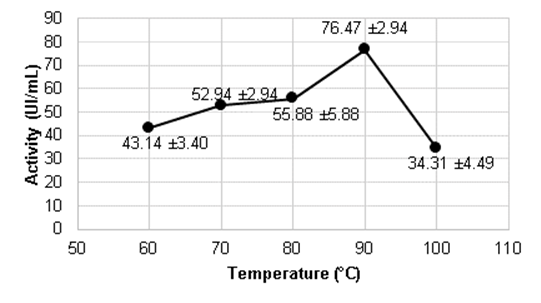
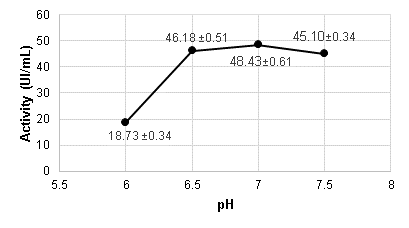
Experiments were conducted to determine the optimal pH and temperature values for the alpha-amylase enzyme from Bacillus licheniformis, the environmental conditions in which it can express its maximum catalytic potential during enzymatic hydrolysis. For the temperature test, a 500 ppm starch solution was prepared with 0.05 M potassium phosphate buffer, pH 7, and 2.7 mL of this solution was placed in a test tube with 0.3 mL of the enzyme for 20 minutes at temperatures of 60, 70, 80, 90, and 100 °C. To determine the optimal pH, 500 ppm starch solutions were prepared with potassium phosphate buffer at pH values of 6, 6.5, 7, and 7.5, and they were subjected to a temperature of 90 °C for 20 minutes. Reactions were stopped by acid inactivation, with the addition of 150 µL of 0.25 M HCl to the tubes, followed by placement in an ice bath. Finally, the hydrolysis products were determined as reducing sugars using the dinitrosalicylic acid method (DNS) (Miller, 1959) and reported in terms of maltose. It was confirmed that the starch hydrolysis products were primarily maltose, with negligible concentrations of glucose in the order of 0.031 g/L, and the enzymatic activity was calculated in IU/mL according to equation 1.
Where:
The molar mass of maltose is 340 g/mol.
The reaction volume is 30 mL and the enzyme volume is 3 mL (1:100 dilution).
Linearity range
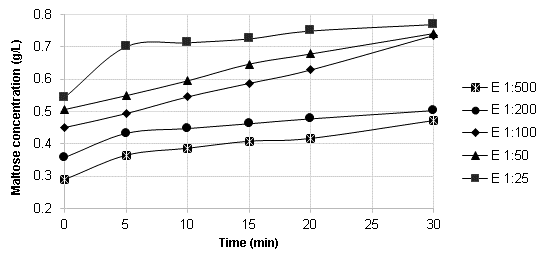
To determine the linearity range of the enzyme, the reaction rate (product formation) of enzyme dilutions (1:25, 1:50, 1:100, 1:200, and 1:500) in the buffer solution, acting on the 500 ppm starch solution, was measured. For this purpose, 6 test tubes containing 2.7 mL of the starch solution were incubated in a water bath at 90 °C for 3 minutes, and 0.3 mL of enzyme dilution was added and allowed to react for 0, 5, 10, 15, 15, 20, and 30 minutes. The reaction was stopped by acid inactivation by adding 150 µL of 0.25 M HCl to the tubes and placing them in an ice bath afterward. An enzyme blank and a substrate blank were also prepared. Finally, the production of maltose as reducing sugars was determined by the Dinitrosalicylic Acid - DNS method, with which the enzyme activity was then calculated according to equation 1.
Enzymatic activity
Enzymatic activity was determined by measuring the initial reaction rate of reducing sugar release from starch, and the experiment was conducted in triplicate. The reference dilution and reaction time defined in the linearity range evaluation were used. For this purpose, 2.7 mL samples of a starch solution (500 ppm) were incubated with 0.3 mL of an enzyme solution (1:100) at 90 °C for a total time of 20 minutes. The reaction was stopped by acid inactivation by adding 150 µL of 0.25 M HCl to the tubes and placing them in an ice bath afterward. An enzyme blank and a substrate blank were also prepared. Finally, the production of reducing sugars was measured by the DNS method and subsequently, the enzyme activity was calculated according to Equation 1. In the present study, the volumetric activity (IU/mL) and specific activity (IU/ mg protein) of the enzyme solution were measured, where IU was defined as the amount of enzyme required to release 1 μmol of reducing sugars (maltose) per minute. Additionally, protein concentration was determined using the Bradford method (Bradford, 1976).
Determination of kinetic parameters
For the kinetic parameters determination, the effect of the substrate concentration on the initial rate of the reaction was measured, evaluating the enzyme action in different dilutions of the starch solution (200, 300, 400, 500, 600, 600, 700, 800, 900, and 1000 ppm) at 90 °C. The enzyme dilution and reaction time defined in the linearity range evaluation were used as references. Subsequently, reducing sugars (maltose) were quantified, and then the initial rates (g/L*min) were determined to apply the Lineweaver & Burk method (1934) for the determination of kinetic parameters, specifically Vmax and Km, by graphically analyzing 1/V0 as a function of 1/S0, as equation 2.
Where:
The slope is KM /Vmax
The abscissa at the origin (1/v0 = 0) is -1/KM
The ordinate at origin (1/[S]0= 0) is 1/Vmax
Optimization of the enzymatic hydrolysis process of starch in a synthetic sugarcane juice medium.
Synthetic sugarcane juice medium
A 1L synthetic sugarcane juice medium was prepared from a 0.05 M potassium phosphate buffer solution at pH 7, in which starch and sucrose were dissolved until achieved concentrations of 500 ppm and 16°Brix, respectively, heated in a microwave oven for 1:30 minutes, then placed in an ice bath for 1 minute. Finally, the solution underwent 30 minutes of sonication, resulting in a homogeneous solution (Cole et al., 2016). The synthetic medium was placed in a sterilized glass container and stored under refrigeration until further use. The obtained synthetic sugarcane juice medium was characterized by determining the °Brix (Norma NMX-F-436-SCFI, 2011), percentage of polarization (Automatic Polarimeter, Analytical Autopol I Rudolph Research), and reducing sugars using the dinitrosalicylic acid (DNS) method.
Experimental design
For the optimization of the enzymatic hydrolysis process, a response surface methodology was employed using a central composite rotational design (RCCD) with two factors (independent variables): enzyme concentration (ppm) and reaction time (min); and as response variables (dependent variables): maltose concentration (g/L), hydrolyzed starch (%), and productivity (g/L.h). The experimental design consisted of 11 experiments, including 4 points corresponding to a 22 factorial design, 3 central points, and 4 axial points, with α = 1.41421. The ranges of the experimental design variables were determined based on preliminary tests and literature references. The levels of the independent variables and the experimental design with coded variables are shown in Tables 1 and 2, respectively.
Table 1 Levels of the independent variables of the study
| VARIABLES | LEVELS | ||||
|---|---|---|---|---|---|
| -1.41 | -1 | 0 | +1 | +1.41 | |
| Enzyme concentration (ppm) | 500 | 573 | 750 | 927 | 1000 |
| Reaction time (min) | 10 | 13 | 20 | 27 | 30 |
Table 2 RCCD experimental design for starch hydrolysis by alpha-amylase enzyme.
| Independent Variables | ||||
|---|---|---|---|---|
| Real | Coded | |||
| N° | Enzyme concentration (ppm) | Reaction time (min) | Enzyme concentration (ppm) | Reaction time (min) |
| 1 | 573 | 13 | -1.0 | -1.0 |
| 2 | 573 | 27 | -1.0 | 1.0 |
| 3 | 927 | 13 | 1.0 | -1.0 |
| 4 | 927 | 27 | 1.0 | 1.0 |
| 5 | 500 | 20 | -1.41421 | 0.0 |
| 6 | 1000 | 20 | 1.41421 | 0.0 |
| 7 | 750 | 10 | 0.0 | -1.41421 |
| 8 | 750 | 30 | 0.0 | 1.41421 |
| 9 | 750 | 20 | 0.0 | 0.0 |
| 10 | 750 | 20 | 0.0 | 0.0 |
| 11 | 750 | 20 | 0.0 | 0.0 |
Significant terms in the model were assessed through an ANOVA at a significance level of 5%. The model fit was determined by the values of the coefficient of multiple determination (R2) and the adjusted coefficient of multiple determination (R2 -adj). Simultaneous optimization of the independent variables was performed using the desirability function (Meyers & Montgomery, 1995). All calculations and graphs were performed with Statgraphics Centurion XVI statistical software.
Enzymatic hydrolysis of starch in the synthetic medium of sugarcane juice
For the 11 RCCD experiments, a reactor system of 100 mL total volume and 30 mL of synthetic sugarcane juice medium was used, which constituted the working volume, with temperature control at 90 °C, pH 7.0, and stirring speed at 150 rpm, then the corresponding amount of enzyme was added and allowed to react for the time stipulated for each experiment. At the end of the reaction time, a sample of 3 mL was taken in a vial, and the reaction was stopped by acid inactivation using 150µL of 0.25 M HCl and keeping it in an ice bath for 3 minutes.
Determination of maltose and glucose concentration
Maltose concentration was determined from a calibration curve by the dinitrosalicylic acid - DNS method (Miller, 1959) with a maltose standard solution of 1g/L. Glucose was determined by the MonlabTest enzymatic method.
Determination of starch hydrolysis
The percentage of starch hydrolysis (%) was determined by considering the initial starch concentration and the final maltose concentration, which were related according to equation 3:
Determination of productivity
The productivity of the enzymatic hydrolysis process was determined by equation 4:
Validation of optimization parameters in sugarcane juice
For the validation of the optimization parameters obtained, sugarcane juice was extracted through the sugarcane mill in the Unit Operations laboratory of the E.A.P. Agroindustrial Engineering School of the Universidad Nacional del Santa, Chimbote, Peru. The obtained sugarcane juice was subjected to a double-liming process. For the first liming, a 25% lime solution was added until a pH of 6.3 was reached. Subsequently, the juice was heated to induce particle precipitation, which was then removed. Additionally, for the second liming, a 25% lime solution was added until a pH of 7 was achieved. The sugarcane juice was then heated to boiling to allow for particle sedimentation, which was subsequently removed through vacuum filtration. Next, 30 mL of the filtered sugarcane juice was placed in a reactor for enzymatic hydrolysis at 90 °C, pH 7, and an agitation speed of 150 rpm, following the optimized conditions for enzyme concentration and reaction time. After the reaction time had elapsed, a 3 mL sample was taken in a vial, and the reaction was stopped by acid inactivation using 150 µL of 0.25 M HCl and maintaining it in an ice bath for 3 minutes. This experiment was conducted in triplicate. Furthermore, both the filtered sugarcane juice and the hydrolysate were characterized by determining the °Brix (Norma NMX-F-436-SCFI, 2011), polarization percentage (Automatic Polarimeter, Analytical Autopol I Rudolph Research), reducing sugars by the dinitrosalicylic acid method (DNS) (Miller, 1959), and starch content (Cole et al., 2016). Finally, the maltose concentration, starch hydrolysis, and process productivity were determined as previously specified.
Results and Discussion
Enzymatic characterization
Determination of optimum temperature (°C) and pH
The alpha-amylase enzyme of B. licheniformis is characterized by being thermostable and stable in a wide pH range, for these reasons they have been rapidly introduced in industrial processes, being more active in these conditions, besides showing a thermal stability less dependent on calcium ions (Ca2+) than those of Bacillus amiloliquefaciens (Martinez, 2005).
In Figure 1 we find a marked difference between the temperatures and the one reporting the highest activity is 90 °C, which coincides with the value reported by Božić et al. (2011).
With the results of the study of the effect of temperature on enzyme activity, the activation energy was calculated as 4197.507 cal/mol and the Arrhenius equation constant as 2.4076 x 10⁴. Figure 2 shows the effect of temperature on enzyme activity according to Arrhenius.
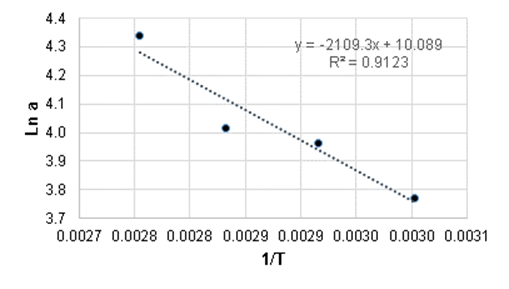
Figure 2 Effect of temperature on alpha-amylase enzyme activity according to the Arrhenius equation.
Figure 3 shows that the difference in activity values between pH 6.5 and 7.5 is not very pronounced, which reaffirms what was previously described by Martinez (2005) that the alpha-amylase enzyme from B. licheniformis operates within that pH range but experiences a significant decline in its activity at pH levels below 6.5. Therefore, the optimal pH was found to be 7, which corresponds to the pH with the highest activity.
Linearity range
Figure 4 shows the linearity range curves for the different enzyme dilutions. It is noticeable that the 1:25 enzyme dilution reaches an early plateau due to substrate depletion (Brooks, 2012). The 1:100 enzyme dilution appears to be the most suitable as it maintains the linearity range for 20 minutes. On the other hand, the 1:50 enzyme dilution also exhibited a 20-minute linearity range, but it requires a higher enzyme load.
Enzymatic activity
With the dilution 1:100 in a time of 20 minutes, pH 7 and 90 °C, a speed value of 0.0090 g/L*min was obtained, and applying equation 1, the volumetric and specific activities of the alpha-amylase of Bacillus licheniformis were determined, resulting in values of 26.40 IU/mL and 28.35 IU/mg, respectively. No information was found on other commercial alpha-amylases, which would allow comparison of the results obtained, however, to have an idea in general about the value of the catalytic potential of this alpha-amylase, it is compared with other alpha-amylases of study produced by microorganisms and that have been purified. In this regard, Božić et al. (2011) reported enzyme activity values of 7.5 IU/mL for an α-amylase from Bacillus licheniformis ATCC 9945 purified by gel filtration chromatography acting on a 104 ppm starch solution at 75 °C, pH 6.5 and for a reaction time of 15 min. On the other hand, Fincan et al. (2021) reported values of 88,981 IU/mg for an α-amylase from B. licheniformis SO-B3, an enzyme purified by DEAE-cellulose ion exchange chromatography, acting on starch at 70 °C and for a reaction time of 30 minutes; however, the enzyme dilution used in none of the studies is mentioned.
Values of kinetic parameters
The kinetic parameter values obtained for alpha-amylase were: Michaelis-Menten constant Km of 5.82 g/L and maximum velocity Vmax of 0.3 g/L*min for a 1:100 enzyme dilution and a reaction time of 20 min from the Lineweaver-Burk (1934) method as shown in Figure 5.
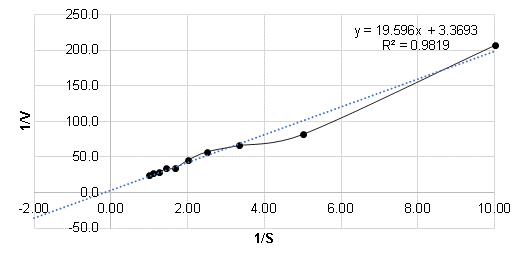
Sapadip et al. (2014) and Ferrer (2014) report Km values of 6.2g/L and 8.7g/L respectively for alpha-amylases from B. licheniformis, while Hoissain (2006) reports a Km of 4.8 g/L with B. stearothermophilus and Peña (2009) a value of 6.7 g/L with A. niger, except value of Hoissain (2006), the others were of lower affinity.
Concerning Vmax, Hoissain (2006) reported a value of 6.67 g/L*min (by unit conversion), which expresses greater reactivity.
Optimization of the enzymatic hydrolysis process
Table 3 shows the results obtained for the two independent variables in the 11 Rotational Compound Central Design (RCCD) experiments of the investigation as a function of the coded and uncoded variables.
Table 3 Final maltose concentration, starch hydrolysis and productivity as a function of coded and uncoded levels of the independent variables.
| Experiment | Enzyme concentration (ppm) | Reaction time (min) | Maltose concentration (g/L) | Percentage of hydrolysis (%) | Productivity (g/L*h) |
|---|---|---|---|---|---|
| 1 | 573 (-1) | 13 (-1) | 0.175 ± 0.02 | 35 ± 4.76 | 0.808 ± 0.11 |
| 2 | 573 (-1) | 27 (1) | 0.196 ± 0.02 | 39 ± 3.83 | 0.435 ± 0.04 |
| 3 | 927 (1) | 13 (-1) | 0.333 ± 0.01 | 67 ± 1.56 | 1.537 ± 0.04 |
| 4 | 927 (1) | 27 (1) | 0.251 ± 0.04 | 50 ± 7.23 | 0.557 ± 0.08 |
| 5 | 500 (-α) | 20 (0) | 0.197 ± 0.01 | 39 ± 2.78 | 0.590 ± 0.04 |
| 6 | 1000 (+α) | 20 (0) | 0.200 ± 0.01 | 40 ± 1.89 | 0.599 ± 0.03 |
| 7 | 750 (0) | 10 (-α) | 0.186 ± 0.01 | 37 ± 1.02 | 1.115 ± 0.03 |
| 8 | 750 (0) | 30 (α) | 0.223 ± 0.03 | 45 ± 5.01 | 0.446 ± 0.05 |
| 9 | 750 (0) | 20 (0) | 0.334 ± 0.01 | 67 ± 2.45 | 1.002 ± 0.04 |
| 10 | 750 (0) | 20 (0) | 0.264 ± 0.01 | 53 ± 2.38 | 0.793 ± 0.04 |
| 11 | 750 (0) | 20 (0) | 0.391 ±0.03 | 78 ± 5.66 | 1.173 ± 0.08 |
As shown in Table 3, the final maltose concentration values ranged between 0.175 and 0.391 g/L, which correspond to the experiments with the low and high levels for each dependent variable, respectively. The hydrolysis percentage values ranged from 35 to 78 %, also corresponded to the experiments with the low and high levels for each dependent variable. Finally, the productivity ranged between 0.435 and 1.537 g/L*h. It is worth mentioning that the central points presented coefficients of variation of 19 % for the three dependent variables mentioned respectively, which indicated the good reproducibility of the process.
In the analysis of variance (ANOVA) performed for each dependent variable, the data were fitted to a quadratic model. Concerning the final maltose concentration, it was observed that all linear, quadratic, and interaction factors were not significant (p-value < 0.05). The results demonstrated that an increase in enzyme concentration and/or reaction time does not necessarily lead to an increase in product formation. This aligns with findings reported by Sirohi et al. (2021), who studied starch hydrolysis by an alpha-amylase from a Bacillus species and determined that enzyme concentration and reaction time did not have a significant effect on starch conversion into reducing sugars. This result is because increasing the enzyme concentration in the solution enhances the binding capacity of the substrate to the active sites of the enzyme, resulting in higher conversion. However, since the amount of substrate available for hydrolysis is not increased, the reactivity of the enzyme is not increased either, therefore, it will not promote a higher product formation than the one already achieved.
Analysis of final maltose concentration
The Pareto diagram shows the absolute values of the standardized effects from the largest effect to the smallest effect. Figure 6 shows that the effect that had the greatest influence on maltose concentration was enzyme concentration and the least influence was reaction time, but both were not significant.
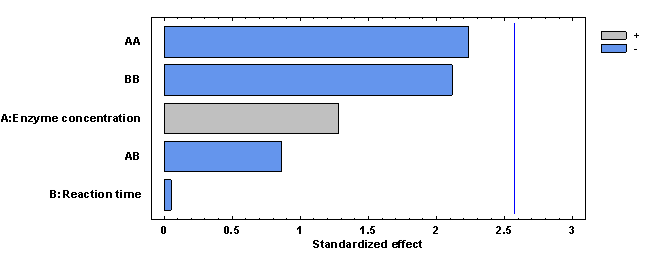
Figure 6 Pareto plot of estimated effects and interactions for maltose concentration in the synthetic sugarcane juice medium.
The mathematical model obtained in terms of its regression coefficients and in terms of the real factors, for the final maltose concentration is shown in equation 4:
The value of the coefficient of determination (R2 = 65.9945) and the adjusted coefficient of determination (R2 adj = 31.9889) indicated that the mathematical model does not adequately fit the experimental data, according to Martínez (2005), who stated that achieving a kinetic equation that represents the changes as a function of time and the experimental conditions of hydrolysis is complicated, because starch has a complex structure, and the mixture of starch and its reaction products change as a function of time and these have different molecular weights. Also, the value of the mean absolute deviation was determined following the methodology of Baş & Boyaci (2007), determining a value of AAD=13.18%, Taking into account the obtained values of R2 and absolute
average deviation (AAD) it is concluded that it is possible to determine the stationary point using Response surface methodology (RSM) but it does not mean that all the stationary points are optimal for the enzymatic reaction (Bas & Boyaci, 2007).
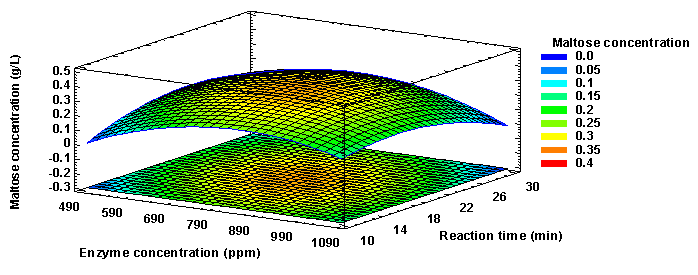
Figure 7 shows that the final maltose concentration increased up to a maximum point, after which it began to decrease. This point corresponds to values close to 800 ppm and 20 min for the enzyme concentration and reaction time, respectively. Thus, the optimum levels of enzyme concentration and reaction time were determined to be 795.63 ppm and 19.5 min, respectively, with which a final maltose concentration of 0.33 (g/L) would be obtained.
Analysis of starch hydrolysis:
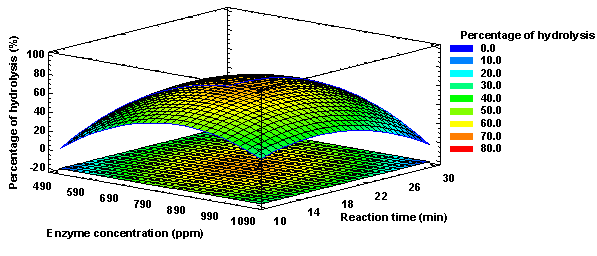
In the case of starch hydrolysis (%), it was observed that all linear, quadratic, and interaction factors were not significant (p-value < 0.05). The results of starch hydrolysis (%) described in the present investigation are directly related to those referred to the final maltose concentration; therefore, it is to be expected that the linear, quadratic, and interaction factors are not significant as shown in Figure 8 and as described above.
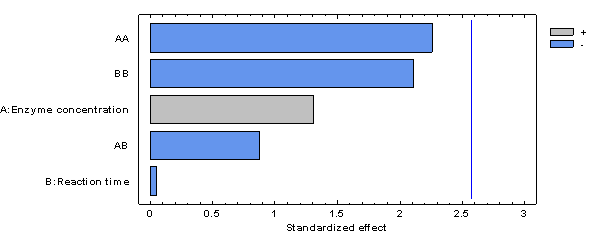
Figure 8 Pareto plot of estimated effects and interactions for the percentage of hydrolysis in the synthetic sugarcane cane juice medium.
The mathematical model obtained in terms of its regression coefficients and in terms of the real factors, for starch hydrolysis (%) is shown in equation 5:
The value of the coefficient of determination (R2 = 66.3906) and the adjusted coefficient of determination (R2 adj = 32.7812) indicated that the mathematical model does not adequately fit the experimental data. Likewise, the value of the mean absolute deviation was determined following the methodology of Baş & Boyaci (2007), determining a value of 13.375%, which together with the value of R2 define the true behavior of the system and can be used for interpolation in the experimental domain. It was also determined that for starch hydrolysis the optimal levels of enzyme concentration and reaction time would be 796 ppm and 19 min, respectively, with which a starch hydrolysis of 66.73 % would be obtained, as shown in Figure 9.
Productivity analysis
In the case of enzymatic hydrolysis productivity, it was observed that only the linear effect of reaction time (p-value < 0.05) is significant. The significant effect of reaction time on productivity is because in the calculation equation time is established as one of the variables inversely proportional to productivity; therefore, the shorter the reaction time, the higher the productivity. Figure 10 shows these effects and interactions.
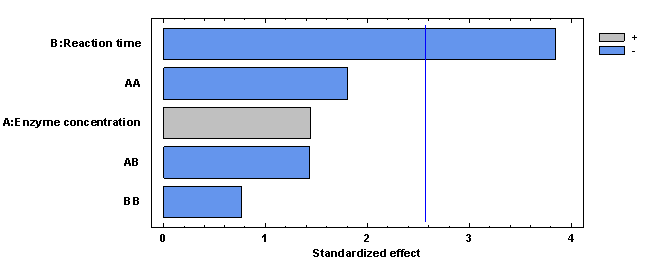
Figure 10 Pareto plot of estimated effects and interactions for hydrolysis productivity in synthetic sugarcane juice medium.
The mathematical model obtained in terms of its regression coefficients and in terms of the real factors, for productivity (g/L*h) is shown in equation 6:
The value of the coefficient of determination (R2 = 81.6152) and the adjusted coefficient of determination (R2 adj = 63.2304) indicated that the mathematical model adequately fits the experimental data. Also, the value of the mean absolute deviation was determined following the methodology of Baş & Boyaci (2007), determining a value of 14.889 %, which together with the value of R2 define the true behavior of the system and can be used for interpolation in the experimental domain. It was also determined that for productivity the optimal levels of enzyme concentration and reaction time would be 928 ppm and 10 min, respectively, with which a productivity of 1.4222 g/L*h would be obtained, as seen in Figure 11.
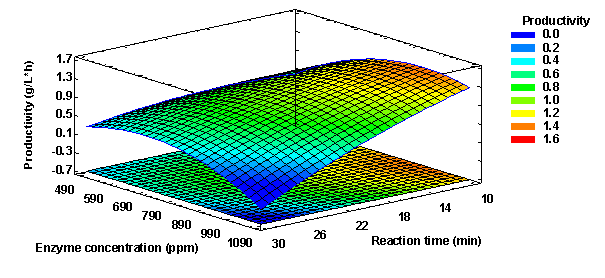
Figure 11 Response surface for productivity optimization of hydrolysis of synthetic cane juice medium hydrolysis by alpha-amylase action.
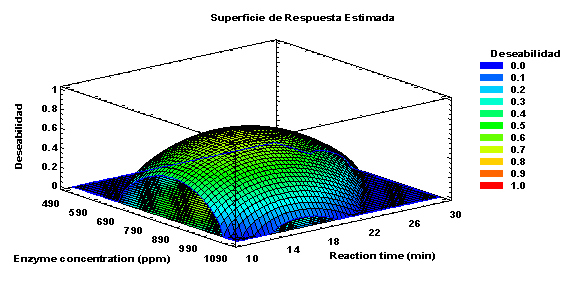
The optimization of responses, maltose concentration, hydrolysis percentage, and productivity, using the desirability function, combine these responses into a single function known as global desirability, following the optimization criteria established in the design (Derringer & Suich, 1980). The global desirability is a geometric mean of individual desirability functions. The combination of variables (enzyme concentration and reaction time) that achieves the optimal global desirability was determined. The optimal value obtained was 0.68381, where one represents the ideal situation, and zero indicates that one or more responses are outside acceptable limits (Meyers and Montgomery, 1995). The optimal values for the independent variables were found to be 817 ppm for enzyme concentration and 17 minutes for reaction time. With these values, the responses for the final maltose concentration, starch hydrolysis, and productivity were determined to be 0.328 g/L, 65.642%, and 1.135 g/L*h, respectively, as shown in Figure 12.
Validation of optimization parameters
For the validation of the results of the enzymatic hydrolysis optimization process, sugarcane juice (Saccharum spp hybrid) of the Mex 73-523 variety was used, with an alpha-amylase enzyme concentration of 817 ppm and a reaction time of 17 min. Table 4 shows the proximate composition of the sugarcane juice used before (base) and after enzymatic hydrolysis (hydrolysate). As can be observed in Table 5, values of 0.38 g/L, 73.09 %, and 1.341 g/L*h of, final maltose concentration, percentage of hydrolysis, and productivity, respectively, were reached, which corresponded to variations greater than those calculated, in 16%, 11.3%, and 18% respectively between the values predicted by the software and the experimental ones.
Table 4 Physicochemical characteristics of sugarcane juice before (base) and after enzymatic hydrolysis (hydrolyzed)
| Parameter | Sugarcane juice “base” | Hydrolyzed sugarcane juice |
|---|---|---|
| pH | 7 | 7.2 |
| °Brix | 18 | 20 |
| Sucrose (pol) (%) | 17.2 | 22.7 |
| Reducing sugars (g/L) | 8.5±0.07 | 8.8±0.05 |
Table 5 Calculated and experimental response variables of enzymatic hydrolysis of starch in sugarcane juice with the optimum values.
| Dependent Variable | Calculated | Experimental | Percentage Variation (%) |
|---|---|---|---|
| Maltose concentration (g/L) | 0.328 | 0.380 | 16.0 |
| Hydrolysis (%) | 0.656 | 0.7309 | 11.3 |
| Productivity (g/L*h) | 1.135 | 1.341 | 18.2 |
In this regard, Viginotti et al. (2014) reported a starch hydrolysis process with a porcine pancreatic α-amylase acting on a sugarcane juice with a starch concentration of 200, 000 ppm and reaching a final concentration of reducing sugars of 0.18 g/L in a reaction time of 20 min. In this regard, Sirohi et al. (2021) determined the optimum values for enzyme concentration and reaction time in a starch hydrolysis process with an α-amylase from a Bacillus species, establishing values of 50,000 ppm and 60 min, respectively, with which they obtained 85.25 g/L of reducing sugars from a 19,000 ppm starch solution. On the other hand, Božić et al. (2011) determined hydrolysis percentages close to 60% using an enzyme from α-amylase Bacillus licheniformis ATCC 9945a acting on a 1000 ppm starch solution with a reaction time of 240 min. Likewise, it has been reported that the activity of α-amylases from Bacillus licheniformis is stable up to 90° C and pH 7 (Božić et al., 2011), which were the conditions used in the present study. This enhanced stability under harsh conditions makes α-amylases from Bacillus licheniformis suitable for various industrial processes in food, fermentation, textile, and other sectors (Monteiro & De Olivera, 2010).
It is known that enzymatic hydrolysis of starch by α-amylases generates an increase in reducing sugar levels (Božić et al., 2011; Monteiro & De Olivera, 2010). This was corroborated in the present study, since the hydrolyzed sugarcane juice presented an increase in the concentration of reducing sugars, as well as in the °Brix, as shown in Table 4. The increase in the levels of reducing sugars is due to the generation of oligosaccharides and glucose as products of the hydrolysis reaction (Rajesh & Gummadi, 2021et al. 2021). Determining optimal process variables such as enzyme concentration and reaction time will enhance the performance of enzymatic hydrolysis processes applied to sugarcane juice and significantly reduce starch levels on an industrial scale.
Conclusions
The activities of the enzyme α-amylase from Bacillus licheniformis were 26.48 ± 0.04 IU/mL and 0.284 ± 0.07 IU/mg, and the values of its kinetic parameters Km and Vmax were 5.82 g/L and 0.3 g/L*h, respectively. Likewise, it was determined that the factors of enzyme concentration and reaction time were not significant concerning the final maltose concentration and starch hydrolysis; however, the reaction time was significant for the productivity of the process. It was also determined that the optimum enzyme concentration and reaction time for the process were 817 ppm and 17 min, respectively. Finally, applying the optimum environmental conditions to the limed sugarcane juice resulted in a hydrolysis of 73.1% of the starch contained in the sugarcane juice, obtaining a maltose concentration of 0.380 g/L and productivity of 1.341 g/L*h, which had variations of 11.3%, 16%, and 18% respectively about the calculated values, demonstrating that the validation process surpassed those predicted by the experimental design.

