


 nueva página del texto (beta)
 Inglés (pdf)
 Artículo en XML
 Referencias del artículo
 Enviar artículo por email
 Citado por SciELO
  Similares en
SciELO
Similares en
SciELO 
 Permalink
Introduction
Sugarcane (Saccharum officinarum) is one of the globally relevant raw materials for sugar (sucrose) production ( Lu et al., 2017). However, during the post-harvest period and the processing of sugarcane stalks, this raw material undergoes the reduction of its sucrose content due to various factors such as climatic conditions, waiting times between harvest and processing, sugarcane variety, microorganisms present, among others (Misra et al., 2020a), resulting in irreparable losses according to each stage of its origin influenced by chemical degradation (16 %), enzymatic degradation (22 %), and microbiological degradation (62 %). In this sense, Leuconostoc mesenteroides is the microbiological species that develops most rapidly in sugarcane, breaking the sucrose molecule through the enzyme dextransucrase, thus producing dextran, one of the most damaging problems, also causing mechanical damage to equipment, pipes, pumps, among others (Petit, 2021).
Dextran is an extracellular homopolysaccharide composed of glucose units linked predominantly by α-(1,6) glycosidic bonds and also containing α-(1,2), α-(1,3), and α-(1,4) bonds Khalikova et al., 2005). The structure of dextran, its degree of branching, and its structural properties vary widely depending on the specific dextran-producing microbial strain and the type of dextransucrase enzyme (Nincham et al., 2017). Dextran is responsible for many problems in the sugar industry, such as increased viscosity of sugarcane juice, deficiencies in heat transfer, and reduced sucrose crystallization, among others (Khalikova et al., 2005; Ninchan et al., 2017); hence, it is important to reduce its content in sugarcane juice.
Among the alternatives studied, the use of chemical treatments to reduce microbial concentration has been proposed Misra et al., 2020a; Misra et al., 2020b), membrane processes ( Li et al., 2020; Lu et al., 2017), and enzymatic hydrolysis processes with dextranases, which give satisfactory yields (Eggleston & Monge, 2005; Sufiate et al., 2018). In this context, dextranases (EC 3.2.1.11; α-1,6-D-glucan-6-glucanohydrolase) are enzymes produced by microorganisms such as filamentous fungi, yeasts, and bacteria. Filamentous fungi are the major commercial sources of native and recombinant dextranases (Martinez et al., 2021; Liu et al., 2019; Li et al., 2016). Dextranases hydrolyze the 1,6-α-D-glycosidic bond of the linear chain of the dextran structure at random endogenous sites and manage to break the high molecular weight structure into smaller and more manageable molecules and eventually into oligosaccharides such as isomaltotriose, isomaltose, and glucose as end products (Ninchan et al., 2017).
However, such enzymatic processes require proper selection of the enzyme and its concentration, as well as control of the environmental conditions of biocatalysis, including pH, temperature, residence time, agitation, and substrate concentration (Eggleston & Monge, 2005; Sufiate et al., 2018). Likewise, the application of dextranase in the sugar production process still needs to determine the type of enzyme and stage of the process to proceed with enzymatic hydrolysis, as each step of the sugar production process requires different conditions of temperature, pH, and sucrose concentration, among others, which affect enzyme activity and the ability to hydrolyze dextran molecules (Nimchan et al., 2017). It has been reported that reducing the dextran content in the early stages of the process is the most efficient option; therefore, the hydrolysis of dextran present in sugarcane juice by enzymatic processes has been studied (Oropeza et al., 2019).
The present investigation aimed to optimize the enzymatic hydrolysis of dextran process in sugarcane juice using response surface methodology.
Material and Methods
Raw material, enzyme, and dextran
Sugar cane (S. officinarum) of the Mexico-73 variety harvested in Caylan, Nepeña district, Santa province, Ancash region, Peru, was used. The commercial enzyme Dextranfree Xe was used in all the experiments (in non-viscous liquid form, amber or slightly yellow in color, 100 % soluble in water, with an enzymatic activity of 25,000 DU/g, produced and marketed by the company Dextranfree Xe; Produced and marketed by Enmex S.A. in Mexico City, packaged in 25 kg), is a dextranase (1,6-α-D-glucan-6-glucanohydrolase) from Chaetonium erraticum, with which enzymatic dilutions were prepared according to the conditions established in the experiments. Dextran (T-2000 Sigma Aldrich) from Leuconostoc mesenteroides NRRL B512F, which has an average molecular weight of 2,000,000 g/mol according to the supplier, was also used.
Linearity range
To determine the linearity range of the enzyme, the reaction rate of enzyme dilutions (1:2, 1:4, 1:5, and 1:10) was measured in a 0.1 M acetate buffer solution at pH 5.5 acting on a 500 ppm dextran solution. Test tubes containing 2.7 mL of dextran solution were incubated in a water bath at 45 °C for 3 minutes, 0.3 mL of enzyme dilution was added and allowed to react for 0, 10, 20, and 30 minutes. To stop the reaction, the tubes were placed in a water bath at 100 °C for 3 minutes. Then test tubes were removed from the water bath and placed on ice. An enzyme blank and a substrate blank were also used. Reducing sugar formation was determined by the dinitrosalicylic acid-DNS method (Miller, 1959).
Enzymatic activity
Enzyme activity was determined by measuring the initial reaction rate in triplicate, taking as reference the dilution and reaction time defined in the evaluation of the linearity range. For this purpose, 2.7 mL samples of a dextran solution (500 ppm) were incubated with 0.3 mL of an enzyme solution at 45 °C. Samples were taken at predetermined times and, to stop the enzymatic reaction, the samples were placed in a water bath at 100 °C for 3 minutes. The samples were then removed from the water bath and placed on ice. An enzyme blank and a substrate blank were also prepared. Finally, reducing sugar formation was measured using the dinitrosalicylic acid-DNS method (Miller, 1959). In this research, volumetric activity (DU/mL enzyme solution) and specific activity (DU/mg protein) were measured, where DU (dextranase unit) was defined as the amount of enzyme required to release 1 μmol of reducing sugars per minute, and protein concentration was determined by the Bradford method (Bradford, 1976).
Determination of kinetic parameters
For the determination of the kinetic parameters, the Michaelis-Menten constant (Km) and the maximum velocity (Vmax), the initial enzymatic reaction velocities acting on different dilutions of dextran (200, 300, 400, 500, and 600 ppm) were evaluated at 45 °C, taking as reference the enzymatic dilution and the reaction time defined in the evaluation of the linearity range. The Km and Vmax constants were determined using the Lineweaver-Burk plot (Lira & Jasso, 2013).
Mock solution sugar cane juice
A 3 L mock solution of sugarcane juice composition was prepared from a 0.1 M acetate buffer solution at pH 5.5 in which dextran and sucrose were dissolved to a concentration of 500 ppm and 15 °Brix, respectively. The mock solution was placed in a sterilized glass container and stored under refrigeration until further use. The obtained mock was characterized by determining °Brix (CNM, 2011), pH (ICUMSA 2007), viscosity using an Ostwald capillary viscometer (SI Analytics) and reducing sugars using the dinitrosalicylic acid-DNS method (Miller, 1959).
Experimental Design
For the enzymatic hydrolysis process optimization, the response surface methodology was used with a Rotational Composite Central Design (RCCD) (Balakishnan, Mohan, et al., 2022) with three independent variables: enzyme concentration (ppm), reaction time (min), and reaction temperature (°C); and as response variable the reduction of dextran content (RDC) (%). A total of 17 experiments were designed, with 8 points corresponding to a 23-factorial design, 3 central points, and 6 axial points, with α = ± 1.68. The ranges of independent variables were determined according to preliminary tests. The levels of the independent variables and the experimental design with coded variables are shown in Table 1. The results of the dependent variable were fitted to a full quadratic model, sampled in equation (1):
Where Y is the response predicted by the model, β0, βi, βj, and βij represent the model coefficients for the intercept and the linear, quadratic, and interaction terms between variables, and where X and Xj represent the independent variables. Significant terms in the model were evaluated by an analysis of variance (ANOVA) at a 5 % significance level. The model fit was determined by the values of the coefficient of multiple determination (R2) and the adjusted coefficient of multiple determination (R2-adj). Also, the value of the mean absolute deviation was determined following the methodology of Baş & Boyaci (2007).
All calculations and graphs were performed using Statgraphics Centurion XIX statistical software and Microsoft Excel 2016 software.
Enzymatic hydrolysis of dextran in mock sugarcane juice solution
For the 17 RCCD experiments, a mini-reactor system with a total volume of 250 mL and a working volume of 100 mL containing the mock was used, which was kept under constant agitation and temperature control. The process was also carried out at a constant pH of 5.5. The procedure was as follows: once the volume of mock was added and the temperature of each run was reached, the appropriate amount of enzyme was added and allowed to react for the time specified for each experiment. At the end of the reaction time, the enzyme was inactivated by placing the mini-reactors in a boiling bath for 5 minutes, then the mini-reactors were placed in ice water for 3 minutes. The mini-reactors and their contents were kept refrigerated until further analysis.
Determination of dextran content reduction
The dextran content before and after enzymatic hydrolysis was determined by spectrophotometry (ICUMSA, 2011), in which 8 mL of the sample was taken, and 1.6 mL of trichloroacetic acid (10 %) was added and filtered. From the filtrate, two 2 mL samples were taken, 2 mL of distilled water (used as blank) was added to one and 2 mL of ethanol to the other, they were allowed to stand for 20 min and then the absorbance was read at 720 nm, once the measurement was made, the dextran was calculated using the formula determined from the calibration curve shown in Equation 2:
(2)
The reduction in dextran content (RDC) was calculated using the formula shown in Equation 3 (Ninchan, et al., 2017):
Validation of the optimization parameters in sugarcane juice
To validate the optimization parameters, the levels of the optimal independent variables that significantly influenced the responses of the factorial design and response surface analysis were determined. For this purpose, sugarcane juice was extracted 60 hours after harvesting through a sugarcane mill located at the Laboratorio de Operaciones Unitarias de la Escuela Profesional de Ingeniería Agroindustrial de la Universidad Nacional del Santa. The obtained sugarcane juice was filtered and characterized by determining the soluble solids content (ICUMSA, 2011), pH (ICUMSA 2007), viscosity using an Ostwald capillary viscometer (SI Analytics), and reducing sugars using the dinitrosalicylic acid-DNS method (Miller, 1959). Subsequently, 100 mL of cane juice was loaded into a mini-reactor for enzymatic hydrolysis according to the optimized conditions. This experiment was performed in duplicate.
Linearity range
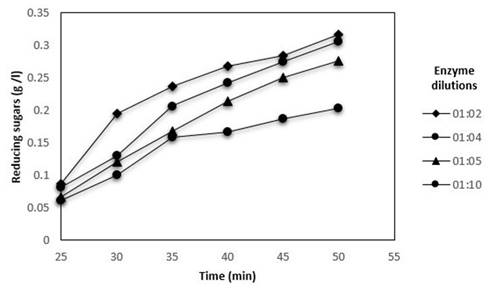
Figure 1 shows the curve of reducing sugar formation (product) as a function of time for the 4 dilutions of DEXTRAFREE XE tested. It is known that the enzymatic hydrolysis of dextran is also influenced by the number of branches present in it; therefore, in the first phase of the enzymatic process, there is an irregular release of reducing sugars, for this reason, the results of the evaluation of the linearity range are shown from minute 25. It is necessary to emphasize that in an enzymatic reaction, three phases can be distinguished: the lag phase, the linear phase, and the substrate depletion phase. The lag phase takes place immediately after mixing the reagents with the sample, it is a phase of encounter and coupling of substrate and enzyme, in the case of dextranase, in addition to its adaptation, it suffers variations with respect to the breaking of substrate bonds, this is due to the structure of the dextran since it originates from Leuconostoc mesenteroides NRRL-B512F, it has higher percentages of bonds 1-6, 95 % and 1-3, 5 % (Bourne et al., 1962), where the bonds 1-6 are weaker and easier to break, but the bonds 1-3 take longer to break, which is the reason for the destabilization in the production of reducing sugars at the beginning, until finding the progressive break, which indicates the linear phase, in which the formation of products remains constant; finally, as the reaction progresses, the substrate is exhausted (depletion phase) and the reaction rate decreases (Tena & Jorrin, 2000).
Figure 1 shows that the 1:5 dilution samples a greater linearity in a longer time, so it was determined to be the most favorable since it maintains the linearity range for 25 minutes, and this dilution was selected for this research. This confirmed what was stated by the supplier, who indicated this dilution as recommended. Oropeza et al. (2019), who performed a dextran hydrolysis analysis, also used the 1:5 dilution of the same dextran-free enzyme (ENMEX) and obtained favorable results.
On the other hand, for the determination of enzyme activity, it is necessary to perform it in the linear phase, where the only limiting factor is the concentration of the enzyme itself and the reaction conditions are optimal.
Kinetic Parameter Values
The kinetic parameter values obtained for dextranase were as follows Michaelis-Menten constant (Km) of 0.215 (g/L) and maximum velocity (Vmax) of 0.007 (g/L*min) for an enzyme dilution of 1:5 and a reaction time of 15 min.
Optimization of the Enzymatic Hydrolysis Process
Table 2shows the results obtained for the RDC (%) for the 17 RCCD experiments of the present study as a function of the coded and uncoded variables. As can be observed, the RDC (%) values ranged between 40 % and 80 %, corresponding to the experiments with low and high levels for each dependent variable, respectively, highlighting that the central points presented a coefficient of variation of 0.8 %, indicating the good reproducibility of the process.
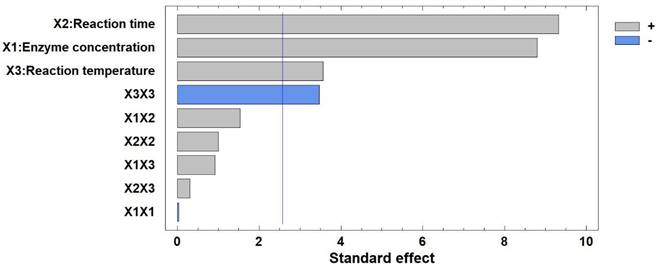
In the analysis of variance (ANOVA) (Table 3) of the experimental design of the present study, the data were fitted to a quadratic model. It was observed that the linear effects of the 3 independent variables (X1 or A, X2 or B, and X3 or C) and the quadratic effect of the reaction temperature were significant (p < 0.05).
Likewise, Figure 2 shows the Pareto chart for standardized effects, where the significant effects are verified. Revealing that the linear effect of the variables reaction time (min) and enzyme concentration (ppm) was more significant than that of the variable reaction temperature (°C).
Table 2 Reduction in dextran content (RDC) (%) of the experiments as a function of the coded levels of the independent variables
| Experiment | X1 | X2 | X3 | RDC (%) |
|---|---|---|---|---|
| 1 | -1 | -1 | -1 | 40 |
| 2 | -1 | -1 | 1 | 46 |
| 3 | -1 | 1 | -1 | 52 |
| 4 | -1 | 1 | 1 | 60 |
| 5 | 1 | -1 | -1 | 48 |
| 6 | 1 | -1 | 1 | 59 |
| 7 | 1 | 1 | -1 | 68 |
| 8 | 1 | 1 | 1 | 80 |
| 9 | -1.68 | 0 | 0 | 42 |
| 10 | 1.68 | 0 | 0 | 75 |
| 11 | 0 | -1.68 | 0 | 46 |
| 12 | 0 | 1.68 | 0 | 77 |
| 13 | 0 | 0 | -1.68 | 46 |
| 14 | 0 | 0 | 1.68 | 51 |
| 15 | 0 | 0 | 0 | 59 |
| 16 | 0 | 0 | 0 | 59 |
| 17 | 0 | 0 | 0 | 59 |
The value of the coefficient of determination (R2 = 97.51) and the adjusted coefficient of determination (R2 adj = 94.30) indicate that the mathematical model adequately fits the experimental data. Similarly, the value of the mean absolute deviation was 2.81 %, which, together with the R2 value, defines the true behavior of the system and can be used for interpolation in the experimental domain. The highest RDC values (%) were obtained at an enzyme concentration of 295 ppm, a reaction time of 39 min, and a reaction temperature of 54 °C, which correspond to the high values of the independent variables
Likewise, the values of the non-significant effects were removed from the mathematical model obtained, thus obtaining equation (4):
(4)
Correspondingly, no bibliographic references were found that specifically refer to the action under optimal conditions of the enzyme Dextranfree Xe (Enmex) on the dextran substrate to discuss these results.
Table 3 Analysis of variance for the reduction in dextran content (%)
| Source | Sum of squares | Degrees of Freedom | Mean square | F-Ratio | p-value |
|---|---|---|---|---|---|
| X1: Enzyme concentration (ppm) | 926.719 | 1 | 926.719 | 107.61 | 0.0000 |
| X2: Reaction time (min) | 1039.28 | 1 | 1039.28 | 120.68 | 0.0000 |
| X3: Reaction temperature (°C) | 150.985 | 1 | 150.985 | 17.53 | 0.0041 |
| X1 X1 | 0.0153223 | 1 | 0.0153223 | 0.00 | 0.9675 |
| X1X2 | 28.125 | 1 | 28.125 | 3.27 | 0.1137 |
| X1 X3 | 10.125 | 1 | 10.125 | 1.18 | 0.3142 |
| X2 X2 | 11.8163 | 1 | 11.8163 | 1.37 | 0.2798 |
| X2 X3 | 1.125 | 1 | 1.125 | 0.13 | 0.7284 |
| X3 X3 | 143.872 | 1 | 143.872 | 16.71 | 0.0046 |
| Total error | 60.2828 | 7 | 8.61183 | ||
| Total (corr.) | 2417.76 | 16 |
However, Figure 3 shows the contour surfaces that allow the determination of the conditions that maximize the RDC value (%) obtained in a) an enzyme concentration between 340 and 350 ppm and a reaction time between 44 and 46 min; in b) an enzyme concentration between 340 and 350 ppm and a reaction temperature between 43 and 45 °C; and in c) a reaction temperature between 45 and 47 °C and a reaction time between 44 and 46 min. Likewise, Figure 4 shows the response surfaces obtained for the RCCD of the present study, which show that a) an increase in the enzyme concentration and the reaction time favors the RDC (%) within the limits studied; in b) an increase in the temperature favors the RDC (%) up to a certain point, from which it decreases, it is also confirmed that an increase in the reaction time favors the hydrolysis reaction; in c) the effect of the reaction temperature and the enzyme concentration is confirmed.
Also, using statistical software, the conditions that optimize the reduction of the dextran content (95.51 %) were determined to be an enzyme concentration of 340 ppm, a reaction time of 45 min, and a reaction temperature of 45 °C.
On the other hand, it has been reported that a higher enzyme loading and also longer residence times favor the catalytic process of dextranases (Eggleston & Monge, 2005;Ninchan et al., 2017) since there is a greater number of active sites in contact with the substrate that operate for a longer time. It should also be considered that a lower enzyme concentration leads to a greater amount of water available to deactivate and denature the enzymatic protein structure and increase its conformational mobility, which can lead to a loss of enzymatic activity (Eggleston et al., 2011).
Regarding the effect of temperature, Eggleston & Monge (2005) reported that a temperature range between 43.3 and 54.4 °C promotes the enzymatic activity of dextranases acting on dextran (500 ppm), and Ninchan et al. (2017) reported that the activity of a dextranase from Chaetomium sp. acting on dextran (1500 ppm) is efficient at a temperature range between 35 and 55 °C, and temperatures higher than these ranges have a negative effect on hydrolysis, which is consistent with that reported in the present investigation. Similarly, it has been reported that temperatures above 65 °C promote enzyme denaturation and the partial loss of its activity (Eggleston et al., 2011).
Hence, the conditions that optimize the DRC (95.51 %) are 340 ppm enzyme concentration, 45 min reaction time, and 45 °C reaction temperature. Although in general, the response surface analysis gives a high value of dextran reduction, these conditions of a long time and high temperature are not favorable for the sugar elaboration process.
Validation of the Optimization Parameters
For the purposes of this study, the results of process optimization were validated by the response surface methodology, considering a target RDC of 70 % in sugarcane juice, for which the results obtained by the statistical software for this condition were enzyme concentration of 224 ppm, a reaction time of 32 min, and a reaction temperature of 36 °C.
Table 4shows the composition of the sugarcane juice used before (base) and after enzymatic hydrolysis (hydrolysate). Also, the mean absolute deviation value was determined for the DRC value obtained according to the methodology of Baş & Boyaci (2007), which is 11.61 %, indicating the good fit of the model to the experimental data. As for the RDC, a value of 69 % was obtained, which is consistent with the value reported by Oropeza et al. (2019), who studied the enzymatic hydrolysis process of dextran in the fermented mash (with an initial dextran content of 353 ppm) using the Dextranfree enzyme with an enzyme:substrate ratio of 1:10 at 40 °C, pH 5. 17, for 180 min. Thus, it is also stated that sugarcane juice is a better substrate than fermented mash since similar results were obtained with a shorter hydrolysis time. Likewise, it has been reported that dextranase activity is stable up to 25-30°Brix and values above this range negatively affect its activity (Oropeza et al., 2019), so the 20.42°Brix condition of sugarcane juice used in the present study should not have inhibited dextranase during dextran hydrolysis. In addition, enzymatic dextran hydrolysis is known to increase the level of reducing sugars and cause a decrease in solution viscosity (Bashari et al., 2013; Oropeza et al., 2019). The above was confirmed in the present study because, as shown in Table 3, the levels of reducing sugars and the viscosity value in sugarcane juice increased by 30 % and decreased by 10 %, respectively, after hydrolysis.
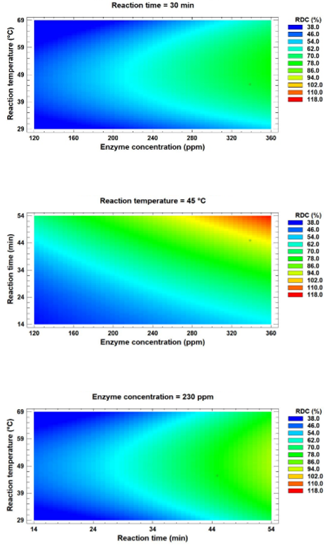
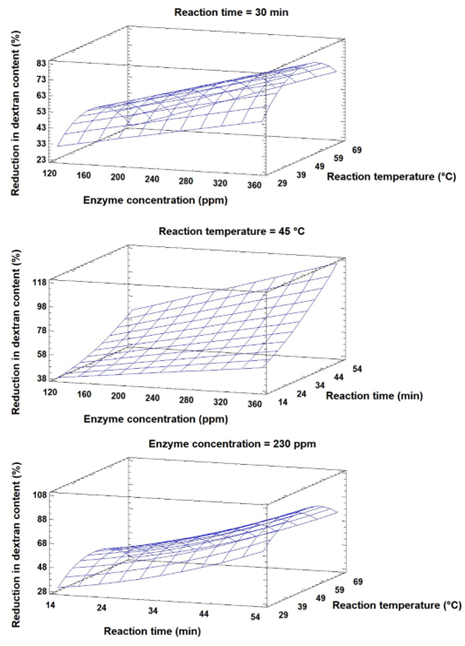
Table 4 Physicochemical characteristics of sugar cane juice before (base) and after enzymatic hydrolysis (hydrolysate)
| Parameter | Sugarcane juice | Hydrolyzed juice |
|---|---|---|
| Dextran (ppm) | 227 ± 12 | 70 ± 4 |
| °Brix | 20.4 ± 0.5 | 20.5 ± 0.1 |
| Reducing sugars (g/L) | 0.23 ± 0.01 | 0.30 ± 0.01 |
| Viscosity (cP) | 0.01 ± 0 | 0.009 ± 0 |
| pH | 5.4 ± 0.5 | 5.4 ± 0.5 |
The increase in reduced sugar content is due to the formation of isomalto-oligosaccharides with two to five glycosidic units, products of hydrolysis (Eggleston et al., 2011;Khalikova et al., 2005); while the decrease in viscosity content is a consequence of molecular fractionation of dextran present in sugarcane juice (Eggleston et al., 2011; Ninchan et al., 2017).
Conclusions
The volumetric and specific activities of the Dextranfree Xe enzyme were 0.42 ± 0.04 (DU/mL) and 4.7 ± 0.47 (DU/mg), Km was 0.215 g/L and Vmax was 0.007 g/L*min. The pivotal factors were enzyme concentration, reaction time, and temperature were relevant to the enzymatic hydrolysis process of dextran, it is suggested for the reduction of dextran content optimization by 95.51 % are 340 ppm, 45 min, and 45 °C, respectively. Finally, it was determined that the conditions that achieved a reduction in dextran content with a statistically inferential target value of 70 % in sugarcane juice were: enzyme concentration 224 ppm, time 32 min, and reaction temperature 36 °C. With these parameters, the validation of the hydrolysis in sugarcane juice resulted in a 69.2 % dextran reduction.

