


 texto en
  Inglés (pdf)
 Artículo en XML
 Referencias del artículo
 Enviar artículo por email
 Citado por SciELO
  Similares en
SciELO
Similares en
SciELO 
 Permalink
Introduction
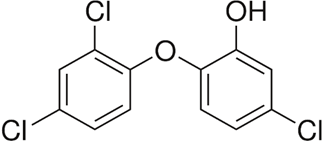
Triclosan (5-chloro-2-[2,4-dichloro-phenoxy]-phenol) (TCS) is a chemical compound commonly used in many health care products (such as toothpastes, soaps, deodorants, shampoos, cleaning supplies, and others) as a broad-spectrum antimicrobial and disinfectant agent (Dann et al., 2011). Triclosan is currently considered a contaminant of emerging concern due to its possibility to cause adverse ecological and human health effects (Witorsch et al., 2014; Silva et al., 2017). The global production of TCS was estimated at more than 1500 tons per year, where Europe is the highest producer, with 350 tons (Singer et al., 2002; Dann et al., 2011). Exposure to TCS usually occurs through beauty, household cleaning, or personal hygiene products such as shower gels, deodorants, soaps, mouthwashes, hand lotions, creams, and toothpaste. The TCS concentration in personal care products is commonly in the range of 0.1-0.3 %; therefore, these products are the primary source of TCS in the environment (Sabaliunas et al., 2003; García-Yerena et al., 2016). TCS has been found in different environmental matrices, such as surface waters and sediments, probably due to its widespread use and hydrophobicity (Pinckney et al., 2017). The main route for this compound to enter the environment after its use is through the discharge of domestic sewage or wastewater treatment plants effluent into the aquatic ecosystems, and subsequently contaminates surrounding environments (Dhillon et al. 2015; Yueh et al., 2016).
Although TCS has been found at low concentrations, its continuous discharge into the environment through several sources has raised considerable concern about the effects that it can generate on the biota (Chtourou et al., 2018). Studies on the long-term effects of TCS range from endocrine disruption, oxidative stress stimulation, and uncoupling mitochondria to interfering with ion channels (Olaniyan et al., 2016; Yueh et al., 2016; Bever et al., 2018). This compound can also promote tumorigenesis by altering the DNA methylation status and decreasing thyroxine concentrations in pregnant, fetal, and juvenile mammalians (Paul et al., 2010; Silva et al., 2017). Likewise, TCS can increase liver cell proliferation by enhancing the growth of liver cancer induced by diethylnitrosamine (Jackson et al., 2018).
Toothpaste is one of the leading personal hygiene products containing the highest concentrations of TCS. The main routes of human exposure are dermal and oral absorption as well as accidental ingestion (Jackson et al., 2018). Calafat et al. (2008) performed a study in 2003 to determine TCS concentrations in a representative sample of ≥ six years of age of the United States population, they concluded that 74 % of the analyzed urinary samples had this compound in the free and conjugated form at concentrations of 2.4 to 3 790 μg/L.
Some techniques for the detection of TCS include High-Performance Liquid Chromatography (HPLC) (Sanches-Silva et al., 2005), HPLC coupled to Mass Spectrometry (HPLC-MS) (Shen et al., 2012), and Gas Chromatography coupled to Mass Spectrometry (GC-MS) (Wu et al., 2007). Of the techniques mentioned above, HPLC is the most practical and straightforward tool for the determination of TCS in personal healthcare products (Piccoli et al., 2002; Chiapetta et al., 2011; Liu & Wu, 2012). In this paper, an economical, simple, and fast analytical method for determining TCS in toothpaste samples using HPLC with diode-array detection is presented.
Material and Methods
Chemicals
Triclosan (5-chloro-2-[2,4-dichloro-phenoxy]-phenol) (TCS) standard, HPLC-grade acetonitrile (AcN), and methanol (MeOH) were purchased from Sigma Aldrich (St. Louis, MO, USA). Ultrapure water with 18.2 MΩ/cm resistivity was obtained from a Milli-Q water system from Millipore (Bedford, MA, USA).
Equipment
An ultrasonic bath 2510MT series (BRANSON, Brookfield, CT), a Vortex-Genie 2 mixer (Scientific Industries, Bohemia, NY), and a CX 220 analytical balance (Citizen) were employed for the extraction procedure of the sample. Chromatographic columns employed were Symmetry C18 column (150 x 4.6 mm, 5 μm, Waters), Kinetex C18 (100 x 4.6 mm, 2.6 μm, Phenomenex), and monolithic Onyx C18 (100 x 4.6 mm, Phenomenex). For sample filtration, filters with a 0.22 μm pore size (Millipore, U.S.A.) were used throughout the study.
Sample preparation
Toothpaste with and without TCS as well as the other personal hygiene products was purchased from a local market in Colima, Mexico. For TCS extraction, 0.2 g of toothpaste was added to 2 mL of MeOH and then sonicated for 7 minutes. Finally, 1 mL of the supernatant was filtered (0.22 μm) and transferred into the HPLC vial for chromatographic analysis.
HPLC-DAD Analysis
Chromatographic analysis was carried out on an Alliance e2695 separation module, consisting of a quaternary pump, online vacuum degassing, autosampler, and column oven coupled to a photodiode array detector model 2996 with a wavelength range of 190-800 nm. Data acquisition, processing, and management were performed using the Empower Pro 2 Software. The whole system was acquired from Waters (Milford, MA, USA).
Chromatographic separation of TCS was addressed using the Symmetry C18 column, an isocratic mobile phase elution consisting of Acetonitrile:Water (80:20, vol:vol), at 30 °C and 0.6 mL/min flow-rate, and 10 μL injection volume. The analysis time was 5 min. TCS determination was registered at 225 nm. Identification of TCS was carried out by comparing retention times and UV spectra in the range 190-280 nm with the previously registered standard.
Method validation
The validation of the proposed method was performed using toothpaste samples and following the International Conference on Harmonization (ICH, 1996/2005) and Commission Decision 200/657/EC guidelines. The estimated parameters for the validation assessment were selectivity, linearity, accuracy, precision, limits of detection and quantification, and robustness. The data processing was accomplished using the software Statistica 8.0 (Weiß, 2007).
Selectivity was evaluated by qualitative comparison of the retention time and the UV spectrum of the peak obtained in the sample with that obtained from the standard. Linearity was studied using linear regression analysis of a five-point calibration curve, and the linear range and percentage of linearity were calculated. Accuracy was assessed by analyzing three different samples at three different concentrations of TCS and expressed as method recoveries of the analyte. The precision (repeatability and reproducibility) of the method was expressed as the percentage relative standard deviation (RSD) of replicate measurements. For repeatability, three different concentrations were analyzed on the same day and for reproducibility, three different concentrations were analyzed on three consecutive days. Sensitivity was estimated using the limit of detection (LOD) and limit of quantification (LOQ) which were determined by a series of dilutions of a solution that contained TCS until their signal was confused with the baseline noise. To obtain these values, the standard deviation of the slope (σ) is divided by the slope (m) of the calibration curve and multiplied by 3.3 (LOD = 3.3σ/m) or 10 (LOQ = 10σ/m).
Robustness
Robustness was analyzed using the Youden-Steiner test where seven parameters were selected based on the probable variability in the analytical method. In this test, eight chromatographic analyses are carried out to evaluate the effect of those parameters. In this study, the selected parameters were: operator, sample weight, extraction temperature, filter type, stirring, pipette type, and extraction volume. The nominal value for each parameter is indicated by capital letters (A-G) and its alternative value is indicated by lowercase letters (a-g). The effect of a variable was calculated by the difference between the mean result obtained with the variable at the nominal value from the mean result reached with it at the alternative value by the equation: Di = Σ upper case - Σ lower case. If a variable has an effect on the results, then the difference of it will be significantly larger than the differences of the other variables. The standard deviation of the differences (SDi) was obtained by . If SDi is lower than the standard deviation of the method (RSD of reproducibility), all parameters together do not affect the results and can be concluded that the method is robust.
Method feasibility
Method applicability was tested on several personal care products: three talcums (Racel™ and Sanofi™) with TCS, one cream with TCS (Sanofi™), and another cream without TCS (Sanofi™). As a control, 100 mg/kg TCS was employed. The sample preparation and chromatographic conditions mentioned above were used. Retention time and UV spectrum were compared with those of the control.
Results and discussion
HPLC-DAD method optimization
To obtain the shortest analysis time and best peak resolution, the separation was optimized. The semi-symmetric and phenolic nature of the TCS structure (Figure 1), were important factors observed which led to the use of columns with such characteristics. Different research groups have developed validation methods for determining and quantifying TCS on dental care products employing C18 RP columns (Piccoli et al., 2002; Mahitha et al., 2014; Aminu et al., 2018).
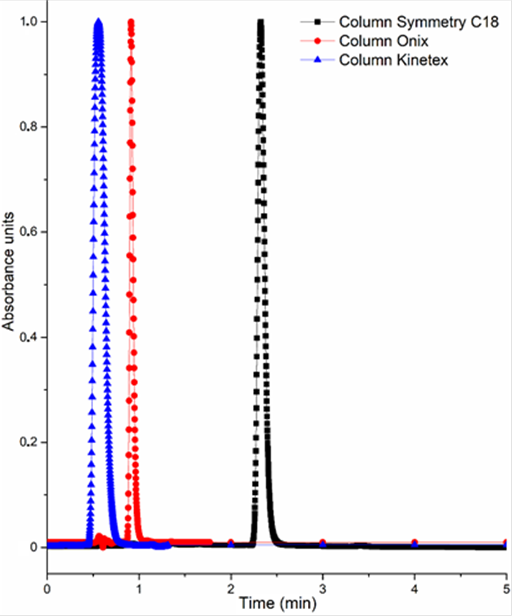
For this reason, two chromatographic particulate columns Symmetry C18 and Kinetex C18, and one monolithic column Onyx C18, were used. Under the same chromatographic conditions: mobile phase of AcN:Water 80:20 (vol:vol) at 30 °C and a flow rate of 0.6 mL/min, TCS peak eluted during the first minute of the chromatogram, interfering with the solvent front when using Kinetex C18 and monolithic Onyx columns (Figure 2). So, they were discarded for subsequent analysis. Thus, the optimum separation for TCS was achieved in a total run time of 2.5 min using the Symmetry C18 column (Figure 2). In agreement with the TCS UV spectrum, the detection wavelength was established at 225 nm (maximum absorption of the compound) and the resulting retention time was 2.3 min.
Optimization of sample preparation
Before TCS analysis, the sample preparation was optimized. For sample preparation optimization a design of experiment (DoE) set using the software Statistica 8.0 (StatSoft Inc. Tulsa, OK; USA) was used. For this purpose, a Box-Behnken fractional factorial design was chosen. It has been demonstrated that this DoE is a useful approach widely applied in analytical methods for the optimization of chromatographic conditions (Ahmad et al., 2016; Abril et al., 2018; Czyrski & Sznura, 2019; Mutalik et al., 2021; Alam et al., 2022), due to this design reduces substantially the number of experiments needed for the optimization and thus saving time, and also considers the interactions among different factors. The practical uses of Box-Behnken Design for the estimation of drugs such as pravastatin in bulk and pharmaceutical dosage form (Ahmad et al., 2016), determination of emergent pollutants (including TCS) in environmental samples (Abril et al., 2018), quantification of antivirals in loaded nano-liposomes (Mutalik et al., 2021), and estimation of emerging natural drugs such as thymoquinone from Nigella sativa seeds (Alam et al., 2022) has been previously reported.
To examine the effects on TCS extraction, three variables at three levels were chosen to establish a Lk-1 DoE, where L is the tested levels and k the chosen variables. The three independent variables in this experiment were: sonication time (min), methanol extraction volume (mL), sample weight (g), and the dependent variable (TCS recovery) as the response. Table 1 shows the DoE used for sample preparation optimization: the experimental factorial design matrix with the three independent variables and their three levels; also shows the response as TCS recovery for each experiment. All experiments were carried out in triplicate at a concentration of 100 mg/kg.
Table 1 Experimental design matrix (factors and their levels) used for sample preparation optimization from toothpaste samples and TCS extraction recoveries for each run as response variable.
|
Run |
Analytical variables levels* |
TCS recovery (%) |
||
|---|---|---|---|---|
|
Time (min) |
Extraction volume (mL) |
Sample weight (g) |
||
|
1 |
5 |
2 |
0.05 |
32.9 ± 0.5 |
|
2 |
5 |
3 |
0.20 |
39.1 ± 5.1 |
|
3 |
5 |
4 |
0.10 |
25.8 ± 5.5 |
|
4 |
10 |
2 |
0.20 |
99.9 ± 1.7 |
|
5 |
10 |
3 |
0.10 |
43.2 ± 3.2 |
|
6 |
10 |
4 |
0.05 |
14.9 ± 2.8 |
|
7 |
15 |
2 |
0.10 |
60.7 ± 2.3 |
|
8 |
15 |
3 |
0.05 |
22.6 ± 2.6 |
|
9 |
15 |
4 |
0.20 |
55.0 ± 1.6 |
* Three levels for each variable (low, medium and high).
Using the results of fractional factorial design, a Response Surface Methodology (RSM) was used to visualize the 3D response surface and 2D contour plots. In this sense, the optimum values for each variable were obtained by calculating a desirability value using the overall desirability function. Desirability value (d) ranges between 0 and 1; representing an undesirable and desirable value, respectively. The desirability function is adjusted as a quadratic function as follows: D = a1 + a2x + a3y + a4xx + a5xy + a6yy.
In Figure 3 A-C the response surface for desirability for TCS extraction in function of two factors is shown. Figure 3 A corresponds to the response surface for desirability in function of Time vs Volume with a function D = 1.64+0.26x-1.12y-0.01xx+3.4286x10⁻⁹xy+0.16yy. Figure 3 B corresponds to the response surface for desirability in function of Time vs Sample D = -0.74+0.18x+5.41y-0.013xx+0.082xy-11.44yy. Figure 3 C corresponds to response surface for desirability in function of Sample vs Volume D = 1.78-1.12x+6.77y+0.16xx-1.81x10⁻⁷xy-14.18yy.
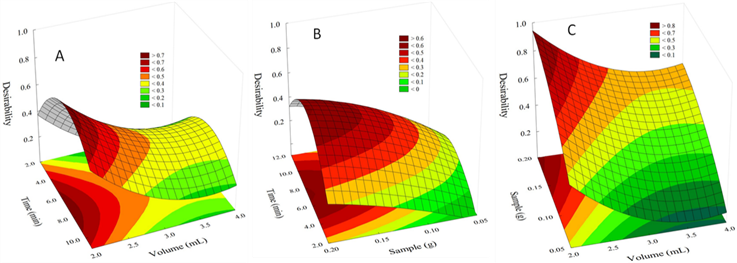
As can be seen in Figures 3 A and B, for the “time” factor, the best result is obtained when 7 min is employed. For the “Volume” factor, the best result is achieved using 2 mL of methanol (Fig. 3 A and C). For the factor “Sample” the best results are obtained using a 0.2g sample size (Fig. 3 B and C).
Method validation
Method validation was performed through the estimation of selectivity, linearity, accuracy, precision, robustness, and sensibility. For the validation, a toothpaste sample without TCS (Racel™) was used. The results of the validation parameters are shown in Table 2.
Selectivity
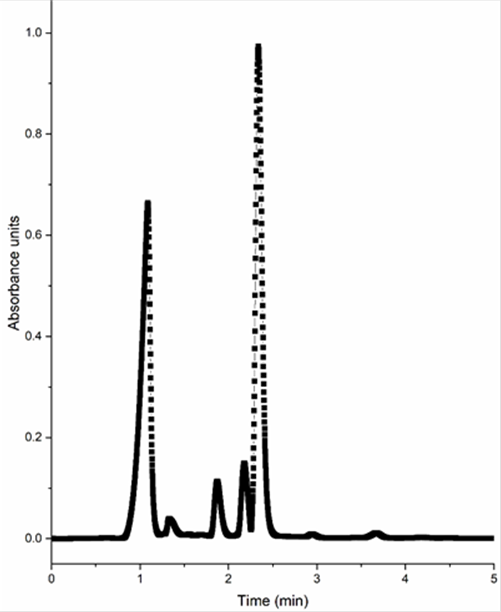
Method selectivity was evaluated by a qualitative comparison of standard solution at 100 mg/L (Figure 2) and toothpaste sample (Figure 4) chromatograms, as described earlier. It can be noted that other peaks are presented in the sample, however, they do not interfere with the analysis and quantitation of TCS. In a study published by Piccoli et al. (2002) determined the presence of sodium saccharin in a toothpaste sample that contained TCS, while Baranowska et al. (2014) detected the presence of methylparaben, benzyl alcohol, and sodium benzoate in toothpaste samples using Fast Liquid Chromatography. However, those constituents did not influence the TCS signal, so they were not considered as interference.
Linearity
Linearity was determined through a matrix-matched calibration curve at five different concentrations by triplicate. Samples of toothpaste (0.2 g) without TCS were spiked with 2 mL of TCS working standard solution at 20, 50, 100, 200, and 400 mg/L, thus the TCS concentration in terms of toothpaste was equivalent to 200, 500, 1000, 2000, and 4000 mg/kg. The matrix-matched calibration curve was constructed by plotting peak areas (y-axis) versus its concentration (x-axis) of TCS. The linear equation y = mx + b was calculated, the slope (m), intercept (b), and linear regression coefficient (r) were calculated. An r value higher than 0.99 was obtained. Also, the linearity percentage (L%) was calculated using the equation: L (%) = 100*(1-(Sm/m)) where Sm is the standard deviation of the slope and m is the slope of the matrix-matched calibration curve. The L (%) value obtained was 96.4. Considering these results the developed method for TCS determination can be considered linear (ICH, 1996/2005). The results of these parameters are shown in Table 2. The linear range of this method (20-400 mg/L) is wider compared to other reported methods (Piccoli et al., 2002; Liu & Wu, 2012; Mahitha et al., 2014), allowing TCS quantification at higher levels.
Accuracy
The accuracy of the method was calculated as the recovery of TCS at three different concentrations: low (200 mg/kg), medium (1000 mg/kg), and high (4000 mg/kg) concentration (each sample was analyzed in triplicate). An adequate amount of sample was weighed and spiked with a known amount of standard, treated, and analyzed as mentioned above. The recovery percentages were calculated with the equation (%R= concentration found/concentration spiked ×100). The overall recoveries were between 100.6 and 119.5 % (Table 2), indicating that this method was accurate enough for the determination of TCS in toothpaste samples. Similar recovery percentages have been documented by other authors in toothpaste samples (Piccoli et al., 2002; Mahitha et al., 2014). The usual acceptance criteria for this parameter are in the range of 100 ± 20 %. These values are considered acceptable within limits established by the Commission Decision 2002/657/E guideline.
Precision
The precision of the method was evaluated through repeatability and reproducibility in terms of relative standard deviation (RSD) (Table 2). For repeatability, three different concentrations (200, 1000, and 4000 mg/kg) of TCS were analyzed by triplicate within the same day. The repeatability RSD values for 200, 1000, and 4000 mg/kg were 15.7, 6.1, and 3.0 %, respectively. For reproducibility, the same three concentrations of TCS were analyzed by triplicate for three different days. The RSD values for 200, 1000, and 4000 mg/kg were 9.9, 5.9, and 1.6 %, respectively. The variations expressed as RSD were lower than 20%, and considering the acceptance criteria, the method can be considered precise.
Sensitivity
The sensitivity of the method was determined with LOD and LOQ parameters employing equations previously described. 1 ppm was taken as the TCS concentration that was confused with the baseline noise, therefore this concentration was used to calculate LOD and LOQ. As shown in Table 2, LOD and LOQ values are 30 and 50 mg/kg, respectively. The found method limits are within the range usually determined in other studies (Liu & Wu, 2012). Commercial kinds of toothpaste containing TCS have a concentration of this compound between 1000-3000 mg/kg, so with the proposed method, the concentration of TCS in the toothpaste can be perfectly determined. On the other hand, the linear range for the method was 200-4000 mg/kg, which is higher than LOD and LOQ, indicating that it was well established.
Table 2 Validation parameters for the HPLC-DAD method used for the determination of TCS in toothpaste: linear range, linearity percentage, linear correlation coefficient, slope and intercept from the matrix-matched calibration curve, limits of detection and quantification, repeatability, reproducibility, accuracy, and ruggedness.
| Toothpaste sample (TCS spiked) | |||
|---|---|---|---|
| Linear range (mg/kg) | 200-4000 | ||
| Linearity (%) | 96.4 | ||
| r a | 0.9988 | ||
| m b | 47357 | ||
| b c | 1x10⁶ | ||
| Sensibility | LODd (ng/kg) | 30 | |
| LOQe (ng/kg) | 50 | ||
| Precision (RSDf, %) | Repeatability | C1 g | 15.7 |
| C2 h | 6.1 | ||
| C3 i | 3.0 | ||
| Reproducibility | C1 g | 9.9 | |
| C2 h | 5.9 | ||
| C3 i | 1.6 | ||
| Accuracy | Recovery (%) | C1 g | 119.5 |
| C2 h | 104.8 | ||
| C3 i | 100.6 | ||
| Robustness SDi | 12.2 | ||
a Correlation coefficient; b slope, c intercept, d limit of detection; e limit of quantification; f relative standard deviation; g Low concentration level of the linear range 200 mg/kg, h middle concentration level of the linear range 1000 mg/kg, i High concentration level of the linear range 4000 mg/kg. SDi (Standard deviation of the differences).
Robustness
For the Youden-Steiner test, eight experiments were conducted by spiking TCS at 1000 mg/kg and processing each sample according to the preparation method. In Table 3 the parameter variation is shown, as well as factorial combinations and results for the Youden-Steiner test. The results show the difference (Di) ranges from -9.7 to 15.1, with the higher value corresponding to the “operator” variable followed by the “stirring” variable. This means that these two variables are the ones that must be controlled throughout the process. There is just one report that analyzed different factors that influenced the determination of TCS in toothpaste samples (Mahitha et al., 2014). In their research, Mahitha et al. (2014) evaluated the effect of analyst, column temperature, flow rate, buffer pH, and wavelength on TCS quantification.
On the other hand, the standard deviation of the differences (SDi) calculated with the equation described in the methodology was 12.2. When SDi is significantly larger than the standard deviation of the method (15.7%) it means that all factors together influence the result and that the method is not sufficiently robust against the chosen modifications (Official Journal of the European Communities, 2002). Considering this information, the proposed method can be considered as robust.
Table 3 Experimental domain for the robustness Youden-Steiner approach: Factors and selected levels and estimated difference of the seven factors.
| Factor | Levels | Factorial combination | Difference (Di)* | ||||||||
|---|---|---|---|---|---|---|---|---|---|---|---|
| Used | New | S | T | U | V | W | X | Y | Z | ||
| Operator (A/a) | 1 | 2 | A | A | A | A | a | a | a | a | 15.1 |
| Sample weight (g) (B/b) | 0.2 | 0.3 | B | B | b | b | B | B | b | b | -5.4 |
| Extraction Temperature (°C) (C/c) | 25 | 30 | C | c | C | c | C | c | C | c | 5.7 |
| Filter pore-size (D/d) | 0.20 | 0.45 | D | D | d | d | d | d | D | D | 8.4 |
| Stirring (E/e) | Ultrasonic | Vortex | E | e | E | e | e | E | e | E | -9.7 |
| Pipette type (F/f) | Automatic | Manual | F | f | f | F | F | f | f | F | 5.6 |
| Extraction volume (mL) (G/g) | 2 | 2.2 | G | g | g | G | g | G | G | g | 6.2 |
* In absolute value
Method feasibility
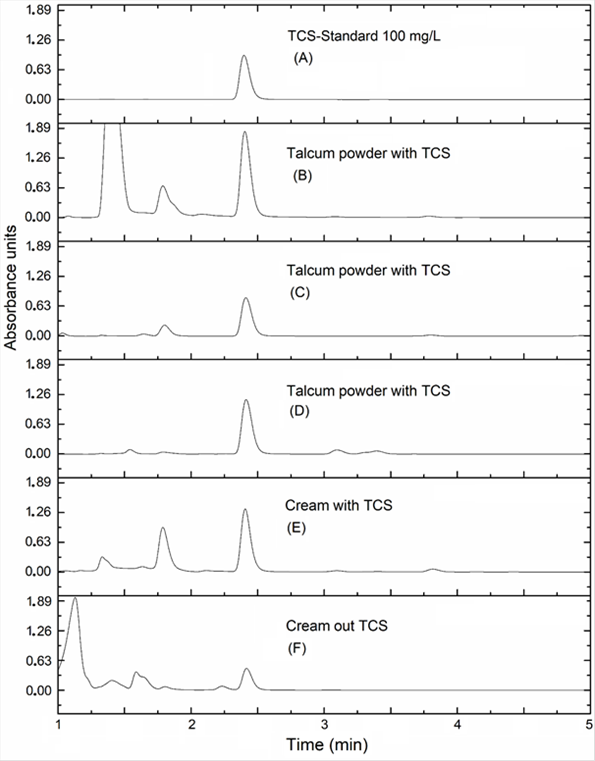
To demonstrate the method applicability, five personal care products were tested: three commercial talcs (containing TCS) and two creams: one with TCS and another marketed as TCS-free. For comparison purposes, a chromatogram of a 100 mg/L TCS standard is also shown in Figure 5 (A). The chromatograms of processed samples are shown in Figure 5 (B-F). Four samples (all talc and cream with TCS) exhibit a homogenous peak similar to TCS control, with retention times of around 2.4 minutes. On the other hand, TCS-free label cream presents one small peak with an identical retention time and UV spectrum with regard to TCS-containing products. From these results can be concluded that: 1) this method is applicable for TCS determination in personal care products and 2) some products with a TCS-free label might contain this product in minor quantities. Further studies are necessary to corroborate this affirmation. Finally, the applicability of our method to the real samples was demonstrated.
Conclusions
An economical, simple, and fast method for determining TCS in toothpaste samples using HPLC-DAD was developed. Several chromatography columns were tested, Symmetry C18 being the one that best-resolved TCS. The optimal conditions for TCS extraction from toothpaste were accomplished by a factorial experimental design and response surface methodology. The present method showed good linearity (r > 0.99), selectivity, precision (repetitively and reproducibility ranges), accuracy (recovery percentage), and sensitivity (LOD and LOQ). The robustness of the method was carried out through a Youden-Steiner test, the obtained results indicate that the method can be considered as robust. Finally, the method was successfully applied to other products of personal use, such as creams and talc.

