


Serviços Personalizados
Journal
Artigo
 texto em
  Inglês (pdf)
 Artigo em XML
 Referências do artigo
 Enviar este artigo por email
Indicadores
-
 Citado por SciELO
 -
 Acessos
Links relacionados
-
 Similares em
SciELO
Similares em
SciELO
Compartilhar

 Permalink
Revista bio ciencias
versão On-line ISSN 2007-3380
Revista bio ciencias vol.8 Tepic 2021 Epub 04-Out-2021
https://doi.org/10.15741/revbio.08.e1007
Original articles
Influence of climate change on thermal requirements of cactus pear (Opuntia spp.) in Central-Northern of Mexico
1 INIFAP Campo Experimental Zacatecas, Km 24.5 Carretera Zacatecas-Fresnillo, Calera, Zac., México.
2 Centro Universitario de Ciencias Biológicas y Agropecuarias-Universidad de Guadalajara. Camino Ing. Ramón Padilla Sánchez núm. 2100, Predio Las Agujas, Nextipac, Zapopan, Jalisco, México.
3 INIFAP Campo Experimental Pabellón, Carretera Aguascalientes-Zacatecas km 32.5, Pabellón de Arteaga, Ags., México.
In Mexico, cactus pear (Opuntia spp.) crop has a strong cultural tradition. This country is considered the origin center and domestication of the genus Opuntia. In the north-central of the country, on average, more than 45, 000 ha are annually harvested. Although cactus pear is a tolerant species to adverse environmental conditions, its productivity can be negatively affected by biotic and abiotic factors during its development. The objective of this work was to know the effect of climate change on the thermal range of cactus pear grown in Central-North Mexico. A historical analysis was done on the number of hour variation with temperature inside and outside of the cactus pear thermal range. A similar analysis was done for the 2030, 2050, and 2070 climate scenarios on Representative Concentration Routes (RCP, for its acronym in English) 4.5 and 8.5. Climate change will have little effect on the number of hours with average annual temperature in the optimal range for cactus pear development (14 to 19 ° C) and on the number of hours with an average temperature in January for the optimal range (10 a 14 °C). In the first case, the cultivated area with that temperature (14 a 19 °C) would decrease only by 4 % and 15.4 % for 2070 under RCP 4.5 and 8.5 scenarios, respectively. In the second one, the cultivated area with that optimum temperature (10 a 14 °C) would increase by 9.9 % and 13.2 % for 2070 under RCP 4.5 and 8.5 scenarios, respectively.
Keywords: Opuntia spp.; global warming; RCP; hourly temperature
En México, el cultivo del nopal tunero (Opuntia spp.) tiene una larga tradición cultural. Este país es considerado como el centro de origen y domesticación del género Opuntia. En el Centro Norte del país, en promedio, más de 45, 000 ha son cosechadas anualmente. Sin embargo, aunque el nopal es una especie tolerante a condiciones ambientales adversas, su productividad puede ser afectada negativamente por factores bióticos y abióticos durante su desarrollo. El objetivo de este trabajo fue conocer el efecto del cambio climático sobre el rango térmico del nopal tunero cultivado en el Centro-Norte de México. Se hizo un análisis histórico sobre la variación del número de horas con temperatura dentro y fuera del rango térmico para el nopal. También se hizo un análisis similar para los escenarios climáticos 2030, 2050 y 2070 en las rutas de concentración representativas (RCP, por sus siglas en inglés) 4.5 y 8.5. El cambio climático tendrá poco efecto en el número de horas con temperatura media anual en el rango óptimo para el desarrollo de nopal tunero (14 a 19 °C) y en el número de horas con temperatura media en el mes de enero para el rango óptimo (10 a 14 °C). En el primer caso, la superficie cultivada con esa temperatura óptima sólo disminuiría 4 % y 15.4 % para el año 2070 bajo los escenarios RCP 4.5 y RCP 8.5, respectivamente. En el segundo caso, la superficie de los municipios con esa temperatura óptima aumentaría 9.9 % y 13.2 % para el año 2070 bajo los escenarios RCP 4.5 y RCP 8.5, respectivamente.
Palabras clave: Opuntia spp.; calentamiento global; RCP; temperatura horaria
Introduction
Cactus pear (Opuntia spp.) is a xerophyte plant cultivated in marginal arid and semi-arid regions of Mexico and similar agro-ecosystems around the world. This plant has several uses such as a vegetable and fruit for human consumption, cattle feed in drought times, industrial uses, as well as to minimize soil erosion (Varela-Gámez et al., 2014, Inglese et al., 2017).
Mexico is the main producer of fruit, harvesting approximately 43 % of the annual world production estimated at 1,060,000 t in an area of 100,000 ha (Potgieter & D’Aquino, 2017). Planted surface in Mexico with cactus pear in 2019 was 45, 746 ha under rainfed agriculture, mainly in the states of Mexico 35.4 %, Zacatecas 24.7 %, Puebla 12. 2%, Hidalgo 9.6 %, San Luis Potosí 6.4 %, Jalisco 4.5 %, Guanajuato 3.9 %, Tamaulipas 1.4 %, and Querétaro 1.2 % (SIAP, 2020). These states are located in the north-central region of the country, known as the Mexican Altiplano.
Opuntia species have developed anatomical, morphological and physiological adaptations to survive and grow in arid environments with severe water stress that limits the survival of other plant species (Prat & Franck, 2017). Cactus pear is a plant with crassulacean acid metabolism (CAM), which is characterized by nocturnal carbon fixation and water use when the temperature is lower and relative humidity is generally higher than during the day (Cushman & Bohert, 1999; Nobel & Bobich, 2002). Thus, during the daytime, water use via transpiration in CAM plants is three to five times lower than C4 and C3 plants, respectively (Nobel, 1988).
In concordance with several authors, Ruiz et al. (2013) point out that Opuntia genus is found from sea level to an altitude of 4,700 m, although the optimal altitude is 1,700 to 2,300 masl. The thermal range for this species is 6 to 36 °C, with an optimum between 15 and 19 °C. Opuntia can endure temperatures of up to 65 °C for one hour. Meanwhile, this species dies with temperatures of -5 to -8 °C. Besides, it requires rainfall between 200 to 750 mm per year, although the optimum is 350 to 700 mm. In fact, in the native area of cactus pear in the central highlands of Mexico (altitude between 1,800 and 2,200 masl), rainfall is less than 500 mm, the average annual temperature varies between 16 and 18 °C, and the maximum daytime temperature in the hottest month does not exceed 35 °C (Pimienta-Barrios, 1990).
Although physiological and morphological adaptations together make cactus pear successful in dry environments, and it could face climate change, it is imperative to study the effect that global warming could or could not have on the cactus pear crops (Kumar et al., 2018).
However, although cactus pear is a species that has a broad range of adaptation (Ruiz et al., 2013), its productivity can be variable due to both biotic and abiotic factors that occur during crop development. Extreme temperatures and water availability are two of the abiotic stress factors that limit crop growth and development (Medina-García et al., 2016).
Mexican agricultural areas temperature has significantly increased since the 1990s (Ruiz et al., 2011; Medina-García et al., 2016). This temperature increase brings with it modifications in agro-climatic variables such as the accumulation of heat and cold winter units that limit the productivity of mainly deciduous fruit trees (Medina-García et al., 2019a).
With climate change, it is expected that by 2050 the average temperature of the earth will have increased by 2 to 5°C or more, according to the Intergovernmental Panel on Climate Change (IPCC, 2014). Currently, climate change is one of the main circumstances facing agriculture, due to the changes it causes in weather patterns and therefore in the agro-climatology related to the management of agricultural activities. Therefore, it is important to know the climatic conditions of the cactus pear development and its possible influence on its production potential.
This work aims to know the effect of climate change on the thermal range of the cactus pear cultivated in the northcentral region of Mexico.
Material and Methods
The study area included the main cactus pearproducing states in north-central Mexico: Zacatecas, San Luis Potosí, Aguascalientes, State of Mexico, Puebla, Hidalgo, Guanajuato and Jalisco (Figure 1). Daily maximum and minimum temperature data of the National Meteorological Service climate stations were used. A total of 244 stations with more than 30 years and more than 90 % of data were selected.

With the daily maximum and minimum temperature data, hourly data (Snyder, 1985) was generated from the entire historical data series of the stations. To validate the data estimation, daily maximum and minimum temperature data from an automatic weather station were used and compared with their real hourly data. With the estimated data, the number of hours in which the temperature was inside and outside of the optimal ranges of cardinal temperatures for cactus pear (Table 1) during the annual crop cycle and in January was counted (MedinaGarcía et al., 2019b). The average number of hours in each range per month was obtained for each year (1981-2010). With these data, trend analysis was done, using the non-parametric Mann-Kendall test (Mann, 1945; Kendall, 1975), since it is considered the most appropriate for trend analysis in climatological time series (Miró et al., 2009; Ahmed et al., 2014; Melo et al., 2015) and was complemented with the Sen’s slope estimator test (Sen, 1968). For this, the Makesens macro code, developed at the Finnish Meteorological Institute, was used (Salmi et al., 2002).
Table 1 Threshold and optimum values of cardinal temperatures for cactus pears cultivated in the study region.
| Temperature °C | Marginal | Sub optimal | Optimal | Sub optimal | Marginal |
|---|---|---|---|---|---|
| Annual mean | < 13 | 13 - 14 | 14 - 19 | 19 - 21 | > 21 |
| January mean | < 10 | 10 - 14 | > 14 |
To generate maps with the number of hours of temperature of each range, regression models were estimated for the crop cycle. For that purpose, 61 stations were selected at national level covering different environments. There were obtained the hourly temperatures per day of each one of the 61 stations, it was obtained the number of hours of temperature for each range and they were related to the average maximum and minimum temperature in the same crop period. This way, it was obtained a model for each range for the annual crop cycle and for the month of January.
To estimate the effect of climate change on the number of hours in and out of the cardinal temperatures, the climate change information system of the National Research Institute in Forestry, Agriculture and Livestock (INIFAP)-Mexico was used (Ruiz-Corral et al., 2016), which consists of base climatology of the period 19612010 and climatology of the years 2041 to 2080 in the Representative Concentration Pathway (RCP) 4.5 and 8.5 of greenhouse gases (GHG). These were obtained from information from the WorldClim’s Global Change data portal with which an assembly model was generated comprising by 11 scaled-down and calibrated general circulation models (GCMs) (Walton et al., 2013) and selected for Mexico (BCC‐CSM1‐1, CCSM4, GISSE2‐R, HadGEM2‐AO, HadGEM2‐ES, IPSLCM5A‐LR, MIROC‐ESM‐CHEM, MIROC‐ESM, MIROC5, MRICGCM3, NorESM1‐M).
An intermediate emissions RCP was used (4.5) which is considered reliable with a future with relatively ambitious emissions reductions and a high emissions RCP (8.5) which is consistent with a future without policy changes to reduce emissions (Van Vuuren et al., 2011). These scenarios were used to make the projections. Maximum and minimum temperature values from the years 2041 to 2080 were used. The monthly data were used to obtain the annual data for the climate scenarios 2021-2040, 2041-2060 and 2061-2080, hereinafter referred to as climatologies or years 2030, 2050 and 2070 respectively.
Results and Discussion
Retrospective analysis
In the estimated hourly data validation of an automatic weather station and their respective real hourly data, they were adjusted to linear regression (R2 = 90 %, intercept equal to zero and slope value equal to one) (Figure 2) (Fritz et al., 1997).
With the hourly data, it was estimated the number of hours in which the temperature was found inside and outside the optimal ranges of cardinal temperatures for the development of cactus pear in the annual crop cycle. The historical trend analysis for the years 1981 to 2010 (considering the 244 stations) is presented in Table 2.
Table 2 Mann-Kendall test and Sen’s slope estimator-trend for cardinal temperatures of cactus pear.
| Temperature °C | Mann-Kendall trend | Sen estimated slope | ||
|---|---|---|---|---|
| Z statistic | Significance | Slope | Constant | |
| 14 - 19 annual | -0.18 | ns | -0.403 | 2092.469 |
| < 13 annual | -0.68 | ns | -2.460 | 2769.773 |
| > 21 annual | 2.43 | * | 10.589 | 2555.500 |
| 10 - 14 January | -1.25 | ns | -0.323 | 167.492 |
| < 10 January | -0.50 | ns | -0.439 | 299.660 |
| > 14 January | 0.64 | ns | 0.655 | 315.058 |
Significance level: non-significant (ns), significant at p ≤ 0.1 (*).
The number of hours within the optimal temperature range for the development of cactus pear (14-19 °C), did not show a significantly defined trend, that is, the number of hours with appropriate temperature for this crop remained without statistically significant changes in the study period. The lower marginal temperature (< 13 °C), presented a tendency to decrease, but not significantly; while the upper marginal temperature (> 21 °C) presented a tendency to increase significantly (Table 2). This suggested that only the upper marginal temperature could negatively affect the development of this crop when it exceeds 23 °C (Inglese et al., 2017).
Concerning the average temperature in January, which is important for cactus pear, since in regions with severe frost, it negatively affects this crop (Nobel, 1996; Nobel & Bobich, 2002), the analysis revealed that the number of hours in the optimal temperature range for the month of January (10-14 °C), those below (< 10 °C) and above (> 14 °C) to the optimal range in the month of January, independently of the value of the slope, resulted without significant tendency in the period from 1981 to 2010 (Table 2). These results indicated that the number of hours with average temperatures and temperatures below or above the optimal range in January appropriate for cactus pear, until now, have not been affected by climate change in the region producing cactus pear for the study period. This last analysis could be encouraging for cactus pear, however, the risk of a drop in temperature ≤ -5 °C is latent during the winter season, which, if it occurs, would minimally affect the yield and cosmetic quality of the fruit (Granata et al., 2017).
Prospective analysis
For the analysis of future climate scenarios, the number of hours of each temperature range for the annual crop cycle and the month of January were related to their respective average maximum and minimum temperatures, this for 61 stations distributed nationwide. The generated models were significant (p ≤ 0.0001) with values of determination coefficients (R2) between 86.4 and 99.4 % (Table 3).
Table 3 Determination coefficients (R2) and regression models to estimate the number of hours in each temperature range from average maximum and minimum temperature in the annual crop cycle and in the month of January.
| Range °C | R2 | Max | Max2 | Min | Min2 | Constant |
|---|---|---|---|---|---|---|
| Annual mean temperature | ||||||
| 14 a 19 | 0.894 | -2.038 | 281.710 | -11.649 | 1919.211 | |
| < 13 | 0.968 | -745.525 | 12.144 | -317.890 | 4.208 | 16161.000 |
| > 21 | 0.994 | 845.183 | -10.908 | -106.888 | 12.926 | -11774.000 |
| January mean temperature | ||||||
| 10 a 14 | 0.864 | -28.017 | 0.452 | 20.027 | -1.175 | 472.468 |
| > 14 | 0.979 | 68.429 | -1.134 | 12.182 | 0.533 | -680.157 |
| < 10 | 0.969 | -39.779 | 0.663 | -32.877 | 0.691 | 941.854 |
Max and Max2 are, respectively, the linear and quadratic effect of the maximum temperature. Min and Min2 are, respectively, the linear and quadratic effect of the minimum temperature.
With the models outlined above, maps were generated of the number of hours of each of the ranges or threshold temperatures for the development of cactus pear (Table 1) in the current climate scenario (1981-2010) and for 2030, 2050 and 2070 climatologies, for RCP 4.5 and 8.5. As an example, the maps of temperature ranges 14 to 19 °C in the annual crop cycle and 10 to 14 °C average temperatures in the month of January are presented (Figures 3 and 4).
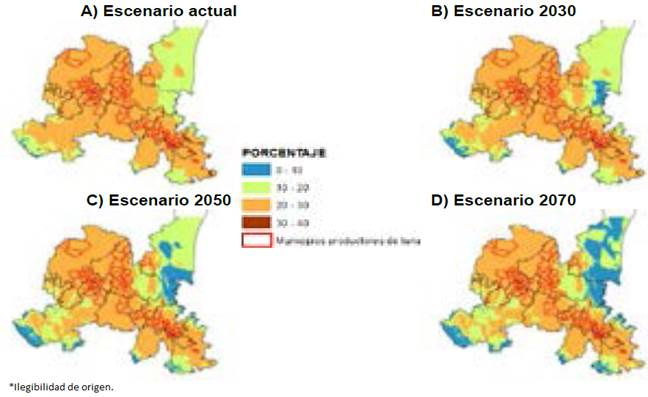
Figure 3 Percentage of the number of hours with temperature from 14 to 19 °C (optimum temperature for the development of cactus pear) in the annual cultivation cycle, in the current scenario (A) and three future climate scenarios of RCP 4.5 (B, C and D) for the cactus pear producing region in Mexico.

Optimal average annual temperature (14 to 19 °C)
Figure 3 shows the maps with the percentage of the number of hours with temperature in the optimal range for cactus pear development (14 to 19 °C) in the annual crop cycle in the north-central region. In reference to Figure 3A, it was observed that 100 % of the area planted with cactus pear in the producing municipalities (current scenario), is in the range of 20 to 30 % of the total number of hours in the year (Table 4). By the year 2030, a slight decrease in the cultivated area with percentage of hours from 20 to 30 % (orange color) would be expected, going from 100 to 99.6 % (Figure 3B and Table 4), which means that it would be practically the same area with temperature within the optimal range for cactus pear development. In the climate scenarios 2050 and 2070, it would also slightly decrease the surface area in the range 20-30 % of hours between 14 and 19 °C, but only 2.9 and 4.0 % in the 2050 and 2070 scenarios of RCP 4.5, respectively (Table 4). This indicates that the number of hours with optimal temperature for the development of this crop would only be slightly affected by the effect of climate change and would remain at least until 2070 in 96 % of the surface area of the producing municipalities. Considering RCP 8.5, the surface area in the range 20-30 % of hours with optimal temperature for cactus pear would have a decrease of up to 15.6 % in the 2070 scenario. Considering the pressure on resources (e.g., water, soil, etc.) due to population increase and climate change, food security would not be guaranteed by that time (Rosenzweig et al., 1994). However, the above scenarios, based only on temperature, offer the possibility to continue growing this species in the present and immediate future. The latter would be adverse for other crops (e.g., wheat, maize and barley) (Lobell & Field, 2007).
Table 4 Surface percentage of the cactus pear fruit-producing municipalities in the north-central region in two ranges of percentage of hours with average annual temperature from 14 to 19 °C (optimum temperature for the development of cactus pear) in the current climate scenario and future scenarios.
| Range of hours (%) |
Percentage of the surface of producing municipalities | ||||||
|---|---|---|---|---|---|---|---|
| Current scenario |
2030 | RCP 4.5 2050 |
2070 | 2030 | RCP 8.5 2050 |
2070 | |
| 10 -20 | 0.0 | 0.4 | 2.9 | 4.0 | 0.6 | 4.3 | 15.4 |
| 20 - 30 | 100.0 | 99.6 | 97.1 | 96.0 | 99.4 | 95.7 | 84.6 |
Lower marginal average annual temperature (< 13 °C)
Table 5 shows four ranges with the percentage of the number of hours with lower marginal temperature for the development of cactus pear (< 13 °C) in the annual crop cycle in the north-central region of Mexico. In the current scenario, 89.7 % of the surface in the municipalities that produce cactus pears has between 2030 and 30-40 % of the total number of hours in the year < 13 °C. By the year 2030 with an RCP 4.5, the surface with percentage of 20 to 30 % would have an increase from 31.5 to 67.6 %, this surface would continue to increase in the climate scenarios 2050 and 2070. In contrast, the surface between 30 and 40 % of hours with temperature < 13 °C would decrease from 58.2 to 6.1 % in 2070 with an RCP 4.5. The latter scenario would be more negative by 2070 with an RCP 8.5; that is, there would be fewer hours with temperature below 13 °C (Table 5).
Table 5 Surface percentage of the cactus pear fruit-producing municipalities in the north-central region in four ranges of percentage of hours with annual average temperature lower than 13 °C (marginal temperature for the development of cactus pear) in the current climate scenario and future scenarios.
| Range of hours (%) |
Percentage of the Surface of producing municipalities | ||||||
| Current scenario |
RCP 4.5 | RCP 8.5 | |||||
| 2030 | 2050 | 2070 | 2030 | 2050 | 2070 | ||
| 0 - 20 | 3.1 | 6.3 | 12.9 | 19.6 | 7.3 | 23.4 | 68.1 |
| 20 - 30 | 31.5 | 67.6 | 78.0 | 73.9 | 72.9 | 70.8 | 29.9 |
| 30 - 40 | 58.2 | 23.1 | 8.2 | 6.1 | 17.6 | 5.5 | 2.0 |
| 40 - 60 | 7.3 | 3.0 | 0.8 | 0.4 | 2.3 | 0.3 | 0.0 |
The decrease in the number of hours in the range of 30 to 40 % with mean annual temperature < 13 °C, could be beneficial for the cultivation of cactus pear, since daily temperatures < 15 °C delay fruit grown and maturation, but adversely, this would cause fruit with a higher proportion of peel than pulp, lower content of soluble solids and deficient pigmentation of the peel (Inglese et al., 1995; Liguori et al., 2006) cited by Inglese et al. (2017).
Average annual marginal higher temperature (> 21 °C)
88.3 % of the municipalities surface that produce cactus pear (current scenario) is in the ranges of 20-30 and 30-40 % of the total number of hours with higher marginal temperature (> 21 °C) for the annual development of cactus pear in the north-central region (Table 6). The 2030 year with an RCP 4.5 projection would consider a decrease of the surface with a percentage of 20-30 % going from 38.5 to 14.2 %, this tendency would be maintained in the climate scenarios 2050 and 2070. Similarly, the surface area in the range of 30 to 40 % of hours above 21 °C would decrease from 49.8 to 27.1 % in 2070 with an RCP 4.5; while the range of 40 to 50 % would increase, it means, there would be more hours with an annual average temperature above 21 °C. A similar prognosis would occur with an RCP 8.5, that is, the surface of the 40 to 50 % range of hours with marginal higher temperature for cactus pear would increase to 59.7 % in the 2070 scenario. The above indicates that the superior marginal temperature for the development of this crop would be presented in greater proportion by the effect of climate change, which would be negative for the cultivation of cactus pear, since, although it is a species that can support high temperatures, when these are > 25 °C they reduce the net CO2 assimilation in approximately 28 % (Nobel & Hartsock, 1984). When temperatures above 30 °C occur during the initial phase of fruit growth, the third phase of growth can be shortened, when the greatest cell elongation occurs in the edible portion, leading to early ripening and reduction in fruit size, firmness and sugar content (Inglese et al., 2009). Besides, high temperatures during fruit growth reduce postharvest storage and shelf-life of cactus pear fruits, as this fruit is often more sensitive to low temperatures (< 8 °C) during storage (Inglese et al., 2002). Therefore, instead of the increase in atmospheric CO2 (Nobel, 1991), the increase in the upper marginal temperature estimated in this work would suggest, in the future, a greater limitation for the cultivation of this species (Nobel & Hartsock, 1984).
Table 6 Surface percentage of cactus pear fruit-producing municipalities in the north-central region in five ranges of percentage of hours with an average annual temperature higher than 21 °C (higher marginal temperature for the development of cactus pear) in the current climate scenario and in future scenarios.
| Range of hours (%) |
Percentage of the Surface of producing municipalities | ||||||
|---|---|---|---|---|---|---|---|
| Current scenario |
RCP 4.5 | RCP 8.5 | |||||
| 2030 | 2050 | 2070 | 2030 | 2050 | 2070 | ||
| 0 - 20 | 5.9 | 2.0 | 0.6 | 0.3 | 1.6 | 0.2 | 0.0 |
| 20 - 30 | 38.5 | 14.2 | 5.4 | 3.9 | 11.0 | 3.6 | 1.1 |
| 30 - 40 | 49.8 | 68.1 | 42.2 | 27.1 | 65.0 | 23.9 | 7.4 |
| 40 - 50 | 5.4 | 13.2 | 46.0 | 61.5 | 19.0 | 64.3 | 59.7 |
| 50 - 70 | 0.4 | 2.5 | 5.7 | 7.2 | 3.4 | 8.0 | 31.8 |
Optimum average temperature for the month of January (10 to 14 °C)
Figure 4 shows the maps with the percentage of the number of hours with an average temperature of January optimal for the development of cactus pear (10 to 14 °C) in the northcentral region. In the current scenario (Figure 4A), it was observed that 82.8 % of the surface area of the producing municipalities, accumulated between 20 and 30 % of the total number of hours in January (Table 7). By 2030, a slight increase in the area with a percentage of hours of 20 to 30 % (green color) would be expected, going from 82.8 to 85.9 % (Figure 4B and Table 7). The latter means that it would be practically the same surface with temperature within the optimal range in the month of January for the development of cactus pear. In the climate scenarios 2050 and 2070, the surface would continue to increase slightly in the range of 20-30 % of hours between 10 and 14 °C in January until reaching 89.1 and 92.7 % in RCP 4.5. This indicates that the optimal temperature in January for the development of this crop would be positive and slightly modified as a result of climate change at least until 2070. Considering the RCP 8.5, the surface with a percentage of 20 to 30 % of hours with optimal temperature in January for the development of this crop would have a similar behavior until reaching 96.0 % of the surface by 2070. This last result, suggests to support the theory that global warming would favor the expansion of the surface cultivated with O. ficus-indica (Nobel & Bobich, 2002; García-Moya et al., 2012; Lobell & Gourdji, 2012) because this species is more susceptible to low than high temperatures (Nobel, 1996; Nobel & Bobich, 2002); but in addition, anatomically and physiologically it would adapt better to scenarios with high concentrations of atmospheric CO2 (Nobel, 1991) where other plant species of agronomic interest would not prosper (Lobell and Field, 2007). However, research on the reproductive biology and physiology of this species should be considered (Nobel, 2002; Pimienta-Barrios & del Castillo, 2002) under possible climate change scenarios (Inglese et al., 2017).
Tabla 7 Surface percentage of the cactus pear fruit-producing municipalities in the north-central region in two ranges of percentage of hours with an average temperature of 10 to 14 °C in January (optimal temperature for the development of cactus pear) in the current climate scenario and in future scenarios.
| Range of hours (%) |
Percentage of the Surface of producing municipalities | ||||||
|---|---|---|---|---|---|---|---|
| Current scenario |
RCP 4.5 | RCP 8.5 | |||||
| 2030 | 2050 | 2070 | 2030 | 2050 | 2070 | ||
| 10 - 20 | 17.2 | 14.1 | 10.9 | 7.3 | 10.9 | 6.7 | 4.0 |
| 20 - 30 | 82.8 | 85.9 | 89.1 | 92.7 | 89.1 | 93.3 | 96.0 |
Average temperature of the month of January sub-optimal lower (< 10 °C)
Table 8 shows five ranges with the percentage of the number of hours with an average temperature of January sub-optimum lower for the development of cactus pear (< 10 °C) in the north-central region. In the current scenario, 85.0 % of the surface of the producing municipalities has between 30 and 50 % of the total number of hours in the month of January. With reference to this last scenario, the forecast for the years 2030, 2050 and 2070 with an RCP 4.5 would indicate an increase of this area in 17.3, 30.5 and 32.9 %, respectively. In contrast, the area in the range 40 - 50 % would decrease by 15.0, 33.8 and 43.6 % for 2030, 2050 and 2070 years, respectively. Thus, the decrease of the surface in the range 40-50 % would contribute with more surface to the range 30-40 %. The above indicates that the lower sub-optimal temperature of January for the development of this crop would be positively influenced by the effect of climate change and would be maintained at least until 2070. Considering the RCP 8.5, the surface with a percentage of 40 to 50 % of hours with sub-optimal temperature in January for cactus pear would have the same behavior, but a greater decrease in this surface in the 2070 scenario. In other words, the lower sub-optimal temperature in January would decrease, which could promote the development of cactus pear by decreasing the risk of frost (Nobel, 1996). However, the moderate lack of winter cold could reduce the number of reproductive buds, which would result in loss of productivity (Nerd & Mizrahi, 1995). Temperature increases in producing regions of the world are a constant concern (Inglese et al., 2017).
Table 8 Percentage of the surface of the cactus pear fruit-producing municipalities in the north-central region in five ranges of percentage of hours with an average temperature lower than 10 °C in the month of January (lower suboptimal temperature for the development of cactus pear) in the current climate scenario and in future scenarios.
| Range of hours (%) |
Percentage of the Surface of producing municipalities | ||||||
|---|---|---|---|---|---|---|---|
| Current scenario |
RCP 4.5 | RCP 8.5 | |||||
| 2030 | 2050 | 2070 | 2030 | 2050 | 2070 | ||
| 0 - 20 | 0.0 | 1.4 | 2.5 | 3.1 | 2.4 | 4.7 | 8.1 |
| 20 - 30 | 4.9 | 7.6 | 14.9 | 22.3 | 12.1 | 34.4 | 62.0 |
| 30 - 40 | 30.8 | 48.1 | 61.3 | 63.7 | 59.1 | 53.9 | 28.7 |
| 40 - 50 | 54.2 | 39.2 | 20.4 | 10.6 | 24.8 | 7.0 | 1.2 |
| 50 - 70 | 10.0 | 3.8 | 0.9 | 0.2 | 1.6 | 0.1 | 0.0 |
Average temperature of January sub-optimal higher (> 14 °C)
Table 9 shows five ranges of percentages of the number of hours with an average temperature of January sub-optimal superior (> 14 °C) for the development of this plant in the north-central region. In the current scenario, 84.3 % of the surface of the producing municipalities are located in the ranges 30-40 and 40-50 % with the number of hours with an average temperature of the month of January sub-optimal superior (> 14 °C). By 2030, with an RCP 4.5, the surface area will decrease from 30 to 40 %, from 25.4 to 7.7 %. This trend would continue steadily in the 2050 and 2070 climate scenarios and would be dramatic for all three RCP 8.5 scenarios (Table 9). In contrast, the surface of the 40 to 50% for hour range above 14°C would increase from 58.9 to 61.7 % in 2030, and then decrease in the 2050 and 2070 scenarios with RCP 4.5. The range 50-60 % of hours, whose current scenario had 12.3 % of the surface of the cactus pear fruit-producing municipalities, would increase to 60.9 % in 2070 with an RCP 4.5 and this behavior would be similar with an RCP 8.5. This indicates that the sub-optimal upper temperature of January for the development of this crop would be influenced by the effect of climate change and would increase in the future. In other words, an increase in the January upper sub-optimal temperature could negatively affect crop productivity due to the absence of low temperatures during the winter (Nerd & Mizrahi, 1995).
Table 9 Surface percentage of the cactus pear fruit-producing municipalities in the north-central region in five ranges of percentage of hours with an average temperature higher than 14 °C in the month of January (higher sub optimal temperature for the development of cactus pear) in the current climate scenario and future scenarios.
| Range of hours (%) |
Percentage of the Surface of producing municipalities | ||||||
|---|---|---|---|---|---|---|---|
| Current scenario |
RCP 4.5 | RCP 8.5 | |||||
| 2030 | 2050 | 2070 | 2030 | 2050 | 2070 | ||
| 10 - 30 | 1.0 | 0.2 | 0.1 | 0.0 | 0.1 | 0.0 | 0.0 |
| 30 - 40 | 25.4 | 7.7 | 1.8 | 0.7 | 3.2 | 0.3 | 0.0 |
| 40 - 50 | 58.9 | 61.7 | 43.8 | 27.5 | 51.0 | 14.2 | 2.4 |
| 50 - 60 | 12.3 | 26.5 | 46.7 | 60.9 | 39.7 | 65.3 | 50.0 |
| 60 - 80 | 2.3 | 3.9 | 7.5 | 10.8 | 6.0 | 20.2 | 47.7 |
Conclusion
In general, climate change would have little effect on the number of hours with average annual temperature in the optimal range for the development of cactus pear (14 to 19 °C) and on the number of hours with an average temperature in January in the optimal range (10 to 14 °C). In the first case, the surface of the municipalities with that optimum temperature would only decrease in 2070 by 4 % and 15.4 % with RCP 4.5 and RCP 8.5, respectively. In the second case, the surface area of the municipalities with that optimal temperature would increase by 9.9 % and 13.2 % the 2070 year with RCP 4.5 and RCP 8.5, respectively.
The lower mean annual marginal temperature for the development of cactus pear (< 13 °C) and the upper mean annual marginal temperature for the development of cactus pear (> 21 °C), would be influenced by the climate change, since, in the municipalities producing cactus pear, the number of hours of the lower marginal temperature would decrease and the number of hours of the upper marginal temperature would increase in the climatology 2070 RCP 4.5.
The average temperature of January sub-optimal inferior for the development of the cactus pear (< 10 °C) and the average temperature of January sub-optimal superior for the development of the cactus pear (> 14 °C), would be influenced by the climatic change, since, in the municipalities producers of cactus pear would diminish the number of hours of the sub-optimal inferior temperature and would increase the number of hours of the sub-optimal superior temperature in the climatology 2070 RCP 4.5.
Acknowledgments
This research was financed by the National Institute of Forestry, Agricultural and Livestock Research (INIFAP-México) through project No: 8403134459.
REFERENCES
Ahmed, S. I., Rudra, R., Dickinson, T. & Ahmed, M. (2014). Trend and periodicity of temperature time series in Ontario. American Journal of Climate Change, 3: 272-288. http://dx.doi.org/10.4236/ajcc.2014.33026 [ Links ]
Cushman, J. C. & Bohnert, H. J. (1999). Crassulacean acid metabolism: molecular genetics. Annual Review of Plant Physiology and plant Molecular Biology, 50: 305-332. https://doi.org/10.1146/annurev.arplant.50.1.305 [ Links ]
Fritz, J. O., Vanderlip, R. L., Heiniger, R. W. & Abelhalim, A. Z. (1997). Simulating forage sorghum yields with SORKAM. Agronomy Journal, 89: 64-68. https://doi.org/10.2134/agronj1997.00021962008900010010x [ Links ]
García-Moya, E., Romero Manzanares, A. & Nobel, P.S. (2010). Highlights for agave productivity. GCB Bioenergy, 3:4-14. https://doi.org/10.1111/j.1757-1707.2010.01078.x [ Links ]
Granata, G., Faedda, R. & Ochoa, M. J. (2017). Diseases of cactus pear. In: Crop Ecology, Cultivation and Uses of Cactus Pear. Inglese, P., Mondragon, C., Nefzaoui, A. and Sáenz, C., eds. 115-123 pp. The Food and Agriculture Organization of the United Nations and the International Center for Agricultural Research Dry Areas. Roma, Italy. http://www.fao.org/3/a-i7012e.pdf [ Links ]
Inglese, P. (1995). Orchard planting and management. In: Agro-ecology, Cultivation and Uses of Cactus Pear. Barbera, G., Inglese, P., and Pimienta Barrios, E., eds.78-71 pp. The Food and Agriculture Organization of the United Nations and the International Center for Agricultural Research Dry Areas. Roma, Italy. [ Links ]
Inglese, P., Basile, F. & Schirra, M. (2002). Cactus pear fruit production. In: Cacti as a crop (P. S. Nobel Ed.). California University Press, 163-183. [ Links ]
Inglese, P., Gugliuzza, G. & Liguori, G. (2009). Fruit production of cultivated cacti: a short overview on plant ecophysiology and C Budget Acta Horticulturae, 811: 77-86. https://doi.org/10.17660/ActaHortic.2009.811.6 [ Links ]
Inglese, P., Liguori, G. & de la Barrera, E. (2017). Ecophysiology and reproductive biology of cultivated cacti. In: Crop Ecology, Cultivation and Uses of Cactus Pear. Inglese, P., Mondragon, C., Nefzaoui, A. and Sáenz, C., eds. 29-41 pp. The Food and Agriculture Organization of the United Nations and the International Center for Agricultural Research in the Dry Areas, Rome, Italy. http://www.fao.org/3/a-i7012e.pdf [ Links ]
IPCC [Intergovernmental Panel on Climate Change]. (2014). Climate Change 2014: Synthesis Report. Contribution of Working Groups I, II and III to the Fifth Assessment Report of the Intergovernmental Panel on Climate Change [Core Writing Team, R.K. Pachauri and L.A. Meyer (Eds.)]. Geneva, Switzerland, 151 pp. https://www.ipcc.ch/site/assets/uploads/2018/05/SYR_AR5_FINAL_full_wcover.pdf [ Links ]
Kendall, M. G. (1975). Rank Correlation Methods. 4th Edition, Charles Griffin, London. https://www.worldcat.org/title/rankcorrelation-methods/oclc/3827024 [ Links ]
Kumar, K., Singh, D. & Singh, R. S. (2018). Cactus pear: Cultivation and Uses. CIAH/Tech./Pub. No73, pp 38 ICA R-Central Institute for Arid Horticulture, Bikaner, Rajasthan, India. https://www.researchgate.net/publication/330104598_Cactus_Pear_Cultivation_and_uses [ Links ]
Liguori, G., Di Miceli, C., Gugliuzza, G. & Inglese, P. (2006). Physiological and technical aspects of cactus pear (Opuntia ficus-indica (L.) Mill.) double reflowering and out-of-season winter fruit cropping. Intranational Journal Fruit Science, 6(3): 23-34. https://doi.org/10.1300/J492v06n03_03 [ Links ]
Lobell, D. B. & Field, C. B. (2007). Global scale climate-crop yield relationships and the impacts of recent warming. Environmental Research Letters, 2:1-7. https://iopscience.iop.org/article/10.1088/1748-9326/2/1/014002/meta [ Links ]
Lobell, D. B. & Gourdji, M.S. (2012). The influence of climate change on global crop productivity. Plant Physiology, 160: 1686-1697. https://doi.org/10.1104/pp.112.208298 [ Links ]
Mann, H. B. (1945). Non-parametric test against trend. Econométrica, 13: 245-259. http://dx.doi.org/10.2307/1907187 [ Links ]
Medina-García, G., Ruiz-Corral, J. A., Rodríguez-Moreno, V. M., Soria-Ruiz, J., Díaz-Padilla, G. & Zarazúa-Villaseñor, P. (2016). Efecto del cambio climático en el potencial productivo del frijol en México. Revista Mexicana de Ciencias Agrícolas, 13: 2465-2474. https://doi.org/10.29312/remexca.v0i13.461 [ Links ]
Medina-García, G., Grageda-Grageda, J, Ruiz-Corral, J, Casas-Flores, J, Rodríguez-Moreno, V. & de la Mora-Orozco, C. (2019a). Disminución de las horas frío como efecto del cambio climático en México. Revista Mexicana de Ciencias Agrícolas, 10: 1325-37. https://doi.org/10.29312/remexca.v10i6.1688 [ Links ]
Medina-García, G., Zegbe, J. A. & Casas, J. I. (2019b). Efecto del calentamiento global en el rango térmico de nopal tunero (Opuntia spp) en el Centro Norte de México. Memorias de la Semana Internacional de Agronomía FAZ-UJED. pp. 686-691. http://faz.ujed.mx/siafaz/memorias/201931.pdf [ Links ]
Melo, T. M., Louzada, J. A. S. & Pedrollo, O. C. (2015). Trends in extreme indices and seasonal analysis of precipitation and temperature in the Northwest Region of Rio Grande do Sul, Brazil. American Journal of Climate Change, 4: 187-202. http://dx.doi.org/10.4236/ajcc.2015.43015 [ Links ]
Miró, J., Estrela, M. J., Pastor, F. & Millán, M. (2009). Análisis comparativo de tendencias en la precipitación, por distintos inputs, entre los dominios hidrológicos del Segura y del Júcar. Investigaciones Geográficas, 49: 129-157. https://dx.doi.org/10.14198/INGEO2009.49.07 [ Links ]
Nerd, A. & Mizrahi, Y. (1995). Effect of low winter temperatures on bud break in Opuntia ficus-indica. Advances in Horticultural Science, 9: 1-4. https://www.jstor.org/stable/42883043?seq=1 [ Links ]
Nobel, P. S. & Hartsock, T. L. (1984). Physiological responses of Opuntia ficus‐indica to growth temperature. Physiologia Plantarum, 60(1): 98-105. https://doi.org/10.1111/j.1399-3054.1984.tb04257.x [ Links ]
Nobel, P. S. (1988). Environmental biology of agaves and cacti. Cambridge, NY, USA, Cambridge University Press. 270 pp. [ Links ]
Nobel, P. S. (1991). Environmental productivity indices and productivity for Opuntia ficus-indica under current and elevated atmospheric CO2 levels. Plant, Cell and Environment, 14: 637-646. https://doi.org/10.1111/j.1365-3040.1991. tb01536.x [ Links ]
Nobel, P. S. (1996). Responses of some North American CAM plants to freezing temperatures and doubled CO2 concentrations: Implications of global climate change for extending cultivation. Journal of Arid Environments, 34: 187-196. https://doi.org/10.1006/jare.1996.0100 [ Links ]
Nobel, P. S. & Bobich, E. G. (2002). Environmental biology. In: Cacti: Biology and uses. Nobel, P. S., ed. 57-74 pp. Berkeley, CA, USA, University of California Press. [ Links ]
Nobel, P. S. (2002). Cactus physiological ecology, emphasizing gas exchange of Platyopuntia fruit. Acta Horticulturae, 581: 143-150. https://doi.org/10.17660/ActaHortic.2002.581.12 [ Links ]
Pimienta-Barrios, E. (1990). El nopal tunero. México, Universidad de Guadalajara. [ Links ]
Pimienta-Barrios, E. & del Castillo, R. F. (2002). Environmental biology. In: Cacti: Biology and uses. Nobel, P. S., ed. 75-90 pp. Berkeley, CA, USA, University of California Press. [ Links ]
Potgieter, J. & D’Aquino, S. (2017). Fruit production and post-harvest management. In: Crop Ecology, Cultivation and Uses of Cactus Pear. Inglese, P., Mondragon, C., Nefzaoui, A. & Sáenz, C., eds. 51-71 pp. The Food and Agriculture Organization of the United Nations and the International Center for Agricultural Research Dry Areas. Roma, Italy. http://www.fao.org/3/a-i7012e.pdf [ Links ]
Prat, L. & Franck, N. (2017). Morphology and anatomy of Platyopuntiae. In: Crop Ecology, Cultivation and Uses of Cactus Pear. Inglese, P., Mondragon, C., Nefzaoui, A. & Sáenz, C., eds. 21-28 pp. The Food and Agriculture Organization of the United Nations and the International Center for Agricultural Research Dry Areas. Roma, Italy. http://www.fao.org/3/a-i7012e.pdf [ Links ]
Rosenzweig, C. & Parry, M. L. (1994). Potential impact of climate-change on world food-supply. Nature, 367. 133-8. https://pubs.giss.nasa.gov/docs/1994/1994_Rosenzweig_ro05500b.pdf [ Links ]
Ruiz, J. A., Medina, G., Ramírez, J. L., Flores, H. E., Ramírez, G., Manríquez, J. D., Zarazúa, P., González, D. R., Díaz, G. & Mora, C. (2011). Cambio climático y sus implicaciones en cinco zonas productoras de maíz en México. Revista Mexicana de Ciencias Agrícolas, 2: 309-323. http://www.scielo.org.mx/scielo.php?script=sci_arttext&pid=S2007-09342011000800011 [ Links ]
Ruiz, J. A., Medina, G., González, I. J., Flores, H. E., Ramírez, G., Ortiz, C., Byerly, K. F. & Martínez, R. A. (2013). Requerimientos agroecológicos de cultivos. 2a. Edición. Centro de Investigación Regional Pacífico Centro. Campo Experimental Centro Altos de Jalisco. Tepatitlán, Jalisco, México. Libro Técnico Núm. 3. 564 p. [ Links ]
Ruiz-Corral, J. A.; Medina-García, G.; Rodríguez-Moreno, V. M.; Sánchez-González, J. J.; Villavicencio, G. R.; Durán, P. N.; Grageda, G. J. & García, J. E. (2016). Regionalización del cambio climático en México. Revista Mexicana de Ciencias Agrícolas, 13: 2451-2464. https://doi.org/10.29312/remexca.v0i13.460 [ Links ]
Salmi, T., Maatta, A., Anttila, P., Ruoho-Airola, T. & Amnell, T. (2002). Detecting trends of annual values of atmospheric pollutants by the Mann-Kendall test and Sen’s slope estimates -the Excel template application MAKESENS. Finnish Meteorological Institute, Air Quality Research. Publications on Air Quality No. 31. Report code FMIAQ-31. https://www.researchgate.net/publication/259356944_Detecting_Trends_of_Annual_Values_of_Atmospheric_Pollutants_by_the_Mann-Kendall_Test_and_Sen’s_Solpe_Estimates_the_Excel_Template_Application_MAKESENS [ Links ]
Sen, P. K. (1968). Estimates of the regression coefficient based on Kendall’s Tau. Journal of the American Statistical Association, 63 (324): 1379-1389. https://www.pacificclimate.org/~wernera/zyp/Sen%201968%20JASA.pdf [ Links ]
SIAP [Servicio de Información y Estadística Agroalimentaria y Pesquera]. (2020). Anuario estadístico de la producción agrícola 2003-2016. SAGARPA. http://infosiap.siap.gob.mx/aagricola_siap_gb/icultivo/index.jsp [ Links ]
Snyder, R. L. (1985). Hand calculating degree-days. Agricultural and Forest Meteorology, 35: 353-358. https://doi. org/10.1016/0168-1923(85)90095-4 [ Links ]
Van Vuuren, D. P., Edmonds, J., Kainuma, M., Riahi, K., Thomson, A., Hibbard, K., Hurtt, G. C., Kram, T., Krey, V., Lamarque, J. F. & Masui, T. (2011). The representative concentration pathways: an overview. Climatic Change, 109: 5-31 http://link.springer.com/article/10.1007%25252Fs10584-011-0148-z [ Links ]
Varela-Gámez, Y., Caldera-Arellano, A. K., Zegbe, J. A., Serna-Pérez, A. & Mena-Covarrubias, J. (2014). El riego en nopal influye en el almacenamiento y acondicionamiento de la tuna. Revista Mexicana de Ciencias Agrícolas, 8: 1377-1390. https://doi.org/10.29312/remexca.v5i8.817 [ Links ]
Walton, D., Meyerson, J. & Neelin, J. D. (2013). Accessing, Downloading, and Viewing CMIP5 Data. Earth System Grid Federation. [ Links ]
Cite this paper: Medina-García, G., Zegbe, J. A., Ruiz-Corral, J. A., Casa-Flores, J.I., Rodríguez-Moreno, V. M. (2021). Influence of climate change on thermal requirements of cactus pear (Opuntia spp.) in Central-Northern of Mexico. Revista Bio Ciencias 8, e1007. https://doi.org/10.15741/revbio.08.e1007
Received: June 28, 2020; Accepted: January 29, 2021
 Este es un artículo publicado en acceso abierto bajo una licencia Creative Commons
