


 texto en
  Inglés (pdf)
 Artículo en XML
 Referencias del artículo
 Enviar artículo por email
 Citado por SciELO
  Similares en
SciELO
Similares en
SciELO 
 Permalink
Introduction
Glioblastoma Multiforme (GBM) is the most malignant tumor of astrocytoma, and it is classified by the World Health Organization as a grade IV (Natsume A., 2008; Van Den Bent et al., 2017). It also has the worst prognosis of malignant neoplasms of the central nervous system (Louis et al., 2001; Louis et al., 2016; Ostrom et al., 2017; Park et al., 2017), and reported median survival for Glioblastoma is only 12 to 15 months (Wen & Kesari, 2008.,(Stupp & Roila, 2009). However, it is unclear which molecular mechanisms could be related to the survival rate of patients. It has been shown that proteins involved in the main cellular metabolic processes can be altered in diseases such as cancer, especially for those involved in processes that promote proliferation and survival. The family of aldehyde dehydrogenase enzymes (ALDH) is made up of more than 12 isoforms with sub-isoforms of cytosolic and mitochondrial enzymes (Jelski et al., 2014; Tomita et al., 2016; Visus et al., 2007), all with molecular weights of approximately 55 kDa. Their main function is the catalysis of aldehydes oxidation. It has been shown that this family is involved in different metabolic processes (Adam et al., 2012) including the oxidation through metabolic processing of carboxylic acids (Jelski et al., 2014).
ALDH1A1 is a cytosolic isoform, abundantly found in the liver, and involved in the main pathway of alcohol metabolism, along with alcohol dehydrogenase. Another important function of ALDH1A1 is the conversion of retinol to retinoic acid (Tomita et al., 2016), and recent studies suggested that this could influence differentiation processes and act as diagnostic biomarkers in lung cancer and glioblastoma (Adam et al., 2012; Arnold et al., 2015; Cheng et al., 2016; Kalantari et al., 2016; Rasper et al., 2010; Wang, Wang et al., 2018; Zhang et al., 2011). Other researchers proposed that the expression of ALDH1A1 contributes to the progression of the glioma, where overexpression was found in the high-grade glioma compared to the rest of glioma grades (Xu et al., 2015), while ALDH1A1 was reported to be a poor predictor in another study, according to the expression of ALDH1A1 in GBM (Schäfer et al., 2012). DYRK1B protein (dual specificity tyrosine phosphorylation regulated kinase 1B) (Ashford et al., 2014; Chen et al., 2017; Gao et al., 2009; Jin et al., 2007) had also been reported to participate in the regulation of the cell cycle (Gao et al., 2009) and its gene expression can be altered in tumor cells (Pérez-Sánchez et al., 2018), for instance being overexpressed in some types of human cancer, such as non-small-cell lung cancer, pancreatic ductal adenocarcinoma, colon carcinoma, cervical cancer, ovarian cancer (Chen et al., 2017; Deng et al., 2006) and glioblastoma (Zhou et al., 2017) . The purpose of this study was to investigate whether the protein expression of ALDH1A1 and DYRK1B had any correlation with GBM diagnosis or with survival times regarding their expression patterns.
Material and Methods
Cell viability assays
U-87 MG Cell Line from human brain (glioblastoma/astrocytoma) was cultured in DMEM-HG (Dulbecco’s Modified Eagle Medium High-Glucose, Gibco by Life Technologies), supplemented with 10 % fetal bovine serum (Gibco by Life Technologies), 1 % L-glutamine (Sigma-Aldrich Cat # G7513), 100 U/ mL of Ppenicillin and 100 mg/mL of Sstreptomycin (Gibco by Life Technologies), and maintained at 37 °C in a 95 % air and 5 % CO2 atmosphere. Cell viability was determined by Trypan blue exclusión technique (Strober, 2015) (Invitrogen Cat # 15250061, USA) at 48 h after exposure to ALDH1A1 at different concentrations (Invitrogen Cat # 11388H07E25, USA), results were analyzed by One-way ANOVA followed by Tukey’s Multiple Comparison Test.
Human biopsies
This study was approved by the Comité de Ética en Investigación of the Centro Oncológico Estatal (COE) ISSEMyM, Estado de México under the protocol number: COE/UEI/PG/14/2017. No informed consents were required, due to the retrospective nature of the study. Data on patients’ medical history and evolution were obtained from medical records of the hospital and samples were obtained from paraffin blocks. Ten samples of patients with glioblastoma, and one sample of each grade of glioma; GI, GII and GIII were used. All diagnoses were confirmed by imaging and by the department of pathology of the COE. All the patients with glioblastoma considered in this study were monitored from the beginning of their treatment (surgery and radiotherapy) and up to their death.
Immunohistochemistry
Tissue sections from healthy brain, healthy liver and infiltrating ductal breast carcinoma were kindly donated from the department of pathology of the COE and were used as control tissues. Slides were blocked with 1 % peroxide (Sigma) for 5 min at room temperature, washed with Phosphate-Buffered Saline (PBS), and incubated overnight at 4 ºC in the presence of antibodies for either ALDH1A1 (D9J7R) XP (Cell Signaling, Danver, MA, USA, Cat. # 36671S 1:400) or DYRK1B (Sigma Aldrich, Cat # HPA028786, 1:400). Subsequently, samples were washed with PBS, and incubated at room temperature for one hour with a secondary antibody, using a Mouse/Rabbit ImmunoDetector DAB HRP Brown kit (Cat. # BSB 0003) according to manufacturer’s instructions. Sections were counterstained with Harris hematoxylin (Sigma-Aldrich, HHS32-1L) and mounted using DPX mounting media. Slides were examined under a light microscope (Leica DM500). Images were obtained with Leica Microsystems Microscope imaging software, at 40X amplification. Ten independent fields were counted and analyzed by means of a One-way ANOVA followed by Newman-Keuls Multiple Comparison Test, and graphics were performed using GraphPad Prisma software.
Mass spectrometry
In order to detect the presence of ALDH1A1 by electrospray ionization, direct infusion mass spectrometry analysis (ESI-MS/MS) (Arnold et al., 2015; Kirwan et al., 2014). Peptide samples were analyzed using a QTRAP 4500 mass spectrometry system (Sciex, San Francisco, CA) with a NanoSource. Samples were dewaxed and incubated in an Extraction Buffer using the Qproteome FFPE Tissue Kit (QIAGEN, USA Cat. # 37623) according to manufacturer’s instructions. Total protein was isolated and processed for the generation of peptides. Briefly, total extract protein was reduced/ alkylated and digested with trypsin (Promega, Cat. # V5111). Resulting peptides were extracted, desalted using a ZipipC-18 system (Millipore, Cat. # ZTC18S096) and resuspended in 20 % acetonitrile and 0.1 % formic acid (Aebersold & Mann, 2003; Megger et al., 2017). A human recombinant ALDH1A1 protein (Invitrogen Cat. # 11388H07E25) was used as a control and received the same preparation treatment.
The distribution of molecules in Q1 was analyzed at a scan rate of 100 to 1000 m/z, Da, with 4500 Volts/150°C, then the ions for analysis in MS3 were selected using a de-clustering potential of 120, and a collision energy of 20 (Arnold et al., 2015). Database searching for protein identification was performed using “Mascot MS/MS ion search” (Matrix Science: available at http://www.matrixscience.com) against Swiss-Prot and NCBInr databases for Homo sapiens (human) AA protein databases. Cleavage tolerances of ± 1.2 Da were used for the precursor ion and ± 0.6 Da for masses of ion fragments. Monoisotopic mass values and unrestricted mass values were considered. Additionally, matching peptide sequences were analyzed using MS-BLAST software (Washington University, Saint Louis, MO; Available at: http://genetics.bwh.harvard.edu/msblast/) against Swiss-Prot and NCBInr databases to confirm that peptides matched.
Imaging
Representative images of 3 patients with Glio-blastoma multiforme were taken from their clinical re-cord of the hospital.
Reverse transcription and polymerase chain reaction (RT-PCR)
The presence of ALDH1A1 was additionally assessed using RT-PCR. For RNA extraction, biopsy samples were dewaxed (Bonin & Stanta, 2013) and then washed twice in cold PBS, pH 6.8. Then, total RNA was extracted using TRIzol reagent (Invitrogen, Cat # 15596026. USA) following manufacturer’s instructions. RNA concentration was measured by optical density using absorbance at 260 nm in a Multiskan GO light spectrometer (Thermo Scientific). RNA quality was verified by agarose gel electrophoresis by means of a BioDoc-UVP imaging system, as well as by 260/280 nm ratios. RT-PCR was performed using 5 μg of RNA which was treated with DNAse (New England BioLabs, Cat # M0303S) and using MMLV reverse transcriptase (Invitrogen, Cat # 28025013, USA), following manufacturer’s instructions. To amplify ALDH1A1, the following primers were used: forward 5’CCG TGG CGT ACT ATG GAT GC-3´ and reverse 5´-CGC AAT GTT TTG ATG CAG CCT-3’, for β-Actin, the primers used were: forward 5’-TGG CACC ACA CCT TCT ACA-3’ and reverse 5’-TCA CGC ACG ATT TCC C-3’.
Western blot assays
Total protein extraction was performed using a lysis buffer kit for tissue Qproteome FFPE Tissue Kit (QIAGEN, USA Cat. # 37623) following manufacturer’s instructions. Samples containing 50 μg of total protein were separated on 12 % SDS-PAGE gels and transferred onto polyvinylidene-difluoride membranes (Bio-Rad, Hercules, CA, USA). Membranes were blocked for 1 h at room temperature in 5 % skimmed milk, Tris-buffered saline with 0.1 % Tween-20, and then incubated at 4 °C overnight with primary antibodies against human ALDH1A1 (D9J7R) XP (Cell Signaling, Danver, MA, USA, Cat. # 36671S 1:1000) or DYRK1B (Sigma Aldrich, Cat # HPA028786, 1:1000). Blots were washed and incubated with a HRP-Goat/anti-rabbit secondary anti-body (Invitrogen Life Technologies, Cat. # 656120, 1:5000). As a positive control, blots were stripped and tested again with a monoclonal anti-β-actin antibody (Sigma-Aldrich, Cat. # A3854, 1:1000) and then with a goat anti-mouse antibody (Invitrogen, Cat. # 62-6520, 1:5000). Secondary antibodies were coupled with peroxidase (Life Technologies, Rockford, IL, USA) and proteins were revealed with Western Lightning® Plus-ECL, Enhanced Chemi-luminescence Substrate (Perki-nElmer, Inc., Waltham, MA, USA). Images from the films were digitally acquired with a BioDoc-It Imaging System (UVP).
Identification of ALDH1A1 in Glioblastoma tissue
Firstly, the clinical history of the patients was re-viewed (Table 1), as well as tomographic images (Figure 1a-c) of the glioblastomas. Tissue biopsies were characterized, and the presence of ALDH1A1 was additionally assessed using RT-PCR (Figure 1d) and mass spectrometry (Figure 2).
Table 1 Clinical characteristics of patient’s GBM.
| Gioma grade |
Age (years) |
Sex | Medical records | Tumo location | RT cycles |
CT | Time survival (months) |
|||||||||
|---|---|---|---|---|---|---|---|---|---|---|---|---|---|---|---|---|
| Male | Female | DM | HT | Ht | SMOH | ALD | Fro | Par | Occ | Right | Left | |||||
| GBM | 29 | + | + | + | + | 30 | Tmz,Bvz | 47 | ||||||||
| GBM | 42 | + | + | + | + | + | + | 30 | Tmz | 8 | ||||||
| GBM | 47 | + | + | + | + | + | + | + | 25 | Tmz | 6 | |||||
| GBM | 59 | + | + | + | + | + | + | + | + | 34 | Tmz | 15 | ||||
| GBM | 60 | + | + | + | + | 0 | neither | 1 | ||||||||
| GBM | 60 | + | + | + | + | + | + | 0 | neither | 1 | ||||||
| GBM | 61 | + | + | + | + | + | + | + | 30 | Tmz,Cbp | 3 | |||||
| GBM | 62 | + | + | + | + | + | 22 | Tmz | 2 | |||||||
| GBM | 65 | + | + | + | + | + | + | 32 | Tmz | 4 | ||||||
| GBM | 72 | + | + | + | + | + | + | + | 29 | Tmz | 3 | |||||
DM= Diabetes mellitus; HT= Hyperthyroidism; Ht= Hypertension; SMOH=Smoking; ALD= Alcoholic disease. Fro=Frontal; Par= Parietal; Occ= Occipital. Tmz= Temozolamide; Bvz= Bevacizumab; Cbp= Carboplatin.

Figure 1 Glioblastoma (GBM). Representative magnetic resonance images of three different patients with GBM. Images show single tumors with central necrosis and peripheral reinforcement associated with the Gadolinium (GD) contrast medium associated with extensive peripheral ring edema were identified; a) Tumor in axial section. b) Tumor in coronal section and in c) Tumor in Parasagital section. d) RT-PCR analysis specific for aldh1a1 and β-actin in the samples of patient’s with GBM, as negative control no DNA was added in the assay.

Figure 2 ALDH1A1 detected in Glioblastoma tissue. a) A representative mass spectrum of precursor ion 796.3 m/z of ALDH1A1 in MS3 using an ESI-MS/MS-based peptide method. The precursor ion corresponded to the peptide ANNTFYSAGVFTK this sequence was analyzed by Blast-nucleotide and corresponded to the alpha chain of the aldehyde dehydrogenase (https://blast.ncbi.nlm.nih.gov). b) Mass spectrometric parameters used for ALDH1A1 detection.
Effect of ALDH1A1 in cell growth of U87-MG glioblastoma cells
To evaluate the effect of ALDH1A1 on cell viability, human glioblastoma U87-MG cells were treated with different concentrations of purified recombinant ALDH1A1 protein (Figure 3). The cultures were evaluated at 48 hours after treatment, the number of viable cells was quantified using Trypan blue exclusion assay. The vehicle without protein was used as a control. ALDH1A1 was observed to induce an increase in the number of viable cells due to the increase in proliferation, in a concentration-dependent way. The increase in cell viability was believed to be related to cellular metabolic processes since this has been also reported by other authors (Tomita et al., 2016; Yue et al., 2015) regarding the participation of ALDH1A1 in the process of cell growth and proliferation.

Figure 3 ALDH1A1 increased cell viability in U87-MG glioblastoma cells. ALDH1A1 induced an increase in the number of viable cells in a concentration-dependent way. Effect of ALDH1A1 on viability of U-87 MG cells. The graph shows arbitraries unit of the viable U-87 MG cells, as determined by the Trypan blue exclusion 48 hours after treated with different concentrations of purified recombinant ALDH1A1. Controls were treatment with the vehicle without protein. The concentrations of 25 and 50 ng/μL did not show significant difference in comparison with the control group. The control was different from the groups; 100 ng/µL, 150 ng/µL and 250 ng/µL. The concentration of 250 ng/µL was different in comparison with the control but was not for the 150 ng/µL or 100 ng/µL concentration. One-way ANOVA followed by Tukey’s Multiple Comparison Test. **p<0.001, ***p<0.0001. Bar are mean + S.D., n=3.
Glioblastoma tissues presented immunoreactivity to ALDH1A1 and DYRK1B
ALDH1A1 and DYRK1B expression was assessed in glioblastoma tissues by immunohistochemical staining. Different expression patterns were observed and classified according to their intensity in tumor cells (Figure 3, 4). Three categories were established: focal, weak scattered and negative in neoplasm (but positive in endothelium). DYRK1B also showed immunoreactivity in glioblastoma tissue, and its expression pattern was very similar to that of ALDH1A1, equal variances were observed between ALDH1A1 and DYRK1B (p=0.2881), therefore the same classification was used. With the previous observations, ALDH1A1 and DYRK1B expression was assessed in low-grade gliomas (Figure 4) by immunohistochemistry. Interestingly, in grade I it was negative; in grade II it showed a weak focal, while in grade III a weak scattered expression was observed. These differences in expression patterns in the glioblastoma (Figure 5) were believed to be related to the progress of the disease, and it is important to continue investigating this point. ALDH1A1 and DYRK1B expression was observed in tumors samples by western blot technique as well (Figure 6a-b), in the focal group, the signal was more intense regarding weak scattered and negative neoplasm compared to the healthy brain sample, while for DYRK1B the signal was more intense in focal and weak scattered compared to the healthy brain sample.
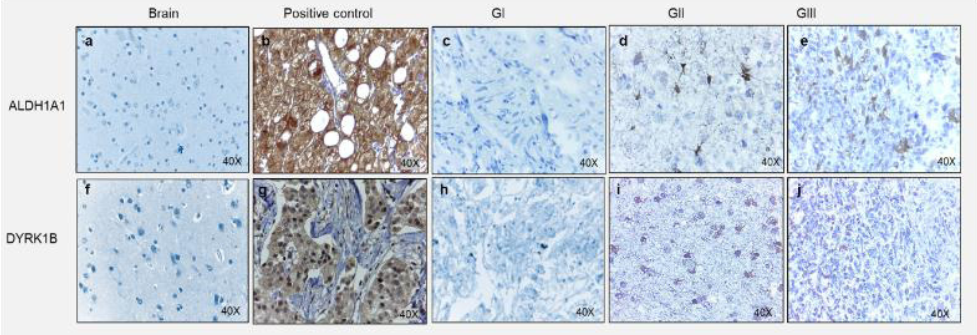
Figure 4 Expression of ALDH1A1 and DYRK1B into gliomas. Representative images of immunohistochemical assays for ALDH1A1 and DYRK1B in different grade gliomas. For ALDH1A1; a) Healthy brain, b) Healthy liver as a positive control, c) Glioma Grade I (GI), d) Glioma Grade II (GII), d) Glioma Grade III (GIII)., For DYRK1B; f) Healthy brain., g) Invasive ductal breast carcinoma as a positive control, h) Glioma Grade I (GI), i) Glioma Grade II (GII), j) Glioma Grade III (GIII). Images at 40X magnification.

Figure 5 Expression patterns of ALDH1A1 and DYRK1B in Glioblastoma. Representative images of immunohistochemical assays for ALDH1A1 and DYRK1B. Healthy human brain tissue was used as a negative control for ALDH1A1 and DYRK1B, healthy liver tissue was used as a positive control for ALDH1A1, and invasive ductal breast carcinoma tissue was used as a positive control for DYRK1B. Three different expression patterns were observed in the tissues of glioblastoma tissue patients; Focal, Weak Scattered and Negative in neoplasm (but positive in endothelium). Images at 40X magnification.

Figure 6 Expression of ALDH1A1 and DYRK1B in Glioblastoma tissues and time of survival in patient's Glioblastoma. A representative image of western blot. a-b) Show ALDH1A1 and DIRK1B expression and β-actin as a control, determined by Western blot. c-d) Percentage of positive cells for ALDH1A1 and DYRK1B respect to their observed expression pattern. One-way ANOVA followed by Tukey’s Multiple Comparison Test. e) Graph of survival time with respect to ALDH1A and DIYRK1B expression pattern. Kaplan-Meier, n=10.
DYRK1B and ALDH1A1 expression patterns have significant correlation with overall survival
The number of positive cells per field for ALDH1A1 and DYRK1B was quantified, analyzed and evaluated against overall survival per patient (Figure 6e). For each patient, the tropism between ALDH1A1 and DYRK1B in the samples was equivalent. Because immunoreactivity patterns showed interesting results, the correlation of the quantity of positive cells versus the survival time was analyzed, with a value of -0.874, therefore this trend was believed to play an important role in the development of the disease. The greatest overall survival was observed in the classification of negative neoplasm expression, while the classification of weak scattered expression had the lowest.
Discussion
Glioblastoma multiforme is a disease with particularly poor prognosis and a short overall survival. It has been shown that proteins involved in main cell metabolic processes can be altered in diseases such as cancer, especially in those involved in processes that promote proliferation and survival. The presence of DYRK1B in glioblastoma, which has been characterized for this specific type of cancer (Vilenchik et al., 2019), and which has been stably found in clinical samples, has shown an expression pattern similar to ALDH1A1, and an inverse correlation with overall survival of patients of this study, although there was a controversy regarding the presence of ALDH1A1 and survival, such as Adam et al. 2012 who described ALDH1A1 as a marker of astrocytic differentiation during brain development and a better prognosis marker in patients suffering from primary glioblastoma. This will hopefully allow for new lines of research regarding signaling pathways in glioblastoma to emerge, hoping to elucidate the mechanisms towards which pathways for cell cycle signaling and apoptosis converge. There are other reports such as Rasper et al. 2010 where they reported that ALDH1+ cells were found close to tumor vessels or around necrotic areas, hypothesizing GBM Tumor Stem Cells to be predominantly localized in the proximity of tumor vessels showing close interaction with endothelial cells, as well Tomita et al. 2016 indicated that ALDH1A is a novel stem cell marker and is present in different types of cancers. Many more questions have been raised on this topic, and it is necessary to continue investigating the consequences of over‑expression of DYRK1B in glioblastoma, and the differences in histological patterns of expression. The relationship between ALDH1A1 expression and the clinical prognosis in different degrees of glioma (Adam et al., 2012; Liu et al., 2017; Xu et al., 2015) and among patients with GBM is increasingly evident. Altogether, the high ALDH1A1 expression is proposed as poor prognostic. In addition, ALDH1A1 is considered as a promising objective to improve the treatment of GBM according to its previous role as a mediator for temozolomide resistance in patients with GBM (Schäfer et al., 2012), where a greater number of research studies on its behavior is required at the molecular level. On the other hand, although ALDH1A1 has been reported in several types of cancers (Gong et al., 2014), including glioblastoma, it is also important to investigate further why these different expression patterns occur. Correlation analyses of ALDH1A1 and DYRK1B expression patterns vs overall survival left many questions unanswered. DYRK1B, as well as ALDH1A1, were believed to have an important participation in the progression of the disease, and should be more thoroughly studied in GBM, given their potential as prognostic markers (Gong et al., 2014; Rasper et al., 2010) or new therapeutic targets. Although ALDH1A1 and DYRK1B (Friedman, 2013; He et al., 2018; Huangfu & Anderson, 2005; Olmez et al., 2015) are completely different proteins, it is necessary to carry out more studies in order to determine the pathways in which they are involved, and whether there is any one they share. One perspective for the future is to quantify ALDH1A1 expression levels with respect to DYRK1B using qPCR, and to evaluate how this correlates with the activation of other growth-dependent kinases active in the neurological system, such as Akt, Erk, or cyclin D1. Moreover, determining ALDH1A1 and DYRK1B expression levels in plasma compared to the levels found in the tumor tissue would help assess whether disruptions in the expression of these two genes can be detected in earlier stages of the disease through peripheral blood screening. The finding in this project allowed to observe the detection of DYRK1B in glioblastoma, with different expression patterns and an expression behavior that closely resembles the one observed in ALDH1A1 as well as the tendency that these patterns have regarding the survival time.
Conclusion
The most relevant finding in this project was the detection of DYRK1B in GBM, with different expression patterns and an expression behavior that closely resembles the one observed for ALDH1A1. These findings allowed to consider that ALDH1A1 and DYRK1B expression levels may be prognostic factors in the diagnosis or possible biomarkers for overall survival in patients with glioblastoma.

