


 nova página do texto(beta)
 Inglês (pdf)
 Artigo em XML
 Referências do artigo
 Enviar este artigo por email
 Citado por SciELO
  Similares em
SciELO
Similares em
SciELO 
 Permalink
Introduction
In the mexicanus complex of the genus Peromyscus, 12 species with tropical affinities are recognized, four distributed in México: P. carolpattonae, P. gymnotis, P. mexicanus, and P. zarhynchus (Pérez-Consuegra and Vázquez-Domínguez 2017; Álvarez-Castañeda et al. 2019), and eight restricted to Central America: P. bakeri, P. gardneri, P. grandis, P. guatemalensis, P. nicaraguae, P. nudipes, P. salvadorensis, and P. tropicalis (Ordoñez-Garza et al. 2010; Pérez-Consuegra and Vázquez-Domínguez 2015, 2017; Bradley et al. 2016; Lorenzo et al. 2016; Álvarez-Castañeda et al. 2019). The Peromyscus mexicanus complex has been under constant taxonomic review by various authors, with several new species described (Pérez-Consuegra and Vázquez-Domínguez 2015; Lorenzo et al. 2016; Álvarez-Castañeda et al. 2019). The first review of this complex was conducted by Huckaby (1980), where several subspecies described for Central America are now considered valid species (Pérez-Consuegra and Vázquez-Domínguez 2015).
The Peromyscus mexicanus complex comprises seven subspecies (Carleton 1989; Trujano-Álvarez and Álvarez-Castañeda 2010): P. m. angelensis, distributed in the Sierra Madre del Sur from Guerrero to Oaxaca; P. m. azulensis, restricted to mountains of eastern Oaxaca; P. m. mexicanus, in the tropical rainforests of Veracruz and the Gulf of Oaxaca coastal plain; P. m. putlaensis, in a region between the western portion of the Sierra Madre del Sur and the southwestern part of the mountains and valleys of western Oaxaca; P. m. saxatilis, from the Isthmus of Tehuantepec to Costa Rica; P. m. teapensis, in the humid forests of Veracruz, Tabasco, and Chiapas; and P. m. totontepecus, restricted to the mountains of the Sierra Madre del Sur in the Gulf side (SMG) of Oaxaca (Huckaby 1980; Hall 1981; Trujano-Álvarez and Álvarez-Castañeda 2010; Figure 1). The populations of P. m. nicaraguae, P. m. salvadoresis, and P. m. tropicalis distributed from Guatemala to Panama are currently recognized as distinct species (Ordoñez-Garza et al. 2010; Pérez-Consuegra and Vázquez-Domínguez 2015, 2017; Bradley et al. 2016; Lorenzo et al. 2016; Álvarez-Castañeda et al. 2019).
The mountainous regions of Oaxaca represent an ideal model for studying evolutionary processes that determine genetic diversity due to their climatic, physiographic, and geological characteristics (Sullivan et al. 1997; García-Mendoza et al. 1994). These characteristics of mountainous regions and their physical separation foster isolation and possible endemism of populations of P. mexicanus (Bedford and Hoekstra 2015).
The genetic characterization of other groups of Peromyscus species has revealed high genetic divergence among populations inhabiting different mountainous areas (Álvarez-Castañeda et al. 2019; Bradley et al. 2019; Greenbaum et al. 2019; Léon-Tapia et al. 2020). The main mountain ranges of Oaxaca are not currently interconnected, are associated with different climates, and differ in vegetation composition (Ortiz-Pérez et al. 2004; McCormack et al. 2009). Peromyscus mexicanus has been studied in different mountainous regions of Central America and southern México, where a positive correlation has been found between mountain ranges and the presence of different species; hence, the same condition is likely to exist in Oaxaca (Smith et al. 1986; Huckaby 1973, 1980; Rogers and Engstrom 1992; Ordoñez-Garza et al. 2010; Pérez-Consuegra and Vázquez-Domínguez 2015, 2017; Lorenzo et al. 2016; Álvarez-Castañeda et al. 2019).
The geographic isolation of mountain regions is likely to restrain gene flow between populations of P. mexicanus. Therefore, molecular and morphological-cranial differences are expected to occur between the populations of P. m. totontepecus in the Sierra Madre del Sur, Pacific side (SMP), in Oaxaca and P. m. angelensis and P. m. putlaensis in the Sierra Madre del Sur, Gulf side (SMG), in Oaxaca. To establish the relationship of P. mexicanus populations living in both sides of the Sierra Madre del Sur of Oaxaca, these populations were compared with other populations distributed in México and Central America through genetic and morphological analyses.
Materials and methods
The Sierra Madre del Sur are present in the Gulf and Pacific sides of Oaxaca (Morrone 2017). The Gulf side covers an area of 17,519 km2 with mountains reaching elevations of 2,500 masl. Vegetation is dominated by mountain cloud forests, tropical forests, and xeric shrubland (Ortiz-Pérez et al. 2004). The types of climate are humid, with mean annual temperature between 22 ºC and 24 ºC and mean annual precipitation of 4,000 mm, and semi-warm humid, with mean annual temperature of 18 ºC to 22 ºC and mean annual precipitation of 3,800 mm (Trejo 2004).
The Pacific side in Oaxaca covers an area of 12,350 km2, with elevations above 2,000 masl. Vegetation is dominated by mountain cloud forests, medium sub-evergreen forests, and shrubland, together with low deciduous forests in restricted areas (García-Mendoza and Torres 1999). The climate is humid and semi-warm humid, with temperatures of 22 ºC to 26 ºC and, in the highest zones, of 18 ºC to 22 ºC; the mean annual precipitation ranges between 3,000 mm and 3,500 mm (Trejo 2004).
We used material previously deposited in the Mammal Collection of the Centro de Investigaciones Biológicas del Noroeste (CIB). The specimens were identified based on cranial traits following the taxonomic keys of Álvarez-Castañeda et al. (2015, 2017).
Samples of specimens. For the genetic and morphometric studies, we used specimens from Oaxaca of the following subspecies of P. mexicanus (n for the molecular analysis / n for the morphometric analysis). From the SMP: P. m. angelensis (n = 7/9) from two localities: 0.5 km W, San Felipe Lachillo (n = 2/2) and 0.5 km N, San Francisco Huamelula (n= 5/7) and P. m. putlaensis (n = 1/3) 0.62 km NE, San José de las Flores. From the SMG: P. m. totontepecus (n = 14/19) 10 km S, 5 km W Valle Nacional. In addition, we used specimens from Los Tuxtlas, Veracruz, which should be assigned to P. m. mexicanus (Hall 1981; Carleton 1989; Trujano-Álvarez and Álvarez-Castañeda 2010); however, to include a clear difference from P. mexicanus distributed to the north, this population will hereafter be referred to as “P. m. Tuxtlas”.
DNA sequence data. We sequenced the cytochrome b gene (Cytb; n = 27) for specimens representing P. m. angelensis, P. m. putlaensis, P. m. totontepecus, and P. m. Tuxtlas. Genomic DNA was extracted from muscle tissue preserved in 95 % ethanol (stored at -20 °C) using the DNeasy Kit (Qiagen Inc., Valencia, California) protocols. For the proximal 5 ′ -3 ′ ~800 bp of Cytb, we used the primer pairs MVZ05/MVZ16 (CGA AGC TTG ATA TGA AAA ACC ATC GTT G/AAA TAG GAA RTA TCA YTC TGG TTT RAT; Smith 1998).
The following conditions were used for the initial double-strand amplification: 12.5 μl of (10 ng) template; 4.4 μl ddH2O; 2.5 μl of each primer pair (10 nM); 0.474 μl (0.4 nM) dNTPs; 0.5 μl (3 mM) MgCl2; 0.125 μl Taq polymerase (Platinum Taq DNA Polymerase High Fidelity, Invitrogen, Carlsbad, California); and 1× Taq buffer, to make a final volume of 25 μl. Amplification consisted of a 3-minute initial denaturation at 94 °C followed by 37 denaturation cycles at 94 °C for 45 s each; 45 s annealing at 50 °C; and extension at 72 °C for 60 s. PCR amplicons were cleaned using the QIAquick PCR Purification Kit (Qiagen), and templates were cycle-sequenced in both directions using the Big Dye terminator chemistry (Applied Biosystems Inc., Foster City, California). All products were sequenced by Macrogene Geumcheon-gu, Seoul, Korea, and deposited in GenBank.
The resulting nucleotide sequences were edited in SEQUENCHER 4.1.4 (GeneCodes Corporation), followed by the alignment of sequences and matrix manipulations. Sequences were manually verified and translated into amino acids to check for spurious stop codons and for alignment confirmation.
Genetic diversity. The DnaSP ver 6.12.03 software was used to estimate the haplotypic and nucleotide diversity of the populations of each side of the Sierra Madre del Sur separately and with the populations combined (Librado and Rozas 2009). Levels of differentiation were assessed with p-distances calculated in Mega X (Kumar et al. 2018) using the Kimura 2-parameter model (Kimura 1980). Nucleotide diversity (Pi), haplotype diversity (Hd), F s value (Fu) and Tajima’s (D) were obtained in Arlequin 3.5 (Excoffier and Lischer 2010).

Figure 1 Map of the localities of specimens used for the genetic and morphological analyses. Numbers in the map mark the following localities: 1) Misantla, 2) Tutotepec, 3) Zongolica, 4) Los Tuxtlas, 5) Valle Nacional, 6) San José de las Flores, 7) San Francisco Huamelula, and 8) San Felipe Lachilló. Letters indicate the type localities of A) P. m. mexicanus (El Mirador, red), B) P. m. tontotepecus (Tonototepec, light blue), C) P. m. putlaensis (Putla, dark green), D)P. m. angelensis (Puerto Ángel, light green), E) P. m. teapensis (Teapa, dark gray), and F)P. m. azulensis (Cerro Azul, black).
Phylogenetic analyses. The most appropriate substitution model for the data set was determined using the Akaike information criterion (AIC) as implemented in MrAIC (Nylander et al. 2008). Bayesian analyses were conducted in MrBayes ver. 3.0b4 (Ronquist and Huelsenbeck 2003), using four separate runs with Markov-chain Monte Carlo simulations starting from a random tree. Each run was allowed to go for 20 million generations, sampling at intervals of 1,000 generations. The first 25 % of samples was discarded as burn-in; the remaining sampled trees were analyzed to obtain the posterior probability of the resulting nodes. Partitioned model was assessed using each of the three codon positions separately while applying equal weights and nodal support using non-parametric bootstrapping. ML analyses (Felsenstein 1981) were run in PAUP ver. 4.0b10 (Swofford 2002) using a heuristic search with 1,000 replicates and swapping with the Tree Bisection Reconnection (TBR) algorithm.
In addition to the 27 sequences obtained, we downloaded from GenBank 29 sequences corresponding to specimens of the mexicanus group used in previous phylogenetic studies (Supplementary material 1; Bradley et al. 2007; Ordoñez-Garza et al. 2010; Pérez-Consuegra and Vázquez-Domínguez 2015, 2017). Eight species were included as an external group: P. boylii, P. furvus, P. maniculatus, P. mayensis, P. megalops, P. melanocarpus, P. melanophrys, and P. sirtoni (Supplementary material 1; Smith and Patton 1999; Amman et al. 2006; Bradley et al. 2007; Rogers et al. 2007). Phylogenetic trees were observed with the FIGTREE 1.4.4 program (Rambaut 2012).
Morphological analysis. Four somatic measurements of each of the specimens were taken from skin labels: total length (ToL), tail length (TaL), foot length (LHF), and ear length (LE). In addition, we recorded 19 craniodental measurements with a digital vernier to the nearest 0.01 mm: greatest length of skull (GLS), skull height (SKH), condylobasal length (CBL), bullar length (BUL), shield-bullae depth (SBD), diastema length (DIL), rostral height (ROH), rostral breadth (BRR), palatal bridge length (PBL), post-palatal length (POL), basioccipital length (OCL), maxillary toothrow length (MTL), maxillary toothrow breadth (MTB), post-dental breadth (PDB), zygomatic breadth (ZYB), braincase breadth (BAB), nasal length (NAL), interorbital breadth (IOB), and nasal breadth (NAB). Cranial measurements were defined according to Diersing (1981), Williams and Ramírez-Pulido (1984), and Robinson and Dippenaar (1987).
Five age classes were assigned based on tooth growth and wear (Monroy-Gamboa et al. 2005). The specimens assigned to age classes 1 and 2 were considered juvenile and excluded from the analyses. Classes 3 and 4 were classified as adults, while class 5 were considered old. The analysis of sex variation was based on 38 adult specimens (19 females and 19 males) and used an analysis of variance (ANOVA) in STATISTICA ver. 7.0 (Statsoft Inc. 2007). A Kruskal-Wallis test (multiple comparisons with Dunn’s method) was used to test for differences among groups.
The four somatic and 19 cranial measures were analyzed through an ANOVA with the Scheffe post hoc test to differentiate the populations associated with each subspecies. A Principal Component Analysis (PCA) was performed with the Mahalanobis distance to distinguish populations using STATISTICA ver. 7.0 (Statsoft Inc. 2007) and Paleontological Statistics PAST (ver. 3.26; Hammer et al. 2001). The PCA were performed after the data for the original variables were log-transformed, because in the first analysis all the factorial loads have the same sign in order to reduce the effect of scale differences among them. Somatic measurements were not included in the morphological analyses due to the high coefficient of variation (˃ 10). Morphological comparisons from each of the geographical areas were made in coloration patterns, shape, and measurements. The LSID for this publication is: urn:lsid:zoobank.org:pub:A8949600-7E9C-4497-92A3-998A32110B25.
Results
The genetic diversity analysis of the 56 sequences of the mexicanus group showed a total of 36 non-redundant haplotypes, a nucleotide diversity Pi = 0.07, and haplotype diversity Hd= 0.96 (Supplementary material 1). The analysis of the 22 sequences of P. m. angelensis, P. m. putlaensis, and P. m. totontepecus yielded nine non-redundant haplotypes with 45 variable sites, Pi = 0.03, Hd = 0.85, F s Fu = 6.6, and Tajima’s D = 1.94. Specifically, within the populations of SMP, P. m. angelensis-P. m. putlaensis (n= 7) showed three non-redundant haplotypes, Pi = 0.00182, Hd = 0.607, F s Fu = 0.671, and Tajima’s D = -0.73. In SMG, P. m. totontepecus (n = 16) showed six non-redundant haplotypes, eight variable sites, Pi = 0.00286, Hd = 0.747, F s Fu = -0,941, and Tajima’s D = -0.74.
Phylogenetic analyses. The molecular substitution model that best fitted the sequences was GTR+I+G (General Time reversible using a gamma distribution and assuming that a given fraction of the sites are invariable; Tavaré 1986). The nitrogenous base frequencies were: A = 31.85, C = 26.66, G = 13.25, and T = 28.25; in addition to invariable sites = 0.5427, gamma distribution = 1.0458, AIC = 18,936.53, -Lnl = 9,342.92.
The maximum likelihood (tree not shown) and Bayesian inference (Figure 2) tests showed similar topologies and clades within the P. mexicanus complex, in addition to those described by Pérez-Consuegra and Vázquez-Domínguez (2017). The results show two clades. The first corresponds to the specimens of P. m. totontepecus from Valle Nacional, and P. m. Tuxtlas. The second, to the three localities of P. m. angelensis and P. m. putlaensis: San José de las Flores, Lachilló, and Huamelula. The P. m. totontepecus-P. m. Tuxtlas and P. m. angelensis-P. m. putlaensis clades are more closely related to P. gymnotis than to the known species of P. mexicanus (from central to northern Veracruz).
Table 1 Percentage of genetic differentiation (p-distance) obtained from Cytb sequences within species of the mexicanus group among populations of P. m. totontepecus - P. m. Tuxtlas (SMG) and P. m. angelensis - P. m. putlaensis (SMP), P. mexicanus and more related species.
| 1 | 2 | 3 | 4 | 5 | |
|---|---|---|---|---|---|
| 1 P. m. tontotepecus-P. m. Tuxtlas | 0.70 | ||||
| 2 P. m. angelensis-P. m. putlaensis | 5.31 | 0.37 | |||
| 3 P. gymnotis | 5.67 | 7.15 | 1.42 | ||
| 4 P. mexicanus | 5.98 | 7.54 | 6.80 | 1.47 | |
| 5 P. zarhynchus | 8.58 | 9.38 | 8.93 | 7.33 | 1.94 |
The P. m. angelensis-P. m. putlaensis specimens were 5.31 % (p-distance) genetically divergent compared with P. m. totontepecus, 7.15 % relative to P. gymnotis, and 7.54 % with respect to P. mexicanus. The P. m. totontepecus specimens showed a 5.67 % genetic divergence with P. gymnotis and 5.98 % with P. mexicanus (Table 1). The P. m. angelensis-P. m. putlaensis and P. m. totontepecus-P. m. Tuxtlas specimens showed a genetic divergence with the rest of the species of the mexicanus group higher (> 5.9 %) than that of P. gymnotis. Peromyscus m. totontepecus specimens showed an intra-population genetic divergence of 0.70 % and those of P. m. angelensis-P. m. putlaensis, of 0.37 %.
Morphological comparisons. Specimens from each side of the Sierra Madre del Sur share similar cranial (Figure 3) and external morphologies. The P. m. angelensis-P. m. putlaensis have a slightly grayish pelage that is lighter-colored and rough, and the abdomen is paler than in P. m. totontepecus. The specimens of both sides of the Sierra Madre del Sur have whitish legs, with the proximal part darker and almost black. The tail is long, with very short hair but a hairless appearance, usually dorso-ventrally bicolored or with white spots in the ventral part. Peromyscus m. totontepecus specimens have a more marked ring spot around the eye than specimens of P. m. angelensis-P. m. putlaensis. Specimens of P. m.Tuxtlas have a darker and softer pelage.

Figure 2 Bayesian inference obtained from the p-distance analysis of Cytb sequences of Peromyscus mexicanus angelensis, P. m. putlaensis, and P. m. totontepecus. Species of the mexicanus complex are included; other related Peromyscus species were used as an external group. Bootstrap / posterior probability support values are shown on the nodes in each branch of the tree.
Geographic variation. The means and standard deviation of the somatic and craniodental measurements obtained by ANOVA show that P. m. totontepecus is larger (total length; ToL) compared with P. m. angelensis, P. m. putlaensis, and P. m. Tuxtlas (P < 0,001; Table 2).
The ANOVA post hoc Scheffe test between P. m. angelensis, P. m. putlaensis, P. m.Tuxtlas and P. m. totontepecus indicate non-significant differences in any variables (somatic and craniodental) between the following pairs of taxa: P. m. angelensis-P. m. putlaensis; P. m. angelensis-P. m. Tuxtlas; P. m. putlaensis-P. m. Tuxtlas. Significant differences were observed between these pairs of taxa: P. m. putlaensis-P. m. totontepecus, in one somatic variable (LHF); P. m. totontepecus-P. m. Tuxtlas, in two somatic variables (ToL and LE) and two craniodental variables (CBL, PBL); P. m. angelensis-P. m. totontepecus, in two somatic variables (ToL and LHF) and five craniodental variables (GLS, CBL, SBD, POL, NAB; Appendix 1).
Principal Component Analysis. The PCA of the 19 craniodental variables showed that the first principal component accounts for 50 % of the data variability; the second, for 9 %; and the third, for 7 %, summing to 66 % of the variation. The scores of the PCA for P. m. angelensis, P. m. putlaensis, P. m. Tuxtlas, and P. m. totontepecus indicate that there is no geographic pattern for the differences in “size” in PC1; however, these clades could be distinguished by their respective scores on each of the “shape” axes in PC2, PC3, and PC4, although these axes explain relatively little of the total variation (Appendix 2; Figure 4).
The Mahalanobis distance test determined the absence of outliers in the PCA. The plot of the results of the PCA shows that P. m. totontepecus tends to have the largest basioccipital region, whereas the smallest was found in P. m. mexicanus. We found only a few differences in the interorbital region between P. m. angelensis-P. m. putlaensis and P. m. totontepecus, in which it is larger in size, compared with P. m. Tuxtlas, in which it tends to be smaller.

Discussion
The molecular systematics of the Peromyscus mexicanus group has been extensively revised for southern México and Central America. However, an in-depth review has not been conducted for populations north of the Isthmus of Tehuantepec. Data obtained from the mountain systems of southern México and Central America (Álvarez-Castañeda et al. 2019; Bradley et al. 2007, 2016; Lorenzo et al. 2016; Ordoñez-Garza et al. 2010; Pérez-Consuegra and Vázquez-Domínguez 2015, 2017) suggest that the conditions in the state of Oaxaca have favored the development of P. mexicanus into a complex of species.
The results of the phylogenetic analyses of P. m. angelensis-P. m. putlaensis and P. m. totontepecus-P. m. Tuxtlas are clearly separate from the nominal taxon, P. mexicanus distributed from central Veracruz to the north.
Table 2 Arithmetic means ± standard deviation of four external measurements and 19 cranial measurements of each group of P. mexicanus from the Sierras of Oaxaca and Veracruz: P. m. angelensis: 0.5 km W San Felipe Lachilló, Oaxaca (n = 2) y 0.5 km N San Francisco Huamelula, Oaxaca (n = 7); P. m. Tuxtla: Estación de Biología Tropical los Tuxtlas, Veracruz (n = 7); P. m. putlaensis 0.62 km NE San José de las Flores, Oaxaca (n = 3); P. m. totontepecus: 10 km S, 5 km W Valle Nacional, Oaxaca (n = 19). F-values and significance levels (in bold) were obtained through an ANOVA.
| Measuerments | P. m. angelensis | P. m. Tuxtlas | P. m. putlensis | P. m. tontotepecus | F | P-value |
|---|---|---|---|---|---|---|
| Total length (ToL) | 225.13 ± 4.13 | 224.13 ± 5.84 | 225.33 ± 9.53 | 248.36 ± 3.52 | F (3, 45) = 8.2009 | 0.001 |
| Tail length (TaL) | 124.69 ± 4.28 | 110.25 ± 6.06 | 118.67 ± 9.89 | 129.23 ± 3.65 | F (3, 46) = 0.4364 | 0.727 |
| Leg length (LHF) | 23.44 ± 0.26 | 25.63 ± 0.37 | 23.67 ± 0.60 | 25.68 ± 0.22 | F (3, 46) = 2.5723 | 0.065 |
| Ear Length (LE) | 19.44 ± 0.44 | 18.13 ± 0.62 | 21.00 ± 1.01 | 20.73 ± 0.37 | F (3, 46) = 0.1620 | 0.921 |
| Greatest length of skull (GLS) | 31.03 ± 0.53 | 31.81 ± 0.75 | 31.66 ± 1.23 | 33.45 ± 0.45 | F (3, 46) = 6.5494 | 0.008 |
| Skull height (SKH) | 8.58 ± 0.16 | 8.53 ± 0.21 | 8.30 ± 0.36 | 8.96 ± 0.13 | F (3, 47) = 2.1206 | 0.110 |
| Condylobasal length (CBL) | 29.93 ± 0.39 | 30.01 ± 0.55 | 29.72 ± 0.89 | 31.98 ± 0.33 | F (3, 45) = 7.0671 | 0.005 |
| Bullar length (BUL) | 4.39 ± 0.05 | 4.27 ± 0.07 | 4.40 ± 0.12 | 4.41 ± 0.05 | F (3, 45) = 0.8697 | 0.463 |
| Shield-bullae depth (SBD) | 1.52 ± 0.03 | 1.41 ± 0.04 | 1.32 ± 0.07 | 1.33 ± 0.02 | F (3, 45) = 8.3869 | 0.001 |
| Diastema length (DIL) | 8.58 ± 0.13 | 8.49 ± 0.19 | 8.30 ± 0.31 | 9.06 ± 0.11 | F (3, 45) = 4.3690 | 0.008 |
| Rostral height (ROH) | 5.66 ± 0.11 | 5.75 ± 0.16 | 5.89 ± 0.26 | 6.09 ± 0.10 | F (3, 45) = 3.0245 | 0.039 |
| Rostral breadth (BRR) | 5.13 ± 0.09 | 5.33 ± 0.12 | 5.06 ± 0.20 | 5.51 ± 0.07 | F (3, 45) = 4.2968 | 0.009 |
| Palatal bridge length (PBL) | 4.96 ± 0.08 | 4.76 ± 0.11 | 4.87 ± 0.18 | 5.27 ± 0.07 | F (3, 45) = 6.4797 | 0.009 |
| Postpalatal length (POL) | 4.29 ± 0.05 | 4.46 ± 0.07 | 4.15 ± 0.12 | 4.41 ± 0.04 | F (3, 46) = 2.8618 | 0.046 |
| Basioccipital length (OCL) | 23.62 ± 0.30 | 23.58 ± 0.43 | 23.29 ± 0.70 | 25.10 ± 0.26 | F (3, 45) = 6.4665 | 0.009 |
| Maxillaty toothrow length (MTL) | 4.43 ± 1.66 | 4.61 ± 2.34 | 4.20 ± 3.83 | 6.78 ± 1.41 | F (3, 45) = 0.5025 | 0.682 |
| Maxillary toothrow breadth (MTB) | 6.24 ± 0.06 | 6.21 ± 0.08 | 6.13 ± 0.13 | 6.49 ± 0.05 | F (3, 45) = 5.8606 | 0.001 |
| Postdental breadth (PDB) | 4.29 ± 0.05 | 4.43 ± 0.07 | 4.15 ± 0.11 | 4.39 ± 0.04 | F (3, 45) = 2.4416 | 0.076 |
| Zygomatic breadth (ZYB) | 14.95 ± 0.17 | 15.58 ± 0.24 | 14.78 ± 0.40 | 16.36 ± 0.15 | F (3, 45) = 14.905 | 0.001 |
| Braincase breadth (BAB) | 13.58 ± 0.08 | 13.48 ± 0.12 | 13.28 ± 0.19 | 13.67 ± 0.07 | F (3, 45) = 1.6007 | 0.202 |
| Nasal length (NAL) | 11.74 ± 0.19 | 12.79 ± 0.27 | 12.00 ± 0.45 | 12.98 ± 0.16 | F (3, 45) = 8.6659 | 0.001 |
| Interorbital breadth (IOB) | 4.93 ± 0.06 | 4.71 ± 0.08 | 4.75 ± 0.14 | 4.93 ± 0.05 | F (3, 45) = 2.2628 | 0.094 |
| Nasal breadth (NAB) | 3.36 ± 0.07 | 3.60 ± 0.09 | 3.39 ± 0.15 | 3.67 ± 0.06 | F (3, 45) = 4.6992 | 0.006 |
The specimens from Los Tuxtlas, Veracruz, were assigned to Peromyscus m. mexicanus, which has its type locality in Veracruz (10 km E Mirador Veracruz; Dalquest 1950), approximately 400 km to the northwest and associated with regions covered by tropical forests. The genetic analyses show that the sequences of the Los Tuxtlas specimens are markedly different from those in GenBank for geographic areas close to the type locality of P. mexicanus: Misantla, Veracruz (KP284422-23), Tutotepeq [Tutotepec], Hidalgo (KP284424), Puebla (KJ526415), and Zongolica, Veracruz (EF028174). For this reason, the Los Tuxtlas specimens are not considered representatives of P. m. mexicanus but of P. m. totontepecus instead.
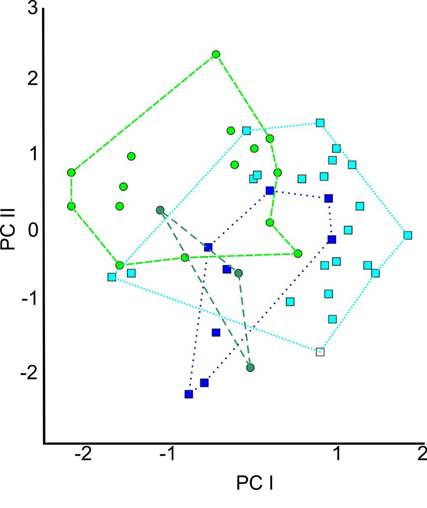
Figure 4 Plot of influences from the Principal Component Analysis (PCA) of the 19 craniodental variables. The analysis included specimens of the Peromyscus mexicanus complex from different geographic regions. P. m. angelensis (light green), P. m. putlensis (dark green), P. m. totontepecus (light blue) and P. m. Tuxtlas (dark blue).
The clades of P. m. angelensis-P. m. putlaensis and P. m. totontepecus-P. m. Tuxtlas are also phylogenetically differentiated from the other species in the mexicanus group, which clustered more closely with P. gymnotis. The P. m. angelensis-P. m. putlaensis clade had a percentage of dissimilarity of 7.54 % relative to P. mexicanus, and the P. m. totontepecus-P. m.Tuxtlas clade, of 5.98 %. These results show that both sides of the Sierra Madre del Sur of Oaxaca harbor genetically separated lineages of P. mexicanus. Genetic distances are consistent with other species in the mexicanus group (Table 1).
The biogeographical explanation of the genetic discontinuity among the three clades of P. mexicanus analyzed is that P. m. Tuxtlas is likely distributed in the SMG from the central part of Veracruz northward. In contrast, P. m. angelensis-P. m. putlaensis are distributed in various highland areas of the Pacific side in Oaxaca, between 616 and 1,569 masl, and P. m. tontotepecus, in the SMG and the coastal plains of southeastern Veracruz. In the mid-late Pleistocene, when the forests of Oaxaca originated (Watson 2003), there was a continuous habitat between both sides of the Sierra Madre del Sur, which likely favored the dispersal of Peromyscus (Pérez-Consuegra and Vázquez-Domínguez 2015, 2017). The continuity of forests was limited in the late Pleistocene by the appearance of the Central Valleys of Oaxaca, a region with lower altitudes and xeric characteristics covered with a different vegetation type (García-Mendoza et al. 2004), recorded as an environment where no species of the P. mexicanus complex are found. Consequently, the Central Valleys functioned as a physiographic barrier between the populations of both sides of the Sierra Madre del Sur, with unique biotic and abiotic conditions that fostered the discontinuity and genetic differentiation of these populations. This is reflected in the genetic discontinuity between the populations of the Sierra Madre del Sur on both slopes of Oaxaca. This is why the P. m. totontepecus-P. m. Tuxtlas clade is restricted only to the highlands of the SMG in Oaxaca and the coastal plain of southeastern Veracruz. However, this clade is present in part of western Oaxaca and the Tehuantepec area (Hernández-Canchola et al. 2022). In contrast, P. m. angelensis-P. m. putlaensis is distributed in the Pacific slope in Oaxaca.
The mexicanus group may have undergone speciation at about the same time as P. aztecus (Sullivan et al. 1997) and P. melanophrys (Castañeda-Rico et al. 2014). The local adaptation to different habitats under particular biotic and abiotic conditions (vegetation type, elevation, ecological characteristics) may have played a key role in the differentiation of the P. mexicanus lineages. This is reflected not only in the genetic information, but also in the variations in body size observed. It has been suggested that cranial variations, such as the length of the diastema and the palatal bridge in P. zarhynchus (Lorenzo et al. 2006) and the length of the mandible and mandibular toothrow of P. mexicanus (Pérez-Consuegra and Vázquez-Domínguez 2017) are indicators of differences in feeding habits (Lorenzo et al. 2006; Pérez-Consuegra and Vázquez-Domínguez 2017). The same may be happening with the specimens of the P. mexicanus complex inhabiting the Oaxaca highlands.
The genetic distance percentages recorded for the populations of P. m. angelensis, P. m.Tuxtlas, P. m. putlaensis, and P. m. totontepecus are phylogenetically closer to P. gymnotis than to P. mexicanus, although these clades have been considered subspecies of P. mexicanus based on morphological traits. The morphological variation and genetic diversity observed, compared with other species in the mexicanus complex, suggest that the P. m. angelensis and P. m. putlaensis lineages in the SMP and P. m. totontepecus and P. m. Tuxtlas of the SMG in Oaxaca and the coastal plain of southeastern Veracruz are valid taxonomic entities at the species level, which differ from P. mexicanus. For this reason, P. tontotepecus (Merriam 1898) should be recognized at the species level in the SMG, including the specimens inhabiting the coastal plain of southeastern Veracruz.
In the Sierra Madre del Sur, following the priority rule of the Nomenclature Code, it is determined that P. m. putlaensis (Goodwin 1964) should be considered a subspecies of P. angelensis (Osgood 1904).
Peromyscus angelensisOsgood 1904
Distribution. The type locality is Puerto Angel, Oaxaca. Its distribution range includes the Sierra Madre del Sur in the Pacific side highlands, from Guerrero to Oaxaca.
Comments. Morphological variations within the distribution range of P. angelensis have been recorded. These variations coincide with the taxa described previously; therefore, we consider that the specimens previously assigned to putlaensis should be considered a subspecies of P. angelensis.
Peromyscus angelensis can be distinguished from P. tontotepecus and P. mexicanus by having a dorsal and ventral paler coloration, ring spot around the eye with less contrast to the face flank, smaller somatic and cranial sizes, and a supraorbital bead slightly better developed (Osgood 1904; Musser 1969; Huckaby 1980).
Peromyscus angelensis putlaensisGoodwin 1964
Distribution. The type locality is San Vicente, Putla Municipality, Oaxaca. Its known distribution range is restricted to the high areas adjacent to Putla Villa de Guerrero.
Comments. In P. a. plutlaensis the braincase proportions are smaller in relation to P. a. angelensis with the interorbital breadth, braincase breadth and skull height smaller in relation to the rostral area.
Peromyscus totontepecus Merriam 1898
Distribution. The type locality is Tontotepec, Oaxaca. Its distribution range includes the highlands of Oaxaca and eastern Puebla. P. m. mexicanus is restricted to the Gulf of México coastal plain of Veracruz.
Comments. Peromyscus tontotepecus can be distinguished from P. mexicanus by having a dorsal and ventral darker coloration, ring spot around the eye with greater contrast to the face flank, and smaller in average in somatic and cranial measurements.

