


 nueva página del texto (beta)
 Inglés (pdf)
 Artículo en XML
 Referencias del artículo
 Enviar artículo por email
 Citado por SciELO
  Similares en
SciELO
Similares en
SciELO 
 Permalink
Introduction
No other species impacts biodiversity, community composition, and function like human beings (Tillman 1999). In the last century, human impact on Earth has increased so considerably that anthropogenic land cover change is the leading cause of biodiversity loss and the current epoch is now recognized as the Anthropocene (Ehlers and Krafft 2006). Indeed, vegetation biomass has decreased by 53 to 58 % in recent years (Erb et al. 2018) and 20 % of the planet's biodiversity has been lost (Hill et al. 2018; Díaz et al. 2019). These disturbances have greatly affected tropical ecosystems; although quantification of deforestation rates is difficult, some studies suggest that around 100 million hectares have been lost in recent years (Shimamoto et al. 2018). Approximately 332 terrestrial vertebrates have gone extinct since the 1500s, while around 25 % of vertebrate populations exhibit significant abundance declines, especially tropical birds and mammals (Dirzo et al. 2014). Overall, habitat loss is directly associated with the local extinction of large-and-medium-sized herbivorous mammals, unleashing a cascade of changes in ecosystems (Dirzo et al. 2014). The latter has a tremendous impact on forests because these species help maintain plant diversity via seed dispersal (Martínez-Ramos et al. 2016; Camargo-Sanabria et al. 2015). Moreover, herbivorous mammals also have significant anthropogenic pressure due to hunting for their meat, like the spotted paca Cuniculus paca. The spotted paca is an endemic species from America and one of the largest rodents in the world (Emmons 2016). It is distributed from southern Mexico to northern Argentina, from sea level to up to 2800 m elevation (Padilla-Gómez et al. 2019). This caviomorph frugivore is an important seed disperser, as well as prey for large carnivores (e. g., jaguar and puma; Figueroa-de León et al. 2016). Although the spotted paca is classified as Least-concern on the Red List of the International Union for Conservation of Nature (IUCN 2022), the modification and fragmentation of its habitat most likely threatens its populations; hence, it is crucial to assess its habitat status (Jax et al. 2015; Montes 2005). Correlative species distribution models are a helpful tool that allows estimating the relationship between environmental conditions and the presence of a species in the localities where it has been recorded, under the assumption that those environmental combinations where the species occurs are part of its fundamental niche, that is, where the intrinsic growth rate is positive (Franklin 2010; Soberón 2010; Falconi et al. 2021). These models have gained relevance for the conservation and monitoring of wildlife, given that they allow the identification of suitable habitats in current and climate change scenarios. Examples using species distribution models include the repopulation and reintroduction of declining or extinct species in the wild (D’Elia et al. 2015), as well as the identification of areas susceptible to invasion by exotic species, among many other applications (Jarvie and Svenning 2018; Espindola et al. 2019; Núñez-Penichet et al. 2021).
Although there have been previous attempts to estimate paca’s distribution, they did not evaluate the effect of anthropization throughout the species range (e. g., Cartaya et al. 2016; Contreras-Díaz et al. 2022). Our main objective in this study was to estimate the effect of the human footprint on the distribution of the spotted paca. We used the spatial human footprint index proposed by Venter et al. (2016), which combines different sources of human pressure including human population density, the presence of buildings, crops, induced grasslands, night lights, highways, roads, and navigable waters. By using this as a predictor in distribution models, we determined its effect on distribution and evaluated the paca’s tolerance of anthropized environments. We expected Cuniculus paca to occur in low anthropized areas across its distribution.
Materials and methods
To estimate the effect of the human footprint on the distribution of Cuniculus paca, we evaluated its importance and percentage of contribution to species distribution models. The modeling framework consisted of three stages where we first collected occurrence data and modeling layers from open data repositories. Then we built candidate distribution models using different parameterizations of the MaxEnt algorithm (Phillips et al. 2006), selecting those models that passed statistical significance, good performance tests and low complexity. Finally, using the best model, we estimated tolerance ranges to human footprint via MaxEnt's response curves and evaluated variable contribution and importance according to MaxEnt's Jackknife test.
Data collection and preparation . We obtained species occurrence data across the known distribution of the spotted paca from the Global Biodiversity Information Facility (GBIF, https://www.gbif.org/) and SpeciesLink (https://splink.cria.org.br/). We curated these data following a standard protocol summarized in Cobos et al. (2018). We eliminated fossil observations, wrongly georeferenced localities, duplicated records, and doubtful occurrences. We checked the altitude of all the records, and when they were doubtful, we contacted the data providers to verify their validity. We also removed localities with more than 100 m of uncertainty in their coordinates and to ensure better correspondence with the environmental layers used data from before 1990 were eliminated from our dataset. To avoid spatial autocorrelation, we thinned occurrences at 1 km using the ‘ntbox’ R package (Osorio et al. 2020). Finally, we randomly split curated occurrences using 70 % for training and 30% for testing the distribution models.
As modeling layers, we used the bioclimatic variables from WorldClim 2 (Fick and Hijmans 2017), the percentage of forest cover (Tuanmu and Jetz 2014), and the 2009 Global terrestrial Human Footprint map (hereafter Human Footprint; Venter et al. 2016), at a spatial resolution of ~ 1 km2. The election of bioclimatic and forest layers is based on the spotted paca's biology since this species lives in humid and forested environments (Pérez 1992; Beck-King et al. 1999; Gutierrez et al. 2017). The Human Footprint measures direct and indirect human pressures on the environment in 2009; this index ranges from 0 to 50, where 0 means natural environment and 50 high-density built environments. To select the layers to be used in the modeling process, we first removed WorldClim 2 variables 8, 9, 18, and 19 because they present abrupt discontinuities in some areas without geographic breaks (Anderson and Raza 2010; Escobar et al. 2014; Alkishe et al. 2022). Using information from the remaining layers, we estimated Spearman correlations between the environmental values associated with occurrence records and kept only those with correlations ≤ 0.6 to reduce multicollinearity. We clipped the selected layers according to the hypothesis of the accessible area for the species - also known as M - (Soberón and Peterson 2005) to avoid negative impacts of inappropriate background choices (Alkishe et al. 2022). To do this, we added a buffer of 500 km around the native range polygon of the spotted paca (Emmons 2016), which provided a hypothesis of M based on expert knowledge, with an added area likely explored via dispersal.
Calibration and selection of species distribution models. We used MaxEnt 3.4.1 (Phillips et al. 2006) as a modeling algorithm using the ‘kuenm’ R package (Cobos et al. 2019). This package allows fitting and evaluating MaxEnt models using different feature classes and regulation multipliers in an automated fashion. Assessment is done using the partial ROC test for statistical significance, omission rates for model performance, and the Akaike Information criteria for model complexity (Burnham and Anderson 2002; Warren and Seifert 2011). We fitted and evaluated 105 candidate models to select the best parameter settings from our modeling layers. The regularization multipliers assessed were: 0.1, 0.25, 0.5, 0.75, 1, 1.5, 2, 2.5, 3, 3.5, 4, 4.5, 5, 5.5, 6. We used all possible combinations of linear (l), quadratic (q), and product (p) feature classes.
For assessing the overall effect of human footprint on the distribution of the spotted paca, we evaluated its importance and contribution to the model, we performed the Jackknife test in MaxEnt for those models that were statistically significant and presented omission rates < 5% of testing data. Tolerances to human footprint were assessed by examining suitability changes in response curves of MaxEnt models.
Results
We obtained 6,420 occurrences from GBIF and 273 from Species Link. From these data, 5,450 and 32 were collected from 1990 onwards, respectively. After the data curation process, due to the elimination of wrong information and both spatial and temporal duplicates, our final data set included 417 records: 406 and 11 occurrences of GBIF and SpeciesLink, respectively.
Occurrences used in modeling are distributed along an elevation range from 2 to 2,711 m (Figure 1, panel B). However, more than 75 % of the records occur below 1,000 m. Data came from 17 countries along the species distribution (Figure 1, panel C), where Colombia and México had the most georeferenced records (> 80 % of the occurrences in our database; 274 and 64 records, respectively).
Out of 17 predictor variables, seven were the least correlated variables: human footprint, tree cover, annual mean temperature (Bio 1), mean diurnal range (Bio 2), isothermality (Bio 3), annual precipitation (Bio 12), and precipitation seasonality (Bio 15).
With the MaxEnt analyses, we obtained 105 candidate models, but only one model reached the selection criteria: statistically significant, low omission rate, and complexity. The model showed an AUC value of 0.882 ± 0.007, a regularization multiplier of 0.25, and linear, quadratic, and product features. The most contributing variables were human footprint (26.4 %), annual precipitation (21.4 %), and isothermality (19.1 %), while the least contributing variable was annual mean temperature (3.3 %; Table 1).

Figure 1 Description of the occurrences used in the modeling selection process: A. Occurrences per sampling year before the temporal and spatial thinning. B. Elevation (masl, meters above sea level) of the occurrences used in the model selection process. C. Occurrences per country used in the model selection process. Country: AR, Argentina; BR, Brazil; BZ, Belize; CO, Colombia; CR, Costa Rica; EC, Ecuador; GF, French Guiana; GT, Guatemala; GY, Guyana; HN, Honduras; MX, México; PA, Panama; PE, Perú; SR, Suriname; TT, Trinidad and Tobago; UY, Uruguay; VE, Venezuela.
Regarding the geography, the model showed the most suitable areas in different zones throughout México, Guatemala, Belize, Costa Rica, Colombia, Venezuela, Ecuador, Perú, and some regions in Brazil and Bolivia (Figure 2).
The response curves of the model variables showed varying relationships in regard to the environmental suitability for the spotted paca (Figure 3). That is, the relationship between human footprint and environmental suitability showed a normal type form, where suitability decreased at human footprint index values greater than 20. The same bell curve was found for tree cover and annual mean diurnal range (Bio 2). Regarding tree cover, suitability increased with the percentage of trees and slowly decreased at values of ~70 %. According to Bio 2, the spotted paca can be found along temperature variations of ±7; higher variations negatively affected suitability. The curve for annual precipitation accumulation (Bio 12) showed a positive relationship with suitability, while as precipitation seasonality (Bio 15, which measures variations in precipitation) increased, suitability decreased. Finally, we found a negative relationship between isothermality (Bio 3) and suitability for values < 60 and a positive relation for higher values (Figure 3). Isothermality quantifies the day-to-night temperature oscillations relative to the summer-to-winter oscillations (measured in percent). An isothermal value of 100 indicates that the daily temperature range is equivalent to the annual temperature range (O’Donnell and Ignizio 2012). Maximum suitability values for Bio 3 were found at 100, which indicates that this species prefers non-fluctuating temperatures.
Table 1 Percent contributions for individual environmental variables to the best distribution model.
| Variable | Percent contribution | Permutation importance |
|---|---|---|
| Human footprint map for 2009 (HFP2009) | 26.4 | 30.9 |
| Annual precipitation (Bio 12) | 21.4 | 29.1 |
| Isothermality (Bio 3) | 19.1 | 6.5 |
| Tree cover | 12.3 | 10.1 |
| Mean diurnal range (Bio 2) | 11.6 | 12.0 |
| Precipitation seasonality (Bio 15) | 5.9 | 5.5 |
| Annual mean temperature (Bio 1) | 3.3 | 6.0 |
Discussion
To estimate the effect of the human footprint on the distribution of the spotted paca, we used species distribution modeling and a rigorous process of model selection based on statistical significance, predictive power, and model complexity (Cobos et al. 2019). Using these criteria, we found a single model that best characterized the distribution of the species. Most occurrence records are below 1,000 m elevation (see Figure 1, panel B), as reported in previous studies (Beck-King et al. 1999; Cartaya et al. 2016); however, about 3.3 % of presences occur above 2,000 m, which agrees with recent studies in México where the species has been up to 2,800 m (Padilla-Gómez et al. 2019). Based on the theory of species distributions, we hypothesized that some of the higher altitude occurrence patterns are related to exploration activities and might not be part of its fundamental niche (Pulliam 2000; Osorio-Olvera et al. 2016). It is known that when primary productivity decreases, C. paca explores areas outside of its range in search of food and for predator avoidance (Martínez-Ceceñas et al. 2018). Also, this strategy could be a response to climate change, as it has been documented with changes in latitudinal and altitudinal distribution patterns of many species in the world (Rowe et al. 2015; Feldmeier et al. 2020; Abbas et al. 2021).
The variable that contributed the most to the models was human footprint, followed by precipitation, temperature isothermality, and tree cover. These findings are in agreement with the natural history of the spotted paca given that the last three variables are crucial for its survival (Contreras-Díaz et al. 2022). El Bizri et al. (2018) found that precipitation fluctuations match reproductive cycles where mating and conception occur in the dry season, while pregnancies and births happen in the rainy season. Our results also show that C. paca is found in environments with less seasonal variation. High annual fluctuations in temperature and precipitation can affect food availability because fruit production depends on the rainy season, which also affects tree cover (Dubost and Henry 2017). For the spotted paca, tree cover and precipitation importance cannot be underrated, as it is an herbivore that depends on water bodies for survival and reproduction (Figueroa de León et al. 2016; Contreras-Díaz et al. 2022).
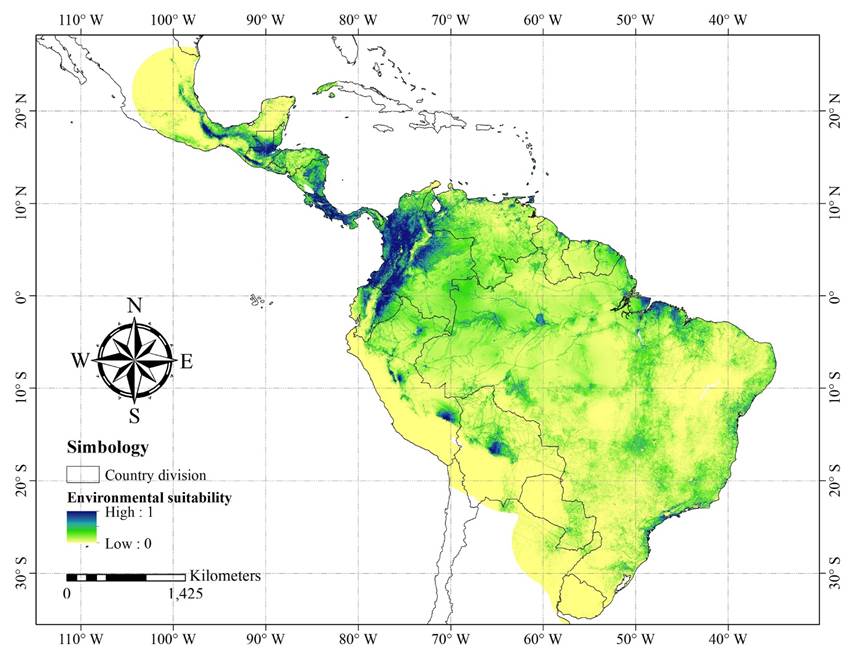
Figure 2 Species distribution model with the best performance. The MaxEnt regularization multiplier and feature type used were 0.25-linear-product-quadratic.
The contribution of the footprint variable highlighted the crucial role of anthropogenic pressures on spotted paca distribution and movement (Tucker et al. 2018). Environmental suitability increases when the human footprint index ranges from 0 to 20. A value of zero corresponds to natural areas with no human impact and values greater than 20 to highly impacted areas (Di Marco et al. 2018; Venter et al. 2016). Although the paca seems to tolerate low to medium human impacts, an exploration of the components of the human footprint index shows that this species is found in places where the human population density is on average ≤15/km2, as well as places with low pressures due to roads and pasture lands (see Supplementary Material). Our results agree with Di Marco et al. (2018), who observed that the human footprint is a fundamental predictor of the risk status for different mammal species and found that richness decreases drastically from a value of 20, which supports our conclusion that pacas tolerate a certain level of human disturbances if adequate conditions exist for its reproduction and feeding activities. Although anthropogenic disturbance has negative effects such as habitat fragmentation and roadkill risk, some benefits need to be analyzed (Parsons et al. 2018). For example, certain studies report that the spotted paca can be favored by induced vegetation and crops, because it consumes fruits of cultivated species such as mango, avocado, and citrus, among others (Gallina 1981; Zucaratto et al. 2010). Using such modified habitat may be related to seasonality and the productivity decrease in the species' environment, forcing it to disperse to areas with higher human impact (Martínez-Ceceñas et al. 2018). In addition, movement to these areas could be related to predator evasion behavior (Parsons et al. 2018). It has been hypothesized that the spotted paca is flexible in terms of its habitat preferences, where areas with a certain degree of disturbance would present lower predator densities (e. g., felines) and predation risk (Michalski and Norris 2011). It is important to highlight that the apparent tolerance of the spotted paca to medium levels of disturbance could also be linked to biases in presence data due to more intensive sampling along roads, highways, areas near towns, and protected areas. However, this does not seem to be a limiting factor in the predictive power of the distribution models (McCarthy et al. 2011). Even if the spotted paca tolerates medium ranges of anthropogenic pressure, the highest values of environmental suitability we found indicated a tree cover of ≥60 % (see Figure 3), an adequate coverage to carry out their exploration and feeding activities (Pérez 1992; Beck-King et al. 1999; Gutierrez et al. 2017).

Figure 3 Variable response curves for the best distribution model. HFP2009, human footprint; tree cover; Bio 1, annual mean temperature; Bio 2, mean diurnal range; Bio 3, isothermality; Bio 12, annual precipitation; Bio 15, precipitation seasonality.
To conclude, we must recognize that humans are the main driver of habitat loss. However, as some species are more or less adapted to these changes, it is crucial to study the mechanisms that enable wildlife species to coexist with us, describe their environmental requirements and how they respond to changes in their habitat. For example, by studying North American mammals, Hantak et al. (2021) documented that large species tend to be smaller in anthropized environments. Indeed, more studies assessing species' tolerances to human activities are needed to understand the factors determining species distributions in the Anthropocene. Furthermore, the relationship between species and their environment is not static, it is scale-dependent, and thus we need studies at local and coarse spatial resolutions at different temporal scales to better design and implement conservation strategies.

