


 nueva página del texto (beta)
 Inglés (pdf)
 Artículo en XML
 Referencias del artículo
 Enviar artículo por email
 Citado por SciELO
  Similares en
SciELO
Similares en
SciELO 
 Permalink
Introduction
Many areas are experiencing major declines in biodiversity (Polasky et al. 2007), and the establishment of protected areas is a common method used to minimize losses. However, the effectiveness of protected areas in preserving biodiversity and supporting local economies depends in part on management of lands surrounding protected areas (Brandon et al. 2017). Large carnivores are especially difficult to maintain through protected areas due to large home ranges and the negative attitudes they evoke from some communities (Kellert et al. 1996; Inskip and Zimmermann 2009; Cortina-Villar et al. 2012).
These issues are concerns with the Reserva de la Biosfera Sierra del Abra Tanchipa (RBSAT), in the state of San Luis Potosi, northeastern México, which is in a landscape dominated by agricultural and livestock production. This small (215 km2) reserve was established in 1994 as a National Protected Area for the myriad of unique flora and fauna found in this environmental link among the peaks of the Sierra Madre Oriental (SMO). There are 25 species of birds and eight species of mammals considered endangered, threatened, or with restricted distributions in RBSAT (SEMARNAT 2010, 2019; Durán-Fernández et al. 2020), including many interior species (i. e., species that require the interior of large contiguous patches of vegetation in a similar successional state ,Villard 1998, such as the elegant eagle (Spizaetus ornatus), red brocket deer (Mazama temama), and ocelot (Leopardus pardalis). However, the keystone species of the RBSAT and SMO is the jaguar (Panthera onca), and the RBSAT functions as a critical corridor in maintaining connectivity among jaguar populations in the SMO (Dueñas-López et al. 2015; Dueñas-López and Huerta-Rodríguez 2020). Ongoing studies of jaguar ecology (Rosas-Rosas et al. 2016; Silva-Caballero et al. 2022) further confirm the importance of the RBSAT landscape for this keystone large carnivore. Because of its role as a keystone carnivore, needs for large areas of minimally impacted habitat, and vulnerability to human-related mortality (Ripple et al. 2014), the jaguar is an effective management indicator species (MIS) for conservation of the RBSAT landscape, meaning that its status and trend provide insight into the overall health of the ecological system (Committee of Scientists 1999; Rosas-Rosas et al. 2020).
The highly productive valleys that border the Reserve are heavily impacted by human land use, including cattle ranching, cultivated crops, urban and rural developments, and mining operations (Dueñas-López et al. 2015; Durán-Fernández et al. 2020). The RBSAT is situated in the middle of two counties, Ciudad Valles and Tamuín, which have growing populations and robust local economies. Ciudad Valles had a 35 % increase in population from 1990 to 2015 (INEGI 2015) and is the number one producer of sugar cane in San Luis Potosí, with a production valued at $ 49 million USD in 2016 (SIAP 2017). The population of Tamuín increased 13 % from 1990 to 2015, and Tamuín leads the state in beef production with an economic impact of $ 269 million in 2016 (INEGI 2015; SIAP 2018). Cattle numbers more than doubled in Tamuín from 107,752 to 290,300, 2008 - 2016 (SIAP 2018), primarily related to feedlot production, but decreased in Ciudad Valles from 2,634 to 2,245.
Despite the ecological role of RBSAT as a biodiversity preserve, the types and rate of land use change remain unquantified around the RBSAT. Like many other areas in México, the landscape of the RBSAT is likely threatened by isolation, and land use surrounding the reserve has a major impact on its effectiveness in the conservation efforts of the SMO (Ortega-Huerta 2007; Chapa-Vargas and Monzalvo-Santos 2012; Rosas-Rosas et al. 2020). Likewise, jaguars and other sensitive wildlife move outside the boundaries of the RBSAT (Rosas-Rosas et al. 2016; Silva-Caballero et al. 2022), which highlights the need for coordinated management of the surrounding landscape to maintain viable habitat as well as decrease the likelihood of conflicts with local livestock producers and other residents of surrounding communities. Understanding the historic and current patterns of land use around RBSAT will inform strategies for future development and conservation efforts to preserve the ecological function of the Reserve and promote coexistence with its keystone species. Therefore, our goal was to document the type and rate of land use change within the RBSAT and its surrounding landscape over the last 27 years and assess how land use changes might influence efforts to conserve jaguars, one of the keystone species of the RBSAT, and thus maintain the role of the RBSAT landscape for conservation of biodiversity.
Materials and methods
Study Area. Our study area included the RBSAT and a 10 km buffer of the surrounding landscape, representing 1,080 km2 of tropical deciduous forest, secondary vegetation, agricultural and livestock production areas, rural communities, and gravel mines (Figure 1). The RBSAT is located between 22° 04’ 38”, 22° 23’ 56” N and -98° 53’ 07”, -99° 00’ 44” and contains 214 km2 of contiguous dry tropical deciduous forest, ranging in elevation from 120 to 820 masl (Arriaga et al. 2000; CONANP 2014). The climate is classified as sub-humid with summer rains from June to September, an average annual rainfall of 965 mm, and an annual average temperature of 25.7° C (CONANP 2014). The Reserve provides habitat for 420 species of plants, 259 species of birds, 56 species of mammals, 50 species of reptiles, and 17 species of amphibians (Durán-Fernández et al. 2020).
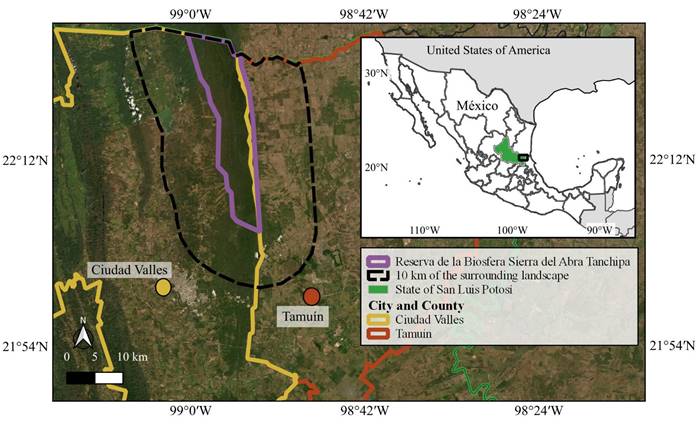
Figure 1 The study area, including the Reserva de la Biosfera Sierra del Abra Tanchipa and ten km of its surrounding landscape, and the complex matrix of land use from a satellite image captured on March 25, 2016.
Land Use Change Data. We selected satellite images used to estimate land use change based on strict criteria, including temporal availability (during the dry season) and the percentage of cloud coverage (< 10 %). These criteria emphasize the contrast between dense forest, secondary vegetation, pastures, and agriculture (most notably sugar cane, which is a crop that stays green throughout the year), facilitating the differentiation among land uses (Fichera et al. 2012; Mei et al. 2016).
We analyzed two 30-m spatial resolution satellite images, downloaded from the online platform EarthExplorer (USGS 2018). The most appropriate available images from the end of the dry season with no cloud coverage were from the Landsat 4 Thematic Mapper (TM; 7 March 1989) and Landsat 8 Operational Land Imager (OLI; 25 March 2016), which spanned a period of 27 years. We were interested in maximizing the time span as much as possible, and these images fit all criteria. We followed the methodological processing (i. e., preprocessing of the satellite images, supervised classification, and accuracy assessment; see below) of data common to analyses of land use change (e. g., Reyes-Hernández et al. 2006; Sahagún-Sánchez et al. 2011; Horvat 2013; Fernández-Landa et al. 2016; Mei et al. 2016). We used the software programs QGIS (QGIS Development Team 2018) and SAGA GIS (Conrad et al. 2015) for all analyses.
Preprocessing. Geographic, radiance, and atmospheric interference are the three components of preprocessing corrections for satellite images commonly applied before classification (Horvat 2013). Geographic corrections were not necessary for our images, as the Landsat images we used had been geo-referenced by the USGS (2015) to the Universal Transverse Mercator (UTM) projection. We corrected for radiance using the Semi-Automatic Classification Plugin for QGIS (SCP; Congedo 2018). Last, we corrected for atmospheric interference using a Dark Object Subtraction (DOS1) correction within the SCP plugin (Hadjimitsis et al. 2010). We then clipped the corrected images to the study area.
Supervised Classification. We included six classes in our supervised classification: agriculture, infrastructure, pasture, secondary vegetation, tropical deciduous forest, and water. We selected these classes based on two cartographic maps from the National Institute of Statistics Geography and Information Technology (INEGI 2018), Series I from 1985 and Series VI from 2016 (Table 1), which included 13 land use types (LUTs) within our study area.
We developed a training file based on the above classes using three data inputs (Foody 2002; Reyes-Hernández et al. 2006; Grinand et al. 2013). The first level of data was INEGI Series I and VI land use and vegetation maps. The second level were the satellite images projected in natural color (Landsat 8, bands 7 - 5 - 3; Landsat 4, bands 3 - 2 - 1) and false color composite images that highlight vegetation (Landsat 8, bands 6 - 5 - 4 and 4 - 3 - 2; Landsat 4, bands 5 - 4 - 3 and 4 - 3 - 2). These provided greater detail than the land use and vegetation maps. The third input was personal knowledge of the region provided by the authors. We used the classification algorithm K-nearest Neighbors Classification in SAGA GIS (Qian et al. 2014; Conrad et al. 2015) for our supervised classification, with the training file serving as the basis for the classification. We ran 15 iterations of the classification; after every iteration, we reviewed the classification results, and strengthened the training files in misclassified areas.
Accuracy Assessment. We used the final classifications from 1989 and 2016 and two verification files for accuracy assessment. The verification files included high-resolution (1-m; Planet Team 2017) satellite imagery from March 2016 and field surveys used to classify areas with a high level of certainty to serve as controls. We then ran the Confusion Matrix (Grid/Polygon) module in SAGA GIS (Conrad et al. 2015) for each image, which compared the classification and the verification files to assess their level of agreement. This generated the overall accuracy and kappa index values.
Land Use Trends. We ran the Confusion Matrix (Grid/Grid) module in SAGA GIS (Conrad et al. 2015) with the two classified images to calculate the land use change from 1989 to 2016. We calculated rate of change following Miranda-Aragón et al. (2013) and Sahagún-Sánchez et al. (2011) using RC = ,(A2 / A1) ^ (1 / n) - 1,, where RC = rate of change, A1 = area in the first year (ha), A2 = area in the final year (ha), and n = number of years in the analysis period. Positive percentages represent increases in area and negative percentages represent losses in area, and the larger the number, the greater the magnitude of change.
Jaguar and Land Use Change. We used jaguar movement data from an ongoing project in the SMO (Rosas-Rosas et al. 2016; Silva-Caballero et al. 2022) to analyze the relationship between land use change and occurrence of jaguars. Data was collected from two male jaguars in 2016 and 2017 fitted with GPS collars (VECTRONIC Aerospace GmbH; Rosas-Rosas et al. 2016). We used 100 randomly selected GPS records within the study area from each jaguar and assigned a land use class to each record using the plugin Add Grid Values to Points in SAGA GIS (Conrad et al. 2015). We then calculated the percentage of records within each class.
To address the potential effects of land use change on jaguars, we compared the location points with a transition change map that described how each pixel shifted in its land use from 1989 to 2016. We used the Chi-square goodness of fit test and Bonferroni simultaneous confidence intervals to test whether jaguar records were random or if they were associated with certain land use classes (Neu et al. 1974; Byers et al. 1984). We excluded water as a potential land use type in the analysis due to its small percentage of surface area.
Table 1 Original categories of land use types (LUTs) from INEGI Series I and VI, and the six classes established for use in this study.
| Land Use Class/Included LUTs | I | VI |
|---|---|---|
| Agriculture | ||
| Semi-permanent irrigated agriculture | X | |
| Seasonal agriculture | X | |
| Annual and semi-permanent seasonal agriculture | X | |
| Semi-permanent seasonal agriculture | X | |
| Seasonal agricultura | X | |
| Infrastructure | ||
| Urban zone | X | |
| Water | ||
| Bodies of water | X | X |
| Pasture | ||
| Permanent cultivated pasture | X | X |
| Managed pasture (native species) | X | X |
| Tropical Deciduous Forest | ||
| Tropical deciduous forest | X | X |
| Secondary Vegetation | ||
| Marsh | X | |
| Tropical deciduous forest - secondary arboreal vegetation | X | X |
| Tropical deciduous forest - secondary shrub vegetation | X | X |
| Excluded | ||
| Lacking vegetation | X |
Results
Accuracies of the classifications were 91 % for both 1989 and 2016. Kappa values were 83 % for 1989 and 84 % for 2016; kappa values of 81 % - 100 % indicate an almost perfect level of agreement (Landis and Koch 1977). From 1989 to 2016 the RBSAT landscape shifted from a more contiguous landscape towards greater heterogeneity and fragmentation (Figure 2). The largest increases were seen in infrastructure (+6.0 %) and intensive agriculture (+5.5 %), while the largest decreases were seen in pasture (-5.7 %), tropical deciduous forest (-3.0 %), and secondary vegetation (-2.7 %); the latter was the most common cover class, comprising 34.8 % of the landscape in 1989 and 32.1 % in 2016 (Table 2). The greatest rates of annual change were seen in infrastructure and agriculture (+4.5 % and +2.3 %, respectively), while pasture (-0.9 %) showed the greatest rate of annual loss.
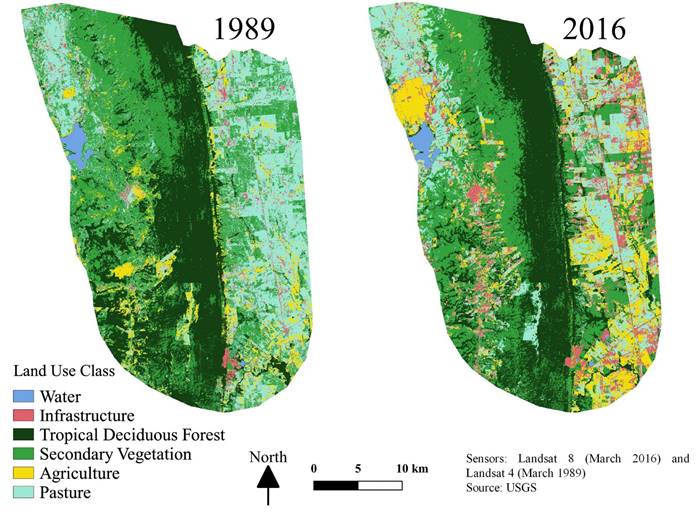
Figure 2 Land use classes of the RBSAT and ten km of the surrounding landscape from 1989 and 2016 analyzed using satellite imagery.
Table 2 Totals and change in area in hectares (ha) and percent (%) measured by the classification of satellite imagery from 1989 and 2016.
| 1989 | 2016 | Change 1989 to 2016 | |||||
|---|---|---|---|---|---|---|---|
| Ha | % | ha | % | Ha | % | % change/year | |
| Water | 1,180 | 1.1 | 1,215 | 1.1 | +35 | 0.0 | 0.1 |
| Infrastructure | 2,858 | 2.6 | 9,330 | 8.6 | +6,472 | 6.0 | 4.5 |
| TDF | 31,931 | 29.6 | 28.640 | 26.5 | -3,291 | -3.0 | -0.4 |
| Secondary veg | 37,599 | 34.8 | 34,631 | 32.1 | -2,968 | -2.7 | -0.3 |
| Agriculture | 6,843 | 6.3 | 12,778 | 11.8 | +5,935 | 5.5 | 2.3 |
| Pasture | 27,610 | 25.6 | 21,428 | 19.8 | -6,182 | -5.7 | -0.9 |
Notable results in the change matrix included 20,463 ha (19.1 %) of tropical deciduous forest that remained unchanged, the majority of which was located in the RBSAT, in which 21,464 ha was protected (Table 3). Similarly, 17,364 ha of secondary vegetation were conserved (16.2 %). Since 1989, pasture conversions included 5,661 ha to intensive agriculture, 5,692 ha to secondary vegetation, and 4,208 ha to infrastructure. Infrastructure, tropical deciduous forest, secondary vegetation, and pasture all transitioned to water, but only accounted for 0.2 % of the total area.
Table 3 Confusion matrix of land use changes in area (%) from 1989 to 2016. Unchanged land use are in *. Retrogressive land use change is italicized.
| Land use classes from 2016 imagery | |||||||
|---|---|---|---|---|---|---|---|
| Land use | Water | Infrastructure | Tropical forest | Secondary veg | Agriculture | Pasture | Total (1989) |
| Water | 0.90 % * | 0.04 % | 0.02 % | 0.07 % | 0.03 % | 0.05 % | 1.10 % |
| Infrastructure | 0.01 % | 0.8 3% * | 0.09 % | 0.32 % | 0.48 % | 0.94 % | 2.67 % |
| TDF | 0.05 % | 0.43 % | 19.14 % * | 8.31 % | 0.84 % | 0.78 % | 29.54 % |
| Secondary Veg | 0.09 % | 2.81 % | 5.21 % | 16.24 % * | 3.55 % | 6.84 % | 34.73 % |
| Agriculture | 0.02 % | 0.65 % | 0.94 % | 1.70 % | 1.69 % * | 1.38 % | 6.38 % |
| Pasture | 0.07 % | 3.94 % | 1.13 % | 5.32 % | 5.29 % | 9.82 % * | 25.57 % |
| Total (2016) | 1.14 % | 8.69 % | 26.52 % | 31.96 % | 11.88 % | 19.82 % |
Expected distribution of jaguars based on the spatial availability of each land use class differed significantly from actual locations of jaguars (χ2 4 = 121.7, P < 0.001). Bonferroni CIs indicated that jaguars were found proportionately more than expected in secondary vegetation (66 % ,57 to 81 %, of locations v. 32 % expected) and were located in tropical deciduous forest (26 % ,13 to 35 %, of locations v. 27 % expected) according to its availability. Few locations were in infrastructure (3 % ,1 to 7 %, of locations v. 9 % expected), agriculture (4 % ,2 to 5 %, of locations v. 12 % expected), and pasture (2 % ,1 to 7 %, of locations v. 20 % expected). While the majority of tropical deciduous forest and other land use types were conserved from 1989 to 2016 within the RBSAT, only 23 % of jaguar locations fell within the boundaries of the RBSAT. In contrast, jaguars were comparably located in areas of stable (i. e., unchanged) secondary vegetation (22 to 38 % of locations) as well as in secondary vegetation that had previously been tropical deciduous forest in 1989 (25 %) and in secondary vegetation that had been pasture in 1989 (38 %).
Discussion
The RBSAT and surrounding landscape changed considerably over the previous ca. 30 years, becoming increasingly fragmented and impacted by human use, particularly intensive agriculture and urbanization (Tables 2 and 3; Figure 2). Based on the accuracies of our supervised land use classification, these changes were real rather than artifacts of selected land use data inputs. Classifications showed high accuracy (91 % for 1989 and 2016), and kappa values (83 % for 1989 and 84 % for 2016) indicated an almost perfect level of agreement (i. e., > 81 %; Landis and Koch 1977). Our values were also similar or superior to previous classifications performed in México at the state level. For example, Chapa-Vargas and Monzalvo-Santos (2012) obtained a 72 % overall accuracy and 69 % Kappa in San Luis Potosí; Porter-Bolland et al. (2007) obtained an 87 % overall accuracy in Campeche; and Currit (2005) obtained an 86 % overall accuracy and 85 % Kappa in Chihuahua. At the national level, Velázquez et al. (2010) obtained a 71 % overall accuracy of a classification of México. Thus, our mapping accurately classified the changing land use of the RBSAT landscape.
The increases in infrastructure and intensive agriculture and the decrease in pasture reflected a regional trend of shifting from less intensive cattle ranching towards intensive agriculture, specifically production of sugar cane and citrus (SIAP 2017). The increase in infrastructure reflected the development of commercial and residential infrastructure as a consequence of significant population growth in both Ciudad Valles (increase of 35 %) and Tamuín (increase of 14 %) from 1990 to 2015 (INEGI 2015). These trends follow a national and state-level trend of increasing fragmentation driven by anthropogenic modifications (Mas et al. 2009; Velázquez et al. 2010). For example, Miranda-Aragón et al. (2013) identified high rates of change in San Luis Potosí towards seasonal agriculture (+1.1 %) and irrigated agriculture (+4.8 %) between 1993 and 2007, similar to the annual rate of change (+2.3 %) to all forms of intensive agriculture combined that we observed from 1989 to 2016. Concurrently, less intensive agricultural uses declined, as reflected in the decrease in cover of pastures during our evaluation period. Despite the decrease in pasture, however, cattle production and associated activities are still common and economically significant in the RBSAT landscape, especially in Tamuín (Silva-Caballero et al. 2022).
These and other (e. g., the loss of tropical deciduous forest and secondary vegetation) land use trends in the RBSAT landscape could compromise the ecological role of the reserve. Increasing fragmentation of the immediate surrounding landscape decreases habitat quantity and quality for interior-dependent species such as the elegant eagle and ocelot, thus decreasing the effectiveness of the overall RBSAT landscape as a biodiversity reserve. Loss, or decreases in the size of, large patches that support interior species can affect biodiversity by negatively impacting populations of interior species (Villard 1998), as well as increasing vulnerability to humans and other human-associated threats (e. g., domestic cats and dogs; Doherty et al. 2016). Conversely, edge-dependent species, which include many of the key prey species of jaguars (Escamilla et al. 2000; Ávila-Nájera et al. 2011; Silva-Caballero et al. 2022), are benefitted by these changes in land use and increasing fragmentation of the RBSAT landscape, likely resulting in increased abundance, particularly outside of the RBSAT boundary. Consequently, most kill sites of livestock (and natural prey) by jaguars were outside the RBSAT boundary (Silva-Caballero 2019; Silva-Caballero et al. 2022).
These changes increase the likelihood of conflicts between jaguars and humans (Rosas-Rosas et al. 2015; Guerrero-Rodríguez et al. 2020), as only 23 % of jaguar locations were within the boundary of the RBSAT and jaguars were primarily associated with secondary vegetation, which is decreasing within the RBSAT itself. Better habitat quality for jaguars and their prey outside of the RBSAT boundary facilitates potential conflicts with humans. For example, livestock comprised 66 % of the biomass in jaguar diets in the RBSAT landscape, with all depredation occurring outside the RBSAT boundary (Silva-Caballero 2019; Silva-Caballero et al. 2022).
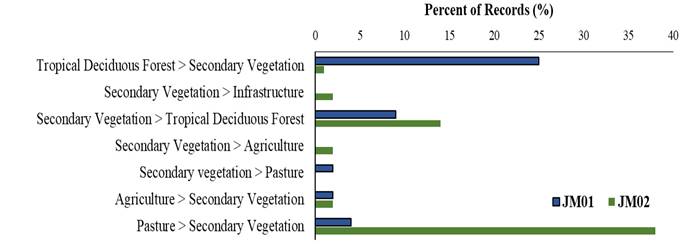
Secondary vegetation can result from abandonment of pastures or agricultural fields, and thinning or other alterations of tropical deciduous forest (Table 3; Wandelli and Fearnside 2015). Significantly, jaguars were frequently located in secondary vegetation that had transitioned from pasture and tropical deciduous forest in the RBSAT landscape (primarily outside the RBSAT border; Figure 3) in addition to their use of secondary vegetation that remained unchanged from 1989 to 2016. The apparent preference and use of secondary vegetation outside of the RBSAT boundary by jaguars in association with the preponderance of livestock in jaguar diets (Silva-Caballero et al. 2022) emphasizes the need to include local stakeholders in the greater RBSAT landscape in conservation efforts, including secondary vegetation.
Moreover, the expansion of intensive agriculture, increases in habitat edge due to fragmentation, and continued importance of livestock production and associated improvements (especially water) may attract prey species to, or increase their populations in, these land uses (Rosas-Rosas et al. 2020; Silva-Caballero et al. 2022). For example, Escamilla et al. (2000) and Ávila-Nájera et al. (2011) found that collared peccary (Pecari tajacu), white-tailed deer (Odocoileus virginianus), and white-nosed coati (Nasua narica), important prey species for jaguars in the RBSAT (Hernández-SaintMartín et al. 2015; Silva-Caballero 2019; Silva-Caballero et al. 2022, preferentially used mosaics of tropical deciduous forest, agriculture, and livestock pasture. Consequently, so did jaguars and pumas (Puma concolor; Escamilla et al. 2000; Hernández-SaintMartín et al. 2015). Further, the RBSAT lacks permanent water sources (Hernández-SaintMartín et al. 2013; Silva-Caballero et al. 2022). Consequently, wildlife, including jaguars and their prey, seek water outside of the boundaries of the Reserve during the dry season (Hernández-SaintMartín et al. 2013), which increases the vulnerability of livestock and natural prey to predation (Silva-Caballero et al. 2022). Water developments are most common in livestock enterprises, intensive agriculture (irrigation), and human developed (e. g., residential, etc.) areas, where presence of jaguars frequently results in serious conflicts (Guerrero-Rodríguez et al. 2020; Silva-Caballero et al. 2022).
The rapid increases in infrastructure, intensive agriculture, and habitat fragmentation have and will continue to dramatically change the RBSAT landscape, and thus affect the wildlife that utilize the landscape. Managers and stakeholders need to seek approaches that account for the response of resident wildlife including interior-dependent species and jaguars, mitigate conflicts, and protect the economic viability of adjacent communities (Olvera-Hernández et al. 2020; Silva-Caballero et al. 2022). Minimization of loss of tropical deciduous forest and other large habitat patches in the RBSAT itself is likely the only practical means of minimizing loss of biodiversity in the RBSAT landscape, especially for interior-dependent species given the already significant fragmentation in the surrounding landscape. Characteristics associated with human-jaguar conflict areas (especially with livestock) include proximity to a protected area and seasonal availability of water (Rosas-Rosas et al. 2010; Peña-Mondragón and Castillo 2013; Alfaro et al. 2016; Silva-Caballero et al. 2022). Both of these are present in the RBSAT landscape, as are associated livestock depredation conflicts (Silva-Caballero et al. 2022), and are likely to become more prevalent given the changes in land use away from natural vegetation towards intensive agricultural and infrastructure development. The combination of a decrease in preferred jaguar habitat within the RBSAT and likely increases in preferred prey outside of the RBSAT as a consequence of increasing fragmentation, intensive agriculture, and permanent water infrastructure, will likely lead to in increased conflicts between humans and jaguars (Rosas-Rosas et al. 2010; Guerrero-Rodríguez et al. 2020; Peña-Mondragón and Castillo 2013; Alfaro et al. 2016; Silva-Caballero et al. 2022).
Conservation of the RBSAT landscape is thus dependent upon a mutually beneficial relationship between the objectives of the Reserve and the economic viability of adjacent communities, necessitating management strategies that reflect the interests of both entities. The trends in land use in the RBSAT landscape towards increasingly fragmented intensive agricultural and infrastructure development are likely to decrease the ecological values of the Reserve (i. e., biodiversity, habitat linkage, jaguar conservation because of increased conflicts and illegal killing) and increase conflicts between adjacent landowners and wildlife, including large carnivores (because even perceived conflicts with large carnivores can facilitate intolerance; Rosas-Rosas et al. 2015). This outcome, unless changed, results in a loss for both the RBSAT and surrounding communities. Stakeholder driven adaptable land use planning and management based upon the necessity and expectation of shared use that is advantageous for both communities and the Reserve is necessary to minimize both the future loss of ecological values and potential human-wildlife conflicts (Rosas-Rosas et al. 2015, 2020). However, adaptive management requires structured monitoring and a willingness to change methods and alter tactics depending on the feedback and results (Williams 2011). Consequently, working with members of the community on site-specific conservation strategies is critical to maintain or enhance the ecological role of the RBSAT and its surrounding landscape.

