SciELO - Scientific Electronic Library Online

 
vol.13 número2Effect of anthropogenic noise on the echolocation pulses of the bats Molossus sinaloae and Mormoops megalophylla índice de autoresíndice de materiabúsqueda de artículos
Home Pagelista alfabética de revistas  

Servicios Personalizados

Revista

Articulo

Indicadores

Links relacionados

  • No hay artículos similaresSimilares en SciELO

Compartir


Therya

versión On-line ISSN 2007-3364

Therya vol.13 no.2 La Paz may. 2022  Epub 21-Nov-2022

https://doi.org/10.12933/therya-22-2103 

Articles

Evaluation of the distribution pattern on a Neotropical microcarnivora

Rodolfo Rodríguez-Ruiz1 

Alejandro Juárez-Agis1  * 

Silberio García Sánchez1 

Branly Oliver Salome1 

Víctor Hugo Reza Galicia2 

1 Universidad Autónoma de Guerrero, Escuela Superior de Ciencias Ambientales, Área de Recursos Naturales. Campus Llano Largo. Carretera Cayaco- Puerto Marques s/n, C. P. 39906. Acapulco de Juárez, Guerrero, México. Email: rr9155364@gmail.com (RR-R); (AJ-A); silberio_garcia134@hotmail.com (SGS); branlyos@gmail.com (BOS).

2 Benemérita Universidad Autónoma de Puebla, edificio Valsequillo 1, Km 1.7, carretera a San Baltazar Tétela, C. P. 72960. San Pedro Zacachimalpa, Puebla, México. Email: vhreza.galicia@gmail.com (VHRG).


Abstract:

The Pacific region, one of the most disturbed areas in México, is home to the pygmy spotted skunk (Spilogale pygmaea), a local endemic species and one of the smallest carnivores in the world. This small carnivore is currently listed as a species subjected to special protection in México and the International Union for Conservation of Nature. The objective of this work was to model environmental suitability and estimate the potential distribution of S. pygmaea in México. Predictive models were created using climatic, anthropic, and topographic variables with the Maxent tool. Models were assessed through partial Receiver Operating Characteristic (ROC) performance by omission rate and AUC. Finally, land use within the predicted potential area (potential distribution) was analyzed using the 2015 land cover layer of México issued by CONABIO. According to the model, S. pygmaea has a potential distribution from southern Sinaloa to Chiapas, comprising Michoacán and Guerrero towards the Balsas River basin in relation to dry forests. The predicted area was 95,600 ± 0.02 km2, representing a restricted distribution in México. Many localities have low environmental suitability (<0.4) and ecosystem modification and fragmentation, mainly influenced by livestock density. Spilogale pygmaea may be considered rare due to the lack of sampling, which jeopardizes the conservation of this group given its fragmented habitat. Additionally, S. pygmaea is attracted to areas with human settlements, potentially leading to human-animal conflicts. Natural areas, along with information sharing on the presence and importance of the species in nearby communities, may be an effective strategy to benefit this small carnivore.

Keywords: Conservation; carnivores; endemic; potential distribution; Mephitidae; Spilogale pygmaea

Resumen:

La región del Pacífico es una de las zonas más perturbadas de México y área de distribución del zorrillo pigmeo (Spilogale pygmaea) una especie endémica de esta región y uno de los carnívoros de menor tamaño del mundo. Actualmente, este pequeño carnívoro se encuentra en un estatus de protección especial en México y por la International Union for Conservation of Nature. El objetivo de este trabajo fue modelar la idoneidad ambiental y estimar la distribución potencial de S. pygmaea en México. Se generaron modelos predictivos utilizando variables climáticas, antrópicas y topográficas desde la herramienta Maxent. Los modelos se evaluaron según la ROC parcial, el rendimiento midiendo la tasa de omisión y el AUC. Por último, se realizó un análisis de uso de suelo dentro del área potencial predicha (distribución potencial), para esto, se utilizó la capa de cobertura de suelo de México para el 2015 de CONABIO. De acuerdo al modelo de distribución potencial, S. pygmaea se puede distribuir desde el sur de Sinaloa hasta Chiapas y entrar por Michoacán y Guerrero hacia la Cuenca del Balsas en torno a las selvas secas en el país, con un área predicha de 95,600 ± 0.02 km2, presentando una distribución restringida en el país. Muchas localidades presentan una baja idoneidad ambiental (< 0.4) y algunas zonas presentan alteración y fragmentación de los ecosistemas, lo cual es principalmente influenciado por la densidad de ganado. Spilogale pygmaea se ha considerado como poco común en su distribución, sin embargo, esto pudiera estar influenciado por la falta de muestreos, lo cual puede representar un problema para la conservación de esta especie, ya que su hábitat se encuentra fragmentado. Por otro lado, S. pygmaea se ve influenciado positivamente hacia las zonas pobladas, lo cual puede generar conflicto humano-animal. Las áreas naturales en conjunto con la divulgación sobre la presencia e importancia de la especie en las comunidades cercanas pueden ser una estrategia que beneficie a este pequeño carnívoro.

Introduction

The pygmy spotted skunk, Spilogale pygmaea, is one of the smallest carnivores in the family Mephitidae and the genus Spilogale (Medellín et al. 1998; Wilson and Reeder 2005). This species is endemic to México, and its distribution has been reported from southern Sinaloa to the Pacific coast of the state of Oaxaca (Medellín et al. 1998), from sea level to 1,630 masl (Ceballos and Miranda 2000), mainly in deciduous forests (Cantú-Salazar et al. 2009; Domínguez-Castellanos and González 2011). It is considered a rare species throughout its distribution range (Medellín et al. 1998).

This small skunk belongs to the carnivore guild (Dragoo et al. 1993; Wilson and Reeder 2005), but also consumes a great diversity of insects and fruits, depending on food availability (Cantú-Salazar et al. 2005). Thus, it plays a key role within its environment, acting as a pest controller and an efficient seed disperser (Medellín et al. 1998).

In México, habitat fragmentation and loss (Sarukhan 2008) threaten this small carnivore. The main disturbances affecting the distribution of this species include urbanization, agriculture, livestock, and forest fires, all of which are common in the Pacific Coast (Trejo 2005; Ceballos et al. 2010; Botello et al. 2015; Mas et al. 2017). These issues can fragment natural populations and reduce connectivity between them (Tlapaya and Gallina 2010; Capdevila-Argüelles et al. 2013), which may lead to the loss of S. pygmaea populations in some localities.

S. pygmaea is currently listed as a species subject to special protection in NOM-059-SEMARNAT 2010 and as vulnerable by the International Union for Conservation of Nature (Helgen et al. 2016). Given the anthropic modifications in its environment, it is important to know the potential distribution and the impact of anthropic pressures on an endemic species such as S. pygmaea. However, for rare species, understanding the distribution and drivers of these patterns is challenging and resource-intensive (Perkins-Taylor and Frey 2020).

Environmental suitability and potential distribution models support inferences about the distribution of species (Austin 2002; Pérez-Irineo et al. 2019) from biological and environmental information (Guisan and Zimmermann 2000; Franklin 2010). These techniques are based on modeling the niche of a species in an n-dimensional space (Elith et al. 2006; Soberón et al. 2017), identifying the environmental requirements of the species (Soberón and Nakamura 2009) and visualizing them on maps to identify potential regions where these species may be distributed (Lindenmayer et al. 1991). The hypotheses derived from these models usually estimate the potential distribution in a predicted area or environmental suitability ranges (Soberón and Peterson 2005). These results can be an important support for species conservation strategies (Mercado and Wallace 2010; Cuervo-Robayo and Monroy-Vilchis 2012; Carrillo-Reyna et al. 2015).

Assessing the potential distribution of species in the Anthropocene is essential considering the current loss of biodiversity and habitats. This information may support the development of conservation strategies at local and national levels. The objective of this work was to model environmental suitability and estimate the potential distribution of S. pygmaea in México based on presence records and scenopoetic and interactive variables.

Materials and methods

To build environmental suitability models, a region of interest was delineated based on the area accessible to the species (Soberón and Peterson 2005; Peterson et al. 2011), using the classification of Biogeographic Regions of México issued by CONABIO (1997). The Pacific Coast, Balsas Depression, and Sierra Madre del Sur were considered as these are the layers that match the known distribution of the species (González and Arroyo-Cabrales 2012).

The model was built using data collected based on georeferenced records from publications, theses, and museum data (Cortés-Marcial and Briones-Salas 2014; Buenrostro-Silva et al. 2015; Urrea-Galeano et al. 2016; Juárez-Agis et al. 2020; Briseño-Hernández and Naranjo 2021). We also consulted presence records collected by Ballesteros-Barrera et al. (2016) and Lavariega and Briones-Salas (2019; available at: www.conabio.gob.mx/informacion/gis/). Private presence data were gathered from users of the NaturaLista platform. The data not provided were considered for model assessment only because they are shown as a random point within an area of ±20 km2 for species at risk.

The records were refined by removing spatially correlated and duplicate records. The SDMToolbox space tool was used in ArcMap® 10.3 (Brown 2014). Records were discarded at a minimum distance of 1.2 km (approximately equivalent to the size of a pixel), resulting in 76 presence records.

Variables were selected according to their importance and influence on the species (Buenrostro-Silva et al. 2015). The climatic layers by Cuervo-Robayo et al. (2013) were considered environmental variables. Only the distance to water bodies was included as a topographic variable. Vegetation attributes included distance to deciduous forest or grassland (secondary and natural) and percentage of tree cover; the anthropogenic attributes considered were distance to urban and agricultural areas and livestock density (Appendix 1).

The distance variables were estimated using the National Forest Inventory, Series VI (INEGI 2016). Polygons were divided according to the attribute, and the Euclidean distance was calculated for each polygon. Once all the geodata were obtained, the resolution of variables was adjusted based on climatic variables, resulting in an approximate size of 800 m2.

The importance of the variables to the model was assessed by a jackknife analysis in Maxent and by Pearson's correlation between variables through the Ntbox package (Osorio-Olvera et al. 2020) in Rstudio; those with a ratio >0.7 were discarded, identifying the variable with the highest percent contribution to the model and then removing the variable correlated with it (Warren et al. 2014; Perkins-Taylor and Frey 2020). The result was a set of seven climatic variables, three vegetation and anthropic variables, and one topographic variable (Appendix 1).

Figure 1 Potential distribution of S. pygmaea and presence records used in the model. 

Models were built using the MaxEnt algorithm (Phillips et al. 2017), which has shown a good performance in predicting the potential distribution of species from presence records and environmental variables (Elith et al. 2006; Phillips et al. 2006). In addition, MaxEnt is an effective tool when limited data are available (Byeon et al. 2018), as in the case of S. pygmaea.

Potential models were built using 70 % (n = 53) and assessed using 30 % (n = 23) of records. We tested 29 possible combinations of entity classes including linear, quadratic, product, threshold, and hinge, which allow adjusting simple interactions (Elith et al. 2011). Models were evaluated according to their statistical significance. The area under the curve (AUC) was obtained directly from the model assessment through the “Receiver Operating Characteristic” (ROC) curve, which measures sensitivity and specificity; values closest to 1 indicate perfect discrimination (Byeon et al. 2018). The Partial ROC (Peterson et al. 2008) was determined by resampling 1,000 boostrap interactions using 50 % of the independent data from presence records, and setting a 5 % omission error with the Ntbox platform (Osorio-Olvera et al. 2020).

The simplest model was selected, considering as reliable AUC values above 0.75 (Elith et al. 2011) and Partial ROC >1 (Peterson et al. 2008). The model selected was exported with a logistic output, which offers an interpretation associated with environmental suitability (Mateo et al. 2011).

A cutoff threshold was applied to estimate the potential distribution, evaluate the predicted area, and exclude false positives, using 70 % of the records used to build the model. The minimum value was selected as cutoff level (Pearson et al. 2007; Espinoza-García et al. 2014).

A land-use analysis was performed within the predicted potential area using the 2015 land-cover layer of México (CONABIO 2020). First, the land-use layer was trimmed based on the potential distribution. Subsequently, land-use attributes were sorted into three categories: conserved vegetation (deciduous forest, mixed forest, temperate forest), agricultural areas, and urban zones. Finally, the area occupied by each category was calculated.

The results were interpreted and discussed by overlapping the final maps on the layer of México (INEGI 2019), to facilitate the state conservation policy.

Results

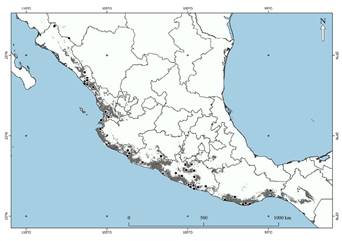
The states with the largest number of records were Jalisco (n = 17) and Guerrero (n = 28), both with 57.8 % of the data (Figure 1). The records were obtained mainly from scientific collections in museums (n = 54) and the rest from the NaturaLista platform (n = 16) and paper reports (n = 6). New localities were reported in Michoacán (Urrea-Galeano et al. 2016) and the most southern record in Juchitán, Oaxaca (Cortés-Marcial and Briones-Salas 2014).

The optimal model selected was created from three class types (hinge, linear, and quadratic). Its evaluation showed optimal AUC (0.89) and partial ROC (1.59 ± 0.14) values; random AUC and partial AUC values were statistically different (P < 0.0001).

The variables with the greatest contribution to the model were distance to water bodies (31.3 %), maximum temperature of the warmest month (14.0 %), and precipitation of the driest month (12.8 %), which together explain 58.1 % of the model. The influence observed showed a positive relationship with water bodies and a negative relationship with temperatures of the warmest month >35 °C and with areas with precipitation of the driest month >5 mm (Table 1).

Table 1 Percent contribution of the variables in the environmental suitability model for S. pygmaea. 

Variable Percent contribution (%) Importance of permutation (%)
Distance to water bodies 31.3 26.3
Maximum temperature of the warmest month 14.0 20.9
Precipitation of the driest month 12.8 15.0
Precipitation of the wettest month 9.0 17.7
Livestock density 8.4 2.7
Average day range 6.9 0
Distance to deciduous forests 6.3 0.6
Percentage of tree cover 3.1 4.5
Minimum temperature of the coldest month 2.0 0.9
Distance to grasslands 1.9 1.0
Distance to urban areas 1.5 0.5
Annual mean precipitation 1.3 6.8
Isothermality 0.7 2.2
Distance to agricultural land 0.7 0.8

In the case of anthropic variables, a positive influence was observed with agricultural areas and the periphery of urban zones (Table 1). However, livestock density responded negatively, affecting the presence of the species.

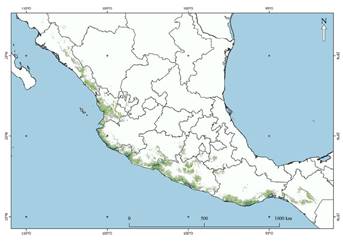
The data analysis revealed that S. pygmaea prefers areas adjacent to rivers and lagoons, limiting its distribution to livestock areas. It is associated with subhumid warm climates with the temperatore of the warmest month between 19 °C and 32 °C, and avoids areas with high precipitation. The environmental suitability map indicated that the areas of greatest suitability (>0.4) are located around the Huatulco and Lagunas de Chacahua National Parks, Oaxaca; in areas surrounding Acapulco de Juarez, Guerrero; adjacent to the Balsas basin between Michoacán and Guerrero, where it penetrates inland to the mid Balsas, Guerrero, restrained by extreme temperatures (>35 °C). In Colima, its potential distribution ranges from the Malaque tropical forest along the coast of Jalisco to the deciduous tropical forest surrounding Puerto Vallarta, the tropical forests in Nayarit, and the Meseta de Cacaxtla Natural Protected Area in Sinaloa (Figure 2).

The optimal threshold for this model was 0.2, with a potential distribution of approximately 95,600 ± 0.02 km2, comprising 4.9 % of the mainland area of México (INEGI 2018). The states with the largest potential distribution area are Michoacán (45,300 ± 0.05 km2), Guerrero (30,000 ± 0.1 km2), and Jalisco (26,500 ± 0.1 km2).

However, regarding the conserved habitat alone (i. e., forests and tropical forests within the potential distribution range) comprises 60,900 ± 0.03 km2, representing a loss of 34,700 ± 0.02 km2 (agricultural area = 34,500 ± 0.2 km2; urban area = 260 ± 2.3 km2) as a result of anthropic fragmentation.

Discussion

Historically, Spilogale pygmaea has been considered an uncommon species across its distribution range (Medellín et al. 1998). This perception might be due to the lack of sampling since reports are scarce. It is worth highlighting that the reports found are new localities for Michoacán (Charre-Medellín 2012; Urrea-Galeano et al. 2016), Oaxaca (Cortés-Marcial and Briones-Salas 2014), and Guerrero (Briseño-Hernández and Naranjo 2021); however, the interest and focus of these studies was on larger mammals. Based on our results, S. pygmaea may be distributed up to Chiapas in the south and through the Balsas River basin up to to Morelos and Puebla.

The records obtained on the citizen science platforms provide a useful tool when there is insufficient information on the species to conduct an analysis like the one reported herein. However, these data should be used with caution (in model assessment) as there may be uncertainty in localities or species identification. Therefore, data should be refined based on specialized literature. Historical bases of museums or in the literature are considered reliable sources, keeping in mind that environmental and land-use changes may be unsuitable for some species, thus affecting the development of conservation strategies (Pliscoff and Fuentes-Castillo 2011; Espinoza-García et al. 2014).

Figure 2 Environmental suitability of S. pygmaea in México. 

According to our results, much of the area predicted as potentially suitable provides an unfavorable scenario for S. pygmaea (Balvanera et al. 2000; Crooks 2002; Botello et al. 2015) since it involves fragmented zones, which could hamper the conservation of the species (Cantú-Salazar et al. 2005). Land-use change and livestock raising have a negative impact on colonization between patches (Lira-Torres and Briones-Salas 2011). Although the distribution of this small carnivore is influenced by its affinity to disturbed areas, this does not indicate that the species thrives or remains in these areas since habitat modifications or reduction have adverse effects on its permanence and distribution patterns. In the case of species with a restricted range, distribution patterns may be influenced by anthropogenic effects (McDonald et al. 2018; Perkins-Taylor and Frey 2020). An aspect not addressed in this study but that is also a consequence of anthropic activities is the pollution of water bodies. Today, this issue is on the rise (Rodríguez et al. 2013), and although the water requirement of the pygmy spotted skunk may be lower relative to other mammals, this resource is vital (Charre-Medellín 2012) and may affect its populations.

Spilogale pygmaea has a varied diet (Cantú-Salazar et al. 2005), nocturnal habits (Sánchez-Cordero and Martínez-Meyer 2000), and the ability to move across patches (Nupp and Swihart 2000; Gehring and Swihart 2004). These habits could reduce the risk of conflicts with humans in semi-urban and agricultural areas, increasing its chances of survival. However, although S. pygmaea may potentially be found in areas of low environmental suitability, ignorance about this species might lead to interactions and problems with humans, as observed with other species (Alvarado-Barboza and Gutiérrez-Espeleta 2013).

The assessment of climatic variables shows that water bodies, marked seasonality, precipitation of the driest month of 5 mm, and warm climates favor the presence of this species; these characteristics are typical of dry forests where S. pygmaea is abundant (Buenrostro-Silva et al. 2015; Lira-Torres et al. 2012; Cantú‐Salazar et al. 2009; Domínguez-Castellanos and González 2011; Cortés-Marcial et al. 2014; Charre-Medellín 2012; Bradie and Leung 2017).

Within the potential distribution range of this species, the Lagunas de Chacahua National Park, Chamela-Cuixmala Biosphere Reserve, Zicuirán-Infiernillo Biosphere Reserve, Meseta de Cacaxtla Protected Natural Area, Marismas Nacionales Nayarit Biosphere Reserve, Huatulco and El Veladero National Parks and the Sierra de Manantlán Biosphere Reserve are important areas for conservation that provide shelter from habitat loss (Gallina et al. 2007; Jiménez et al. 2015). The presence of S. pygmaea in the first five areas is worth highlighting (Cantú-Salazar et al. 2009; Buenrostro-Silva et al. 2015; Urrea-Galeano et al. 2016; CONANP 2016; Guzmán-Pacheco 2019). Therefore, based on our results, we recommend the monitoring of non-confirmed areas to implement actions aiming to conserve this and other species.

Currently, most conservation efforts target larger mammals (>15 kg) because many are considered umbrella species due to their wide distribution (Thornton et al. 2016). Smaller mammals that are not necessarily covered by the protection of these large umbrellas, either because of their reduced range or, as in the case of S. pygmaea, because of their fragmented distribution, are left outside of government conservation initiatives (Thornton et al. 2016).

There is little information available about the distribution range of S. pygmaea. The potential distribution is well represented on the Pacific coast; however, few areas have high environmental suitability. The distance to water bodies positively influences environmental suitability, while high livestock density has the opposite effect. Although S. pygmaea is associated with semi-urban areas, this does not mean that its permanence is guaranteed. Semi-urbanized areas should be monitored to understand better the distribution of this species and the influence of these areas on it. It is important to focus on small species, allocate areas for conservation and maintain the connectivity between their populations (Mills and Allendorf 1996). Also, outreach and education strategies should be implemented in nearby human communities to inform the local inhabitants about the importance of this species.

Acknowledgments

We thank Á. Balbuena Serrano, O. Erick Ramírez Bravo for their support with the manuscript, E. Teyssier Teuitli and L. Ortega Guzmán for providing presence records for the analysis.

Literature cited

Alvarado-Barboza, G., and G. Gutiérrez-Espeleta. 2013. Conviviendo con los mapaches: del conflicto a la coexistencia. Biocenosis 27:1-2. [ Links ]

Austin, M. P. 2002. Spatial prediction of species distribution: an interface between ecological theory and statistical modelling. Ecological modelling 157:101-118. [ Links ]

Ballesteros-Barrera, C. et al. 2016. Distribución potencial de las especies de mamíferos con distribución restringida presentes en México. CONABIO. Ciudad de México, México. [ Links ]

Balvanera, P., et al. 2000. Las selvas secas. Ciencias 057:19-24. [ Links ]

Botello, F., V. Sánchez-Corder, and M. A. Ortega-Huerta. 2015. Disponibilidad de hábitats adecuados para especies de mamíferos a escalas regional (Estado de Guerrero) y nacional (México). Revista Mexicana de Biodiversidad 86:226-237. [ Links ]

Bradie, J., and B. Leung. 2017. A quantitative synthesis of the importance of variables used in MaxEnt species distribution models. Journal of Biogeography 44:1344-1361. [ Links ]

Briseño-Hernández, I., and E. J. Naranjo. 2021. Outstanding records of mammals from two protected areas of central Guerrero, México. Therya Notes 2:99-104. [ Links ]

Brown, J. L. 2014. SDM toolbox: a python‐based GIS toolkit for landscape genetic, biogeographic and species distribution model analyses. Methods in Ecology and Evolution 5:694-700. [ Links ]

Buenrostro-Silva, A., D. S. Pérez, and J. García-Grajales. 2015. Mamíferos carnívoros del Parque Nacional Lagunas de Chacahua, Oaxaca, México: Riqueza, abundancia y patrones de actividad. Revista Mexicana de Mastozoología (n. e.) 5:39-54. [ Links ]

Byeon, D. H., S. Jung, and W. H. Lee. 2018. Review of CLIMEX and MaxEnt for studying species distribution in South Korea. Journal of Asia-Pacific Biodiversity 11:325-333. [ Links ]

Cantú‐Salazar, L., et al. 2005. Diet and food resource use by the pygmy skunk (Spilogale pygmaea) in the tropical dry forest of Chamela, Mexico. Journal of Zoology 267:283-289. [ Links ]

Cantú‐Salazar, L., et al. 2009. Dry season den use by Pygmy Spotted Skunk (Spilogale pygmaea) in a tropical deciduous forest of Mexico. Biotropica 41:347-353. [ Links ]

Capdevila-Argüelles, L., B. Zilletti, and V. Á. Suárez-Álvarez. 2013. Causas de la pérdida de biodiversidad: Especies Exóticas Invasoras. Memorias Real Sociedad Española de Historia Natural 2:55-75. [ Links ]

Carrillo-Reyna, N. L., H. Weissenberger, and R. Reyna-Hurtado. 2015. Distribución potencial del Tapir Centroamericano en la Península de Yucatán. Therya 6:575-596. [ Links ]

Ceballos, G. and A. Miranda. 2000. Guía de los mamíferos de la Costa de Jalisco, México/ A field guide to the mammals to the Jalisco coast, México. Fundación Ecológica de Cuixmala, A. C. y Universidad Nacional Autónoma de México. Distrito Federal, México. [ Links ]

Ceballos, G. , et al. 2010. Áreas prioritarias para la conservación de las selvas secas del Pacífico mexicano. Pp. 387-551, in Diversidad, amenazas y áreas prioritarias para la conservación de las selvas secas del Pacífico de México (Ceballos G., L. Martínez, A. García, E. Espinoza, J. Bezaury-Creel, and R. Dirzo, eds.). Fondo de Cultura Económica. Distrito Federal, México. [ Links ]

Charre-Medellín, J. F. 2012. Uso de manantiales por los mamíferos silvestres en bosques tropicales de Michoacán. Tesis de Maestría. Universidad Michoacana de San Nicolás de Hidalgo. Disponible en jfcharre@yahoo.mx. [ Links ]

Comisión Nacional para el Conocimiento y Uso de la Biodiversidad. 2020. Cobertura del Suelo de México a 30 metros, 2015, edición: 1.0. Comisión Nacional para el Conocimiento y Uso de la Biodiversidad. México. Disponible en http://www.conabio.gob.mx/informacion/metadata/gis/. [ Links ]

Comisión Nacional para el Conocimiento y Uso de la Biodiversidad. 1997. Provincias biogeográficas de México. Escala 1:4000 000. Comisión Nacional para el Conocimiento y Uso de la Biodiversidad, México. Disponible en: http://www.conabio.gob.mx/informacion/gis/. [ Links ]

Comisión Nacional de Áreas Naturales Protegidas. 2016. Programa de Manejo Área de Protección de Flora y Fauna Meseta de Cacaxtla. Comisión Nacional de Áreas Naturales Protegidas. Ciudad de México, México. [ Links ]

Cortés-Marcial, M., and M. Briones-Salas. 2014. Diversidad, abundancia relativa y patrones de actividad de mamíferos medianos y grandes en una selva seca del Istmo de Tehuantepec, Oaxaca, México. Revista de Biología Tropical 62:1433-1448. [ Links ]

Crooks, K. R. 2002. Relative sensitivities of mammalian carnivores to habitat fragmentation. Conservation Biology 16:488-502. [ Links ]

Cuervo-Robayo, A. P., et al. 2013. An update of high-resolution monthly climate surfaces for México. International Journal of Climatology 34:2427-2437. [ Links ]

Cuervo-Robayo, A. P., and O. Monroy-Vilchis. 2012. Distribución potencial del jaguar Panthera onca (Carnivora: Felidae) en Guerrero, México: persistencia de zonas para su conservación. Revista de Biología Tropical 60:1357-1367. [ Links ]

Defries, R. S., et al. 2000. A new global 1‐km dataset of percentage tree cover derived from remote sensing. Global Change Biology 6:247-254. [ Links ]

Domínguez-Castellanos, Y., and G. J. C. González. 2011. Variación temporal y espacial en la estructura de la comunidad de pequeños mamíferos en un bosque tropical seco. Revista Mexicana de Mastozoología (Nueva Época) 1:19-38. [ Links ]

Dragoo, J. W., et al. 1993. Phylogenetic relationships among the skunks: a molecular perspective. Journal of Mammalian Evolution 1:255-267. [ Links ]

Elith, J., et al. 2006. Novel methods improve prediction of species distributions from occurrence data. Ecography 29:129-151. [ Links ]

Elith, J., et al. 2011. A statistical explanation of MaxEnt for ecologists. Diversity and Distributions 17: 43-57. [ Links ]

Espinoza-García, C. R., et al. 2014. Distribución potencial del coatí (Nasua narica) en el noreste de México: implicaciones para su conservación. Therya 5:331-345. [ Links ]

Franklin, J. 2010. Mapping species distributions: spatial inference and prediction. Cambridge University Press. Austin, Texas U.S.A. [ Links ]

Gallina, S., S. Mandujano, and C. Delfín-Alfonso. 2007. Importancia de las Áreas Naturales Protegidas para conservar y generar conocimiento biológico de las especies de venados en México. Hacia una Cultura de Conservación de la Biodiversidad Biológica 6:187-196. [ Links ]

Gehring, T. M., and R. K. V. Swihart. 2004. Home range and movements of long-tailed weasels in a landscape fragmented by agriculture. Journal of mammalogy 85:79- 86. [ Links ]

González, G. J. C., and J. Arroyo-Cabrales. 2012. Lista Actualizada de los mamíferos de México 2012. Revista Mexicana de Mastozoología (n. e.) 2:27-80 [ Links ]

Guisan, A., and N. E. Zimmermann. 2000. Predictive habitat distribution models in ecology. Ecological Modelling 135:147-186. [ Links ]

Guzmán-Pacheco, H. M. 2019. Determinación de la abundancia relativa, distribución de indicios, patrones de actividad y composición de la dieta de perros ferales (Canis lupus familiaris) en el parque nacional Huatulco. Tesis de Maestría. Instituto Politécnico Nacional, Centro Interdisciplinario de Investigación para el Desarrollo Integral Regional Unidad-Oaxaca. [ Links ]

Helgen, K., et al. 2016. Spilogale pygmaea. In: IUCN 2017. The IUCN Red List of Threatened Species. Version 2017.3. http://www.iucnredlist.org . Consultado el 8 de septiembre 2021. [ Links ]

Instituto Nacional de Estadística y Geografía. 2016. Conjunto de Datos Vectoriales de Uso de Suelo y Vegetación. Escala 1:250 000. Serie VI (Capa Union), escala: 1:250 000. Edición: 1. Instituto Nacional de Estadística y Geografía. Aguascalientes, México. [ Links ]

Instituto Nacional de Estadística y Geografía. 2018. Anuario estadístico y geográfico por entidad federativa. Aguascalientes, México. Disponible en: http://internet.contenidos.inegi.org.mx/contenidos/Productos/prod_serv/contenidos/espanol/bvinegi/productos/nueva_estruc/AEGPEF_2018/702825107017.pdf. [ Links ]

Instituto Nacional de Estadística y Geografía. 2019. División política estatal 1:250000. 2019, escala: 1:250000. Edición: 1. Instituto Nacional de Estadística y Geografía. Aguascalientes, México. [ Links ]

Jiménez, D. T. O., et al. 2015. La importancia de las áreas naturales protegidas en nuestro país. Pp 41-60, in Las Áreas Naturales Protegidas y la Investigación Científica en México. (Ortega-Rubio, A., et al.). Centro de Investigaciones Biológicas del Noroeste, Universidad Autónoma de Yucatán, Universidad de Michoacán de San Nicolás de Hidalgo, La Paz, México. [ Links ]

Juárez-Agis, A., et al. 2020. Los Zorrillos en México un Grupo Vulnerable poco conocido. Biodiversitas 153: 12-16 [ Links ]

Lavariega, M. C. and M. Briones-Salas. 2019. Spilogale pygmaea (zorrillo pigmeo). Registros de presencia, edición: 1. Proyecto: JM011, Modelado de la distribución geográfica de mamíferos endémicos y en categoria de riesgo de Oaxaca. CONABIO. Xoxocotlán, Oaxaca. [ Links ]

Lindenmayer, D. B., et al. 1991. The conservation of Leadbeater's possum, Gymnobelideus leadbeateri (McCoy): a case study of the use of bioclimatic modelling. Journal of Biogeography 8:371-383. [ Links ]

Lira-Torres, I., C. Galindo-Leal, and M. Briones-Salas. 2012. Mamíferos de la Selva Zoque, México: riqueza, uso y conservación. Revista de Biología Tropical 60:781-797. [ Links ]

Lira-Torres, I. , and M. Briones-Salas. 2011. Impacto de la ganadería extensiva y cacería de subsistencia sobre la abundancia relativa de mamíferos en la Selva Zoque, Oaxaca, México. Therya 2:217-244. [ Links ]

Mas, J. F., et al. 2017. Evaluación de las tasas de deforestación en Michoacán a escala detallada mediante un método híbrido de clasificación de imágenes SPOT. Madera y Bosques 23:119-131. [ Links ]

Mateo, R. G., Á. M. Felicísimo, and J. Muñoz. 2011. Modelos de distribución de especies: Una revisión sintética. Revista Chilena de Historia Natural 84:217-240. [ Links ]

McDonald, P. J., A. Stewart, and C. R. Dickman. 2018. Applying the niche reduction hypothesis to modelling distributions: a case study of a critically endangered rodent. Biological Conservation 217:207-212. [ Links ]

Medellín, R. A., G. Ceballos, and H Zarza. 1998. Spilogale pygmaea. Mammalian species 600:1-3. [ Links ]

Mercado, N. I., and R. B. Wallace. 2010. Distribución de primates en Bolivia y áreas prioritarias para su conservación. Tropical Conservation Science 3:200-217. [ Links ]

Mills L. S., and F. W. Allendorf. 1996. He one‐migrant‐per‐generation rule in conservation and management. Conservation Biology 10:1509‐1518. [ Links ]

Nupp, T. E. and R. K. Swihart. 2000. Landscape-level correlates of small-mammal assemblages in forest fragments of farmland. Journal of Mammalogy 81:512-526. [ Links ]

Osorio‐Olvera, L., et al. 2020. Ntbox: an R package with graphical user interface for modelling and evaluating multidimensional ecological niches. Methods in Ecology and Evolution 11:1199-1206. [ Links ]

Pearson, R. G., et al. 2007. Predicting species distributions from small numbers of occurrence records: a test case using cryptic geckos in Madagascar. Journal of Biogeography 34:102-117. [ Links ]

Pérez-Irineo, G., C. Ballesteros Barrera, and A. Santos-Moreno. 2019. Densidad, idoneidad ambiental y nicho ecológico de cuatro especies de felinos americanos (Carnivora: Felidae). Revista de Biología Tropical 67:667-678. [ Links ]

Perkins-Taylor, I. E., and J. K. Frey. 2020. Predicting the distribution of a rare chipmunk (Neotamias quadrivittatus oscuraensis): comparing MaxEnt and occupancy models. Journal of Mammalogy 101:1035-1048. [ Links ]

Peterson A.T., et al. 2011. Ecological niches and geographic distributions. Princeton: Princeton University Press. Princeton, U.S.A. [ Links ]

Peterson, A. T., M. Papes, and J. Soberón. 2008. Rethinking receiver operating characteristic analysis applications in ecological niche modeling. Ecological Modelling 213:63-72. [ Links ]

Phillips, S. J., R. P. Anderson and R. E. Schapire. 2006. Maximum entropy modeling in species geographic distributions. Ecological Modeling 190:231-259. [ Links ]

Phillips, S. J., M. Dudík, and R. E. Schapire. 2017. Maxent software for modeling species niches and distributions (Version 3.4.1). Available from url: http://biodiversityinformatics.amnh.orgLinks ]

Pliscoff, P. and T. Fuentes-Castillo. 2011. Modelación de la distribución de especies y ecosistemas en el tiempo y en el espacio: una revisión de las nuevas herramientas y enfoques disponibles. Revista de Geografía Norte Grande 48:61-79. [ Links ]

Robinson, T. P., et al. 2014. Mapping the Global Distribution of Livestock. PLoS ONE 9:e96084. [ Links ]

Rodríguez Herrera, A. L, et al. 2013. La contaminación y riesgo sanitario en zonas urbanas de la subcuenca del río de la Sabana, ciudad de Acapulco. Gestión y Ambiente 16:85-96. [ Links ]

Sánchez-Cordero, V., and E. Martínez-Meyer. 2000. Museum specimen data predict crop damage by tropical rodents. Proceedings of the National Academy of Sciences 97:7074-7077. [ Links ]

Sarukhan, J. 2008. Capital natural de México. Comisión Nacional para el Conocimiento y Uso de la Biodiversidad (CONABIO). Distrito Federal, México. [ Links ]

Secretaría de Medio Ambiente y Recursos Naturales. 2010. Norma Oficial Mexicana NOM-059-SEMARNAT-2010, Que establece especificaciones para la realización de actividades de colecta científica de material biológico de especies de flora y fauna silvestres y otros recursos biológicos en el territorio nacional. Secretaría del Medio Ambiente y Recursos Naturales. México. 31 de enero de 2001. Diario Oficial de la Federación 30 diciembre, 2010. [ Links ]

Soberón J. and A. T. Peterson. 2005. Interpretation of models of fundamental ecological niches and species distributional areas. Biodiversity Informatics 2:1-10. [ Links ]

Soberón J. and M. Nakamura. 2009. Niches and distributional areas: concepts, methods, and assumptions. Proceedings of the National Academy of Sciences 106:19644-19650. [ Links ]

Soberón, J., L. Osorio-Olvera, and T. Peterson. 2017. Diferencias conceptuales entre modelación de nichos y modelación de áreas de distribución. Revista Mexicana de Biodiversidad 88:437-441. [ Links ]

Thornton, D., et al. 2016. Assessing the umbrella value of a range‐wide conservation network for jaguars (Panthera onca). Ecological Applications 26:1112-1124. [ Links ]

Tlapaya, L. and S. Gallina. 2010. Cacería de mamíferos medianos en cafetales del centro de Veracruz, México. Acta Zoológica Mexicana (n. s.) 26:259-277. [ Links ]

Trejo, I. 2005. Análisis de la diversidad de la selva baja caducifolia en México. Pp. 111-122, in Sobre diversidad biológica: El significado de las diversidades alfa, beta y gamma. Monografias Tercer Milenio, Zaragoza. [ Links ]

Urrea-Galeano, L. A, et al. 2016. Registro de Puma yagouaroundi en la Reserva de la Biosfera Zicuirán-Infiernillo, Michoacán. Revista Mexicana de Biodiversidad 87:548-551. [ Links ]

Warren, D. L, et al. 2014. Incorporating model complexity and spatial sampling bias into ecological niche models of climate change risks faced by 90 California vertebrate species of concern. Diversity and Distributions 20:334-343. [ Links ]

Wilson, D. E., and D. M. Reeder. 2005. Spilogale pygmaea. Mammal species of the world: a taxonomic and geographic reference, primera edición. Johns Hopkins University Press. Baltimore, U.S.A. [ Links ]

Associated editor: Lazaro Guevara

Appendix 1

 Variablesused in the environmental suitability model and potential distribution of the pygmy spotted skunk (Spilogale pygmaea).  

Variable Unit of measure Source
Average day range °C (degrees Celsius) Cuervo-Robayo et al. (2013)
Isothermality
Maximum temperature of the warmest month
Minimum temperature of the coldest month
Annual Mean precipitation mm3
Precipitation of the wettest month
Precipitation of the driest month
Distance to deciduous forests Distance (decimal degrees) National Forest Inventory, Series VI (INEGI 2016)
Distance to grasslands
Distance to water bodies
Distance to urban areas
Distance to livestock areas
Percentage of tree cover Percentage (Defries et al. 2000)
Livestock density Density (individuals/km2) Robinson et al. (2014)

Received: January 16, 2022; Revised: February 05, 2022; Accepted: May 11, 2022; Published: May 29, 2022

* Corresponding author: 13457@uagro.mx

Creative Commons License This is an open-access article distributed under the terms of the Creative Commons Attribution License