


 nueva página del texto (beta)
 Inglés (pdf)
 Artículo en XML
 Referencias del artículo
 Enviar artículo por email
 Citado por SciELO
  Similares en
SciELO
Similares en
SciELO 
 Permalink
Introduction
Several studies have shown that chronic exposure to noise can have adverse effects on wildlife (Kight and Swaddle 2011), which occur at the physiological level or affect communication, behavior patterns, and the structure of communities (Barber et al. 2010; Brumm 2010; Kight and Swaddle 2011; Siemers and Schaub 2011; Francis and Barber 2013; Shannon et al. 2015). In communication, noise interferes with the tone, intensity, and structure of signal emissions, so that its reception lacks information, thus producing an acoustic masking effect (Barber et al. 2010; Naguib 2013). To compensate for this effect, different species of animals have made vocal adjustments in the acoustic signals emitted (Nemeth et al. 2013; Rios-Chelén et al. 2015; Shen and Xu 2016; Brumm and Zollinger 2017). For instance, birds can increase the frequency and amplitude of the song and reduce the number of syllables (Slabbekoorn and Peet 2003; Brumm 2004; Nemeth et al. 2013; Rios-Chelén et al. 2015). It has also been observed that some species of lizards may increase the duration of syllables or use a higher number of syllables containing more intense tones (Brumm and Zollinger 2017).
Similar to other vertebrates, bats have adapted to life in urban areas, so it is possible to find bat shelters and hunting sites within or in the periphery of cities (Kunz and Reynolds 2003; Russo and Ancillotto 2015). The emission of high-frequency sounds allows bats to perceive shapes and textures of the surrounding environment, thus creating an acoustic image that provides them with information for spatial orientation and the detection, identification, and location of food (Neuweiler 2000; Schnitzler and Kalko 2001). For some bat species, noise represents an aversive stimulus. It has been observed that some species avoid foraging in areas exposed to high noise levels, and that foraging becomes less efficient due to increased search effort (Schaub et al. 2011; Bunkley and Barber 2015; Luo et al. 2015a). Echolocation pulses are susceptible to different acoustic stimuli that may potentially interfere with echo reception (Gillam and Montero 2016), so that noise can mask this information in low-frequency echolocation pulses. In response, bats can adjust the components of their echolocation pulses by increasing the duration, bandwidth (Bunkley et al. 2015), and amplitude (Hage and Metzner 2013a; Hage et al. 2013b; Luo et al. 2015b). However, other factors such as flight height, social interactions, reproductive age, geographic isolation, foraging habitat, postnatal development, and environmental temperature and humidity influence the variation of echolocation pulses (Chaverri and Quirós 2017; Grillot et al. 2014; Guillam et al. 2009; Jiang et al. 2015; Kraker-Castañeda et al. 2019; Varela-Boydo et al. 2019; Voigt-Heukce et al. 2010).
The bats Molossus sinaloae (family Molossidae) and Mormoops megalophylla (family Mormoopidae) have been reported as urban exploiters sensuMcKinney (2002), as they take advantage of resources available in cities for shelter and food (Rodríguez-Aguilar et al. 2017). Individuals inhabiting urban areas are constantly subjected to high anthropogenic noise levels, mainly from vehicular traffic (> 50 dB, Luo et al. 2015a). M. sinaloae is a fast-flight forager in open spaces that emits low-frequency, narrow-bandwidth and long-duration echolocation pulses characterized by the alternation of frequencies, visualized as steps in the spectrogram, and displays high plasticity in pulse emission (Jung et al. 2014). M. megalophylla is a forager in vegetation clearings and edges (Schnitzler and Kalko 2001). Its pulses are easily recognizable, consisting of a main component of constant frequency that ends with a downward curve of modulated frequency showing harmonics in which the first (fundamental signal) is of low intensity while the second and third are usually of high intensity (Rydell et al. 2002).
Lara-Núñez (2015, unpublished data), in a work carried out in Cuernavaca, Morelos, México, found that the frequencies of the echolocation pulses of M. sinaloae and M. megalophylla were higher than those described for individuals of these species recorded in a natural habitat (Orozco-Lugo et al. 2013). Considering the above, this study evaluated whether anthropogenic noise produces an acoustic masking effect on the time and frequency components of the echolocation pulses of M. sinaloae and M. megalophylla, by comparing the pulses of each species recorded in two sites with contrasting conditions of anthropogenic noise levels, an urban area and a natural area, located in the state of Morelos, México. Our hypothesis is that the frequency and time components of the pulses of both species would increase in response to masking.
Materials and methods
Study areas and sites. To compare the levels of ambient noise and their effect on the components of echolocation pulses, two study areas were selected: an urban area (with anthropogenic noise) and a natural area (without anthropogenic noise; Supplementary material 1). The urban area selected was the city of Cuernavaca, which extends across an area of 151 km2 and is home to 366,320 inhabitants (INEGI 2015). It covers an altitudinal range from 1,100 masl in the southern zone to 1,800 masl in the northern zone (INEGI 2009); the dominant climate is warm subhumid with a mean annual temperature of 21.1° C (IMTA 2014). The city is characterized by the transition between its main types of vegetation, from low deciduous tropical forest or deciduous tropical forest in the southern zone to pine-oak forest in the north (Dorado et al. 2012). The natural area selected was Sierra de Huautla (SH), located in the south of the state of Morelos. Its altitudinal range extends from 700 to 2,000 masl, characterized by a warm subhumid climate with summer rains. The main type of vegetation is low deciduous tropical forest; however, there are also areas with medium subdeciduous forest, oak forest, and a small area of pine forest (Dorado et al. 2005). The distance separating the two study areas is 53 km.
In Cuernavaca, four sampling sites were set for the recordings: Acapantzingo, Centro, Palmas, and Galerías Cuernavaca shopping mall. In each, a sound meter was used to record preliminary measurements of environmental noise under different conditions of vehicular traffic and environmental noise. The selected sites include housing and commercial infrastructure and government offices with an open layout; the avenues and roads that cross them are open spaces between buildings, which are mostly less than 10 m in height. In SH, three sites were selected for the recordings, one located on the road to the village of El Limón, one on the stream that runs through the town of Quilamula, and the third located in El Limón Biological Station. These are open sites surrounded by low deciduous tropical forest where trees reach heights of 4 to 10 m.
Acoustic sampling of bats. Ultrasound recordings of bats were made in May, June, October, November, and December 2016. Fixed points were set at each sampling site, where recordings were made continuously over one and a half hours from the sunset hour indicated by a GPS device (Garmin eTrex). The recording period was established by prioritizing personal safety when staying during such hours of the day in urban sites. Recordings were made in real time with the Echo Meter 3+ (Wildlife Acoustics) ultrasonic detector, at a sampling rate of 256 kHz and a 16-bit resolution, using an SDHC memory card with 4 GB storage capacity, and positioning the detector at 45 degrees at the elbow level. Recordings were made once a month at each sample site, following a random order.
Analysis of recordings. Search sequences were selected based on the emission of more than five consecutive pulses because pulses were more uniform in structure during the search phase, unlike the approach-and-capture phase. The pulses in the spectrogram were considered high-quality when the display of each pulse was complete from start to end, making sure that no more than one conspecific or heterospecific individual interfered. The recordings were analyzed with the software BatSound 4.2 (Pettersson Elektronik) following the protocol outlined below.
Spectrograms were displayed at a 16-bit resolution, with a sampling rate of 44,100 kHz/s, at a time expansion of 10x, Fast Fourier Transforms (FFT) with 512 samples, in a 95% overlapping Hanning window. Five frequency (kHz) and two time (ms) parameters were measured. The initial frequency (IF; frequency at the start of the pulse) was measured by placing the frequency cursor in the center of the start of the pulse. The final frequency (FF; frequency at the end of the pulse) was measured by placing the frequency cursor in the center at the end of the pulse. To measure the mid-pulse frequency (MPF; frequency at the middle of the pulse length), the pulse duration was divided by two, placing the frequency cursor at that point and recording the value at the intersection with time. The maximum amplitude frequency (MAF; frequency emitted at the point of highest pulse energy) was measured as the value of the highest peak recorded over the entire pulse length, as shown in the cumulative power spectrum. Also recorded were the bandwidth (BW; difference between the initial and final frequencies) and the pulse interval (PI; time elapsed from the start of one pulse to the start of the next pulse), the latter measured by placing the cursors at the start of each pulse. The pulse duration (PD; the time from pulse start to end) was measured by placing the cursors at the start and end of each pulse. For M. megalophylla, the second harmonic was measured according to Rydell et al. (2002) because this harmonic attained the highest intensity while the fundamental one was very weak and, in most echolocation sequences, it was imperceptible in the spectrogram; in the case of M. sinaloae, no harmonics were observed, but only the fundamental frequency.
Noise measurement. Ambient noise was measured in parallel with the ultrasound recordings at 10-minute intervals, from the time when each recording started, using a sonometer (BENETECH, GM 1351), an instrument that measures sound intensity in decibels (dB, unit of measure). These measurements were recorded at all sites in both natural and urban areas, to obtain a measure of the level of environmental noise experimented by the bat species in the study sites.
Statistical analysis. For statistical analyses, the data for each parameter obtained from the echolocation sequences of the search fase were averaged. Given that M. sinaloae shows alternation of pulses during commuting and search for prey, low pulses and high pulses were compared separately in the statistical analyses and the difference in initial frequency between both pulses was evaluated as a measure of pulse alternation.
We analyzed the differences in noise levels between urban and natural sites, as well as between sampling periods, to determine whether the effect of noise is homogeneous over the spatial and temporal scales studied. To this end, we first evaluated the data normality and homoscedasticity assumptions using the MASS package (Venables and Ripley 2002) in R 4.01 (R Core Team 2021). These analyses showed that the variables considered have a normal distribution, but their variance is heterogeneous. Hence, we used the robust Welch’s Analysis of Variance, which is designed to treat heteroscedastic data (Wilcox 2012), followed by a multiple comparison test of trimmed means. These analyses were implemented in the package WRS2 (Mair and Wilcox 2020).
Since the noise analyses showed no significant differences either between sites or between sampling periods (see Results), the analysis of each component of the echolocation pulses was carried out by sorting sites into two levels: urban (the four sites sampled in the city of Cuernavaca) and natural (SH sites). We evaluated the data normality and homoscedasticity following the same procedure described for noise levels, finding that the pulse variables have normal distribution and heterogeneous variances. Thus, univariate comparisons between urban and natural levels were made using the robust ANOVA model. A value of α = 0.05 was used for all the analyses. In addition, a multivariate analysis of variance was used to assess the differences between the urban and natural categories, after the data were transformed into natural logarithms to homogenize the variances, followed by a discriminant analysis to illustrate the differences and test the a priori classification of the groups by type of habitat. This analysis allows classifying independent variables with mutually exclusive characteristics in a group established a priori from a dependent variable. These multivariate analyses were run using the program PAST 4.02 (Hammar et al. 2001).
Results
Seventy-five noise measurements were recorded over eight nights in urban sites, and 58 over six nights in natural sites. The average environmental noise measured was 75 (± 4.2) dB in the urban area and 45 (± 1.4) dB in the natural area. Robust analyses of variance and multiple comparison tests showed significant differences between urban and natural sites (F = 180.08, P < 0,001), but comparisons of noise levels within urban sites and within natural sites, as well as between sampling periods, showed that these differences were not significant (urban F = 4.91, P > 0.05; natural F =3.2, P > 0.05; Figure 1).
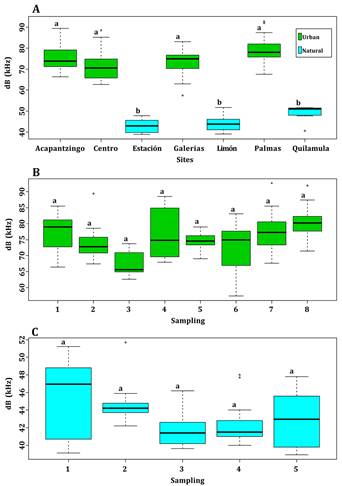
Figure 1 Box plots showing noise levels according to sampling sites in the natural and urban environments (A), and to sampling periods in the urban (B) and the natural (C) environments. The black line represents the median; boxes represent the ranges between quartiles, and whiskers represent minimum and maximum values.
A total of 795 sequences for both species were identified in 1530 minutes of recording during the sampling months, of which we analyzed 33 for M. sinaloae and 27 for M. megalophylla. From these sequences, a total of 545 echolocation pulses were measured for the two species, 332 for the urban area and 213 for the natural area. The parameters of each echolocation pulse were stored in a database, sorted by species and type of area where recordings were made. An average per recording was obtained for each parameter per sampling site in Cuernavaca and SH.
For M. sinaloae, 266 pulses, 93 for the natural area and 173 for the urban area, were analyzed in 33 sequences. In the urban area, the frequency and time parameters showed higher values than those obtained in the natural area (Table 1). The variables measured in the high echolocation pulses of M. sinaloae were contrasted between the two different types of habitats and noise intensity (urban 75 dB vs. natural 45 dB). The analyses of variance showed significant differences between the five frequency components: initial rate (F = 114.38, P < 0.05), final frequency (F = 115.30, P < 0.05), bandwidth (F = 23.25, P < 0.05), mid-pulse frequency (F = 106.70, P < 0.05), and maximum amplitude frequency (F = 85.63, P < 0.05). In all cases, higher frequencies were observed in the urban area (Figure 2 A-E). For the time parameters, pulse duration was significantly shorter in the urban area (F = 17.15, P < 0,001; Figure 2 F), while no significant differences were observed in the time elapsed between the emission of consecutive pulses (F = 4.02, P > 0.05). Similar results were found for low pulses, where robust analyses of variance showed that the five frequency components were significantly higher in the urban area: initial frequency (F = 77.93; P < 0.05), final frequency (F = 67.91; P < 0.05), bandwidth (F = 43.55, P <0.05), mid-pulse frequency (F = 73.86; P < 0.05), and maximum amplitude frequency (F = 64.59; P < 0.05) (Figure 3 A-E). On the other hand, pulse duration and interval of low pulses were significantly shorter in the urban area (F = 67.24, P < 0.05; F = 17.15, P < 0.05; Figure 3 F and G).
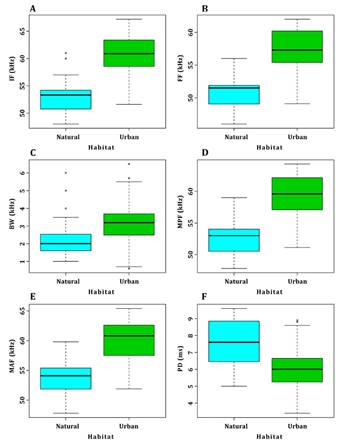
Figure 2 Box plots of the frequency and time components of the echolocation high pulses of M. sinaloae contrasted in the two environments studied: natural and urban. (A) Initial frequency, (B) final frequency, (C) bandwidth, (D) mid-pulse frequency, (E) maximum amplitude frequency, and (F) pulse duration. Four frequency components had higher values in the urban area. The black line represents the median; boxes represent the ranges between quartiles, and whiskers represent minimum and maximum values.
The difference in the initial frequency between the low and high echolocation pulses of M. sinaloae also showed significant differences (F = 13.81, P < 0.05). In the urban area, the difference between the low and high pulses was 7.2 kHz on average, while for the natural area, the difference between the two pulses was 5.7 kHz on average (Figure 3 H).
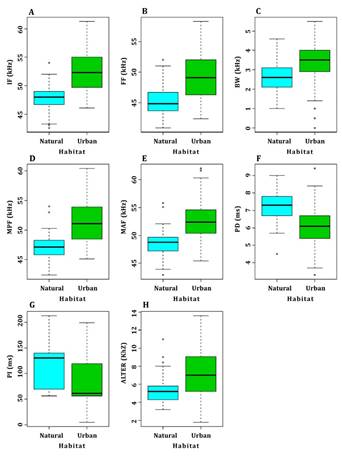
Figure 3 Box plots of the frequency and time components of the echolocation low pulses of M. sinaloae contrasted in the two environments studied: natural and urban. (A) Initial frequency, (B) final frequency, (C) bandwidth, (D) mid-pulse frequency, (E) maximum amplitude frequency, (F) pulse duration, (G) interval between pulses, and (H) alternation between high and low pulses. The black line represents the median; boxes represent the ranges between quartiles, and whiskers represent minimum and maximum values.
The discriminant analysis of the low pulses of M. sinaloae showed a significant difference between groups (Wilks λ = 0.45; P = 0.0028). Of the low pulses corresponding to the urban area, 84 % were correctly assigned, while of the pulses emitted in the natural area, 100 % were correctly assigned (Supplementary material 2). Differentiation was also significant for the high pulses (Wilks λ = 0.32; P < 0.05); 92 % of the high pulses emitted in the urban area and 86 % in the natural area were correctly assigned (Supplementary material 3).
For M. megalophylla, 279 pulses, 120 for the natural area and 159 for the urban area, were analyzed in 27 sequences. The time and frequency components of the pulses showed similar values between the urban and natural areas (Table 2). The robust ANOVA between pulse components and urban and natural areas showed significant differences only in initial frequency (F = 148.35; P < 0.05), final frequency (F = 95.46; P < 0.05), and mid-pulse frequency (F = 101.24; P< 0.05); these were higher in the Cuernavaca urban area (Figure 4 A-D). Bandwidth (F = 2.78; P = 0.74), and the time components pulse duration (F = 0.48; P = 0.57) and interval (F = 0.86; P = 0.35) showed non-significant differences between the two areas. The discriminant analysis of the pulses of M. megalophylla showed a non-significant difference between groups (Wilks λ = 0.53; P = 0.104; Supplementary material Figure 7). For this species, 81 % of the total data corresponding to the urban area and 87 % of those corresponding to the natural area were correctly assigned.
Table 1 Mean and standard deviation of each component measured in the echolocation pulses of M. sinaloae in the sampling areas.
| Environment | Type of | IF | FF | BW | MPF | MAF | PD | PI |
|---|---|---|---|---|---|---|---|---|
| Pulses | (KHz) | (kHz) | (kHz) | (kHz) | (kHz) | (ms) | (ms) | |
| Urban | Low | 52.8 | 49.4 | 3.3 | 51.7 | 52.6 | 5.8 | 84.2 |
| ± 3.7 | ± 3.5 | ± 0.7 | ± 3.5 | ± 4.2 | ± 0.9 | ± 38.1 | ||
| High | 60.1 | 57 | 3 | 59 | 59.8 | 5.9 | 87.9 | |
| ± 3.6 | ± 3.2 | ± 1 | ± 3.4 | ± 3.4 | ± 0.9 | ± 23.2 | ||
| Natural | Low | 47.7 | 44.9 | 2.7 | 47.1 | 48.4 | 7.2 | 111.4 |
| ± 2 | ± 2 | ± 0.6 | ± 2.1 | ± 2.2 | ± 0.4 | ± 30.1 | ||
| High | 53 | 50.5 | 2.5 | 52.2 | 53.2 | 7.4 | 117.4 | |
| ± 3 | ± 2.3 | ± 0.9 | ± 2.6 | ± 2.8 | ± 1.1 | ± 29.5 |
Table 2 Mean and standard deviation of each component measured in the echolocation pulses of M. megalophylla in the two sampling areas.
| Environment | IF | FF | BW | MPF | MAF | PD | PI |
|---|---|---|---|---|---|---|---|
| (kHz) | (kHz) | (kHz) | (kHz) | (kHz) | (ms) | (ms) | |
| Urban | 69.5 | 65 | 4.4 | 68.8 | 69 | 6.1 | 81 |
| ± 1.9 | ± 2.8 | ± 2.7 | ± 1.8 | ± 2.5 | ± 0.7 | ± 20 | |
| Natural | 67.4 | 62.7 | 4.7 | 67 | 67.7 | 6.4 | 70.4 |
| ± 0.8 | ± 0.9 | ± 0.3 | ± 0.8 | ± 0.8 | ± 0.5 | ± 12.3 |
Discussion
The results showed that, under background noise at an average intensity of 75 dB in the urban environment, M. sinaloae increased the frequencies of its echolocation pulses, both low and high, by 5.8 kHz on average. This suggests that, according to the hypothesis of the present study, when facing higher background noise levels, M. sinaloae emits echolocation pulses of higher frequencies since anthropogenic noise masks echolocation signals, significantly affecting the components of the pulses emitted by M. sinaloe, while the interval duration and pulse duration decreased.
Although it has been documented that bats exhibit variations in the design of the time and frequency components of their echolocation pulses due to factors associated with geographic isolation, flight height, and foraging habitat (Gillam et al. 2009; Jiang et al. 2015; Kraker-Castañeda et al. 2019; Russo et al. 2018), particularly in species of the family Molossidae, there are changes in the frequency and alternation of navigation pulses associated with the variations in geographic location and flight altitude (Gillam et al. 2009; Jung et al. 2014). However, in none of the cases documented to date, the initial, final, and maximum amplitude frequency exceed 5 kHz between locations separated by more than 100 km or at altitudes from 30 m to 800 m. In this study, recordings were made in open spaces in both natural and urban habitats, so that the changes in frequency and time parameters are not determined by habitat structure (Kraker-Castañeda et al. 2019). Although environmental conditions such as temperature and humidity can influence the variation of echolocation pulses, the difference in kHz and ms is unclear (Chaverri and Quirós 2017). In view of these results, we consider that the increase in the frequency components of the pulses of M. sinaloae - mainly the maximum amplitude frequency, which is where the maximum energy of the pulse is concentrated - may be a response to the Lombard effect, defined as the increase in vocal amplitude when facing background noise (Zollinger and Brumm 2011; Luo et al. 2017). This type of response has been observed in male concave-eared torrent frogs (Onorrana tormota) as increased fundamental frequencies and amplitude of vocalizations when noise intensity increased by 10 dB (Shen and Xu 2016). In birds, the great tit (Parus major) increased the minimum frequency of its sound associated with higher background noise levels (Slabbekoorn and Peet 2003).
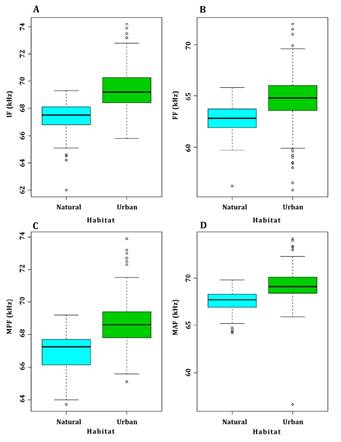
Figure 4 Box plots of the frequency and time components of the echolocation pulses of M. megalophylla contrasted in the natural and urban areas. (A) Initial frequency, (B) final frequency, (C) mid-pulse frequency, and (D) maximum amplitude frequency. The black line represents the median; boxes represent the ranges between quartiles, and whiskers represent the minimum and maximum values.
In the case of the bat M. megalophylla, statistically significant changes were observed only in the initial, final, and mid-pulse frequencies. A potential factor also influencing the difference observed in the response to noise between both bat species is the type of foraging, since M. megalophylla forages near or between the vegetation, i. e., it flies in areas with dense vegetation structure. As open-space foragers, molossids emit pulses of low frequency, long duration, narrow band, and with long time lapses between pulses (Schnitzler and Kalko 2001). For M. sinaloae, background noise is equivalent to flying in an enclosed space, so it should be able to distinguish the echo of its prey from the echo of traffic noise. Thus, by emitting pulses of high frequency, broadband, and short duration, it retrieves more accurate information about the location and characterization of the environment in which it flies, facilitating the detection of background objects, preys, and avoiding collisions (Schnitzler and Kalko 2001). This increase in pulse frequencies was also observed for Tadarida brasiliensis, a species for which the amplitude, duration, and bandwidth of echolocation pulses increased when individuals were exposed to digitally generated noise at 85 dB (Tressler and Smotherman 2009).
However, noise limits signal detection, thus reducing the echolocation range (Tyack and Janik 2013); also, the distance for prey detection becomes shorter in areas with background noise, so the increased frequencies and shorter pulses respond to prey detection at a shorter range.
The results also showed that, in the urban environment, there is a greater difference in the frequency between high and low pulses. Different hypotheses have been put forward about the use of pulse alternation in different bat species (Kingston et al. 2003), the most plausible being that emitting pulses at different frequencies maximizes the detection distance, allowing a precise discrimination of the echoes of calls (Jung et al. 2006). For this study, the sequences with the highest number of high pulses were those corresponding to the urban environment, so that alternating pulse frequencies would improve the classification of traffic noise echoes; however, the difference between pulses is greater as pulse frequencies increase, representing a higher energy expenditure for the bat, likely related to the additional work by the muscles of the abdominal wall involved in the production of echolocation pulses (Currie et al. 2020).
Our results do not associate the increased frequencies in the pulses of M. megalophylla with noise. The values recorded in Cuernavaca are similar to those recorded in Sierra de Huautla in this study, where anthropogenic noise is lower. The duration of the pulses (6.4 ± 0.5 ms) recorded in the Reserve is similar to the duration (6.9 ms) reported in a previous study in the same area (Orozco-Lugo et al. 2013) and to the 5.55 ± 2.19 ms reported for a location in the state of Oaxaca (Briones-Salas et al. 2013). The variation in frequency is likely associated with harmonics, integer multiples of the lowest harmonic, or the fundamental signal (Jones and Teeling 2006). Commonly, in the echolocation pulses of the family Mormoopidae, a fundamental harmonic is emitted with frequencies around 30 kHz followed by three harmonics ranging from 60 to 120 kHz (Griffiths 1978). Specialized structures in the larynx of Mormoopids amplify the second harmonic and can suppress the fundamental signal (Griffiths 1978). The incidence of harmonic emission depends on the foraging environment and the positioning of the ultrasonic microphone toward the bat (Fenton et al. 2011). In open spaces, some species can emit narrow-band multi-harmonic signals dominated by non-fundamental harmonics (Jones and Teeling 2006). Eptesicus fuscus emits three harmonics above the fundamental one when flying in enclosed spaces, and one harmonic above the fundamental signal in open spaces (Fenton et al. 2011). When M. megalophylla flies in an open space, only the second harmonic is recorded. Research on bats addressing the effect of anthropogenic noise is still scarce. For this reason, it is important to carry out further studies to determine and understand the changes in echolocation frequencies and duration of their pulses because, depending on these modifications, bats will be able to thrive in an environment increasingly transformed by anthropogenic activities.

