


 nova página do texto(beta)
 Inglês (pdf)
 Artigo em XML
 Referências do artigo
 Enviar este artigo por email
 Citado por SciELO
  Similares em
SciELO
Similares em
SciELO 
 Permalink
Introduction
Regardless of the time when North and South America became connected in geological times and the physical substrate that was established in Central America (islands, isthmus of Panama, etc.) for the Great American Biotic Exchange (GABI), the orographic, biotic, biogeographical, and climatological complexity of the zone (southern North America, Central America, and northern South America) is of such diversity and magnitude that evolutionary processes in this area, including diversification and speciation, have occurred at a high speed (Marshall 2007; Hardy et al. 2013). Therefore, the evolutionary study of the species with a broad distribution range in this geographic area can reveal essential information for understanding the colonization, adaptation, diversification, and speciation processes of migrant organisms between previously separate continents (Webb 2006; Morgan 2008).
A species that meets these characteristics is the white-nosed coati (Nasua naricaLinnaeus 1766, Order Carnivora, Family Procyonidae) since it has a wide distribution from North America to northern South America (González-Maya et al. 2011). The evolutionary and biogeographical history of procionids is controversial from the molecular and paleontological perspectives (Soibelzon and Prevosti 2013; Nigenda-Morales et al. 2019; Ruiz-García et al. 2019b, 2020a). In fact, procionids are one of the taxonomic groups that can provide surprising insights into how and when GIBA occurred (Koepfli et al. 2007; Forasiepi et al. 2014).
Nasua narica is distributed from Arizona and New Mexico (USA) through Central America, including the Pacific coast of Colombia, Ecuador, and northern Peru (Emmons 1990; Emmons and Feer 1997; Tirira 2007, 2011). However, Gompper (1995) excluded the Ecuadorian and Peruvian Pacific areas because this author considered that Nasua nasua lives there. Although Gompper (1995) excluded N. narica from the South American mammal fauna, other authors, such as those previously mentioned, and the results of the present study postulate the existence of N. narica in northwestern South America, which is why we used South American specimens of this species.
Nasua narica is a strongly gregarious species that forms social groups including up to 30 females and juveniles per group, while males tend to be solitary and are the only ones to disperse after reaching sexual maturity (Gompper 1997; Gompper et al. 1997, 1998). On the other hand, females are strongly philopatric and frequently do not disperse outside the area where they were born (Valenzuela and Ceballos 2000). This species potentially participates in controlling small-sized pests such as rodents and arthropods, besides being a seed disperser and a potential prey for large cats such as jaguar (Panthera onca) and puma (Puma concolor (Gompper 1995, 1997).
Four subspecies have been recognized according to body size, differences in coat color, and cranial characteristics (Hershkovitz 1951; Hall 1981; Decker 1991; Gompper 1995). These differences may be related to geographic barriers and ecological differences (Hershkovitz 1951). The four subspecies are: 1) N. n. molaris (Merriam 1902; Type locality: Manzanillo, Colima, México), distributed from the north of the Trans-Mexican Volcanic Belt to Arizona and New Mexico USA; 2) N. n. narica (Linneus 1766; Type locality: “America”, restricted to Achotal, Isthmus of Tehuantepec, Veracruz, México), distributed south of the Trans-Mexican Volcanic Belt to south Panama; 3) N. n. nelsoni (Merriam 1901; Type locality: Cozumel Island, Quintana Roo, México), distributed exclusively in the type locality; and 4) N. n. yucatanica (Allen 1904; Type locality: Chichen Itzá, Yucatán, México), confined to the Yucatán Peninsula. McFadden et al. (2008) designated the insular subspecies as a different species (N. nelsoni) based on a morphometric analysis.
To date, only two works have analyzed the genetic structure of N. narica. The first, by Silva-Caballero et al. (2017), used a fragment of 800 base pairs (bp) of the mitochondrial gene (mt) Cyt-b and 12 nuclear microsatellites in 60 specimens from five different populations in México (Nayarit, Jalisco, Morelos, Tabasco, and Quintana Roo). Moderate and high levels of genetic diversity were found for both types of molecular markers (mitochondrial: haplotypic diversity, H d = 0.968; microsatellites: expected heterozygosity, H E = 0.774). A total of 22 haplotypes were detected in the five areas analyzed, and each of the populations with unique haplotypes, except for three haplotypes shared between the two geographically closest populations (Puerto Morelos, Quintana Roo, and La Venta, Tabasco). Both genetic markers clearly separated the five populations studied and identified a strong genetic structure between them, suggesting isolation by distance.
The second study was conducted by Nigenda-Morales et al. (2019) with sequences of three mt genes (Cyt-b, NAD5, and 16S rRNA) and 11 nuclear microsatellites in 85 specimens from Arizona and New Mexico (USA), México (Jalisco, Morelos, Yucatán, and Cozumel Island), Belize, Guatemala, Costa Rica, and Panama. They found a strong genetic structure with five distinct Evolutionary Units (EU). The southernmost (Panama) was the most differentiated EU, with genetic distances between 9.9 % and 10.8 % from the other four EU, and which appeared 3.8 million years ago (Ma). A second EU consisted of specimens from Costa Rica, Guatemala, Belize, Cozumel Island, and Yucatán (México). A third EU included specimens from Morelos (central México), while the fourth EU included specimens from Jalisco (western México); finally, the fifth EU comprised specimens from southwest USA. The diversification of this group was calculated to have occurred 1.2 Ma. The genetic flow took place from south to north and from east to west.
The present study used two sets of mitochondrial genes (three loci: ND5, Cyt-b, and D-loop; and complete mitogenomes) analyzed in 74 and 59 specimens, respectively, of N. narica sampled in México, Belize, Guatemala, Honduras, El Salvador, Nicaragua, Costa Rica, Panama, Colombia, and Ecuador. We focused on mtDNA to expand the scope of previous results with a larger number of data (mitogenomes) and samples of specimens from South America that clearly belong to this species because of their external morphology (phenotype). It is also possible to compare our results with those of Nigenda-Morales et al. (2019) since the present study included Colombia and Ecuador, whereas the study referred to was limited to northern Mesoamerica.
Mitochondrial DNA genes allow reconstructing phylogenetic relationships to determine recent intra- or inter-specific genetic divergence processes, while nuclear genes reveal deeper relationships (Collins and Dubach 2000, 2001; Cortés-Ortiz et al. 2003; Ruiz-García et al. 2016). In fact, mtDNA has been extremely effective for detecting new groups or taxa that had been left out with other techniques (Krause et al. 2010; Derenko et al. 2012; Sawyer et al. 2015). Mitochondrial genes have high mutation accumulation rates, short coalescence times, absence of introns and recombination, and haploid inheritance (Avise et al. 1987). In addition, although they represent a single linked locus, the selection pressure and evolutionary rates are heterogeneous, depending on the genes considered (Nabholz et al. 2012). An additional advantage is that the number of mtDNA copies per cell is high, thus making it easier to obtain sequences and mitogenomes from low-quality samples (teeth, hair, skin, etc.; Guschanski et al. 2013). However, caution should be exercised with mtDNA because gene trees do not always match species trees (Freeman and Herron 1998). Also, mtDNA only shows the evolution of female lineages, so hybridization events produced by males as vectors of gene flow go unnoticed (Burrell et al. 2009).
Therefore, considering that this work covers the broadest distribution range analyzed to date for N. narica and that, for the first time, complete mitogenomes are analyzed for this species, the objectives are to 1) determine the number of lineages in N. narica throughout its geographic range, and whether the putative morphological subspecies described for N. narica match the molecular groups detected; 2) estimate genetic heterogeneity among these groups and the ancestor-descendant relationship between them; 3) determine the relationship of historical geographic, geological, and climatological events to the divergence times found in the genetic groups of N. narica; 4) estimate the levels of genetic diversity within them; and 5) determine significant patterns of spatial structure throughout the area analyzed.
Materials and Methods
Sample collection. We analyzed 74 specimens of N. narica from México (n = 25), Guatemala (n = 21), Belize (n = 3), Honduras (n = 7), El Salvador (n = 3), Nicaragua (n = 1), Costa Rica (n = 3), Panama (n = 1), Colombia (n = 4), Ecuador (n = 5), and Robinson Crusoe Island (Chile; n = 1, Figure 1 and Supplementary Table 1). Eight specimens of Nasuella olivacea from Colombia were used as an external group, as well as 29 specimens of Nasua nasua from Colombia (n = 4), Ecuador (n = 5), Perú (n = 11), Bolivia (n = 3), and Brazil (n = 6). For mitogenomes, there were 59 specimens from México (n = 21), Guatemala (n = 14), Belize (n = 3), Honduras (n = 7), El Salvador (n = 3), Nicaragua (n = 1), Costa Rica (n = 3), Panama (n = 1), Colombia (n = 2), Ecuador (n = 3), and Robinson Crusoe Island (Chile) (n = 1). Samples of six specimens of N. olivacea from Colombia were used as an external group, as well as 23 specimens of N. nasua from Colombia (n = 4), Ecuador (n = 2), Peru (n = 10), Bolivia (n = 3), and Brazil (n = 4).
The samples come from specimens hunted by indigenous communities and road-killed animals in southern México, and Central and South America (fragments of skin, teeth, and hairs with bulbs). Permission to collect biological materials was requested from the authorities of the communities (in addition to the corresponding ministries). During the sampling process, hunters from the local communities were interviewed to determine the exact source of the samples; these were usually collected within 5 to 15 kilometers of the interview site. Samples were gathered over 22 years (1996-2018).
DNA extraction, amplification, and sequencing. DNA extraction from skin and muscle samples was performed using the phenol-chloroform procedure (Sambroock et al. 1989). DNA from follicle hairs and teeth was extracted with Chelex 100 resin (Bio-Rad, Hercules, California, USA) using the protocol of Walsh et al. (1991), while the DNA from bones was extracted with the DNeasy Blood and Tissue Kit (Qiagen, Hilden, Germany). These procedures were used for all three mitochondrial loci. Three mt loci were amplified: 1) 407 bp of the Cyt-b gene (Irwin et al. 1991), 2) 1,800 bp of gene ND5 (Trigo et al. 2008), and 3) 306 bp from the D-loop region (Hoelzel et al. 1994). The total sequenced length was 2,513 bp.
We used the PCR (Polymerase Chain Reaction) in a final volume of 25 µL: 2µL of 1 mM MgCl2 (CorpoGen), 1 µL of 0.2 mM dNTPs (BioLabs), 1 µL of 0.1 mM of each primer, one Taq Polymerase Unit (CorpoGen), 100-200 ng of DNA template (in 2-4 µL of DNA), 2 µL of 10X Buffer, and 14-16 µL of double-distilled H2O. The PCR temperatures for gene amplification were 95 °C for 5 minutes, followed by 40 cycles at 94 °C for one minute: 52 °C (Cyt-b), 55 °C (ND5), and 56 °C (D-loop) for one minute, 72 °C for one minute, and a final extension at 72 °C for ten minutes. The amplification products, including positive and negative controls, were run on a 2 % agarose gel stained with ethidium bromide and visualized with ultraviolet light on a transilluminator. Both directions were sequenced using BigDye Terminator v3.1 (Applied Biosystems, Inc., Foster City, California, USA), whose products were analyzed on an ABI 3730 sequencer (Applied Biosystems, Inc., Foster City, California, USA). The sequences were assembled and edited with Sequencher 4.7 (Gene Codes, Corp., Ann Arbor, Michigan, USA).

Figure 1 Map of Central America and northern South America where 74 specimens of white-nosed coati (Nasua narica) were sampled for three mitochondrial genes (ND5, Cyt-b, and D-loop), 59 of which also sampled for the complete mitogenomes. Circles are proportional to the sample size. The colors of circles mark the different molecular groups detected and are the same colors shown in phylogenetic trees and the haplotype network.
Nucleotide sequences of the mtND5 and Cyt-b genes were translated into amino acid sequences to exclude the possibility of nuclear mitochondrial DNA segments (Numts; Lopez et al. 1994). All amino acid translations performed showed correct start and stop codons, and a total absence of termination codons. All the mutations observed were synonymous, which is well-related to the absence of Numts in the two mt genes mentioned.
For the mitogenomic analysis, DNA was extracted and isolated from the tissues mentioned above using the QIAamp DNA Micro Kit (Qiagen, Inc. Hilden, Germany) according to the manufacturer’s protocol. Mitogenomes were sequenced by “long-template PCR”, which minimizes Numts amplification (Thalmann et al. 2004; Raaum et al. 2005). The PCRs to obtain mitogenomes were performed with the LongRange PCR Kit (Qiagen, Inc. Hilden, Germany), with a reaction volume of 25 µL. The components of each reaction were 2.5 µL of 10x LongRange PCR Buffer, 500 mM of each dNTP, 0.6 mM of each primer, 1 unit of Long-Range PCR Enzyme, and 100-250 ng of DNA template. The temperature conditions of the PCRs were 94 °C for 5 min, followed by 45 cycles of 94 °C for 30 s, with an annealing temperature of 50-57 °C (depending on the primer set) for 30 s and an extension of 72 °C for 8 min. Afterward, there were 30 denaturation cycles at 93 °C for 30 s, with annealing temperatures of 45-52 °C (depending on the primer set) for 30 s, and an extension of 72 °C for 5 min, with a final extension of 72 °C for 8 min. Four sets of primers were used to generate overlapping amplicons: PROCYONID1F (ATGAGTAATCAGCCCTTGAT) and PROCYONID1R (ATGCATCCCACGTCAATCAT), approximately 5,000 bp; PROCYONID2F (AAGTAATATGTCTGACATAA) and PROCYONID2R (TCATCTGCATCTATTCTGA), approximately 4,000 bp, PROCYONID3F (CATTTAGAAGCTAATTAAGC) and PROCYONID3R (GTGCAACTCGAAATAAATGT), approximately 4,000 bp; PROCYONID4F (TAATTGTAATAAAGCTATTT) and PROCYONID4R (TGGCACATCTCGATGGAGTA), approximately 3,200 bp. These allowed observing the circularity of the mitochondrial genome (Bensasson et al. 2001; Thalmann et al. 2004). Both DNA strands were sequenced directly using BigDye Terminator v3.1 (Applied Biosystems, Inc., Foster City, California, USA). The sequencing products were analyzed in an ABI 3730 DNA Analyzer system (Applied Biosystems, Inc., Foster City, California, USA). The sequences were assembled and edited with the Sequencher 4.7 program (Gene Codes, Corp., Ann Arbor, Michigan, USA). The overlapping regions were examined for possible irregularities, such as termination codons. The absence of such irregularities is a valid indication of the absence of Numts. Genes were concatenated (about 16,200 bp) after removing any problematic region with the Gblocks 0.91 program (Talavera and Castresana 2007) under a relaxed approach. Individual alignments were concatenated with SequenceMatrix v1.7.6 (Vaidya et al. 2011) to create the final alignment.
The sequences were deposited in the NCBI GenBank under access numbers MT587713-MT587788, MW410859-MW410914, and MW419814-MW419853.
Phylogenetic analyses. The sequences were concatenated for phylogenetic analyses of the three mt loci studied because they showed the same phylogenetic signal. To this end, we used the ILD test (“Incongruence-length difference test”; Farris et al. 1995) in the mILD program (Planet and Sarkar 2005). The programs jModeltest v2.0 (Darriba et al. 2012) and MEGA 6.05 (Tamura et al. 2013) were applied to determine the best nucleotide substitution model, using the Akaike information criterion (AIC; Akaike 1974) and the Bayesian information criterion (BIC; Schwarz 1978).
A Maximum Likelihood (ML) analysis was performed as phylogenetic inference using the RAxML v.7.2.6 program (Stamatakis 2006) with the partition scheme selected by the PartitionFinder 2.0 program (Lanfear et al. 2012). This program was used to simultaneously determine the optimal model for nucleotide substitution (which coincided with that of jMoldeltest v2.0) and sequence partition scheme. For partitions, codons 1 + 2, and codon 3 were combined for each gene (for both Cyt-b and ND5 in the case of the data set with three loci and for each of the coding genes in the mitogenomic case. Additionally, RNA genes were included in the mitogenomic analysis and the control region for both data sets). The best-fit models were selected using BIC under a ‘greedy’ search scheme with a subset of models specific to RAxML. The GTR + G + I model (Tavaré 1986) was used for the ML tree search, as discussed in the Results section. The support for nodes was estimated using the “rapid-bootstrapping” algorithm with 1,000 nonparametric bootstrap replicates (Stamatakis et al. 2008). Clades were considered to have good nodal support when bootstrap values were greater than 70 % (loose limit; Hillis and Bull 1993).
The relationships between the haplotypes found were determined using the Median Joining Network algorithm (MJN; Bandelt et al. 1999) of the Network 4.6 program (Fluxus Technology Ltd). One advantage of MJN over phylogenetic trees is that it explicitly allows the coexistence of ancestral and descendant haplotypes, while phylogenetic trees treat all sequences as terminal taxa (Posada and Crandall 2001). This allows identifying which haplotypes were the first to originate and which are the most recently derived haplotypes (Freeland et al. 2011). Divergence times were calculated with the p statistic (Morral et al. 1994) and its standard deviation (Saillard et al. 2000) since this statistic can be transformed into years. This statistic is unbiased and highly independent of past demographic events. This approach is called a “borrowed molecular clock” and directly uses the nucleotide substitution rates estimated in other taxa (Pennington and Dick 2010). For the set of three mt genes, we used an evolutionary rate of 1.75 % per million years, representing one mutation every 22,742 years. For all mitogenomic data, the evolutionary rate used was 2.34 % per million years, equivalent to one mutation every 2,638 years. These evolutionary rates were reported for the family Canidae (Wayne et al. 1997). In the present work, this methodology was used to estimate divergence times as previous studies (Ruiz-García et al. 2020a, 2021a, b) used Bayesian inference methods to investigate the divergence between the species of Nasua, Nasuella, and Bassaricyon. However, the use of the MJN is preferable because the present study preferably analyzed the divergence times within N. narica, and there is a scarce fossil record for coatis. In fact, there are no fossil remains attributable to either N. narica or Nasuella, and those attributable to N. nasua do not exceed 0.125 MYA (Woodburne 2010), which significantly underestimates all studies of divergence times within procionids (Koepfli et al. 2007; Nigenda-Morales et al. 2019; Ruiz-García et al. 2019b, 2020a, 2021a, b).
Genetic heterogeneity and diversity. The statistics H ST, K ST, K ST*, γ ST, N ST, and F ST (Hudson et al. 1992) were calculated to determine the global genetic heterogeneity among the six genetic groups of N. narica detected with the phylogenetic methods used for both the set of three mt loci and the mitogenomic set. Indirect estimates of the genetic flow between the six genetic groups were obtained assuming an infinite island model (Wright 1965). Statistical significance was estimated using a permutational test with 10,000 replicates. Additionally, genetic heterogeneity and genetic flow statistics were estimated in pairs for the six groups detected. To this end, the F ST statistic was used with Markov chains with 10,000 dememorization parameters, 20 batches, and 5,000 iterations per batch. All analyses were carried out using the DNAsp 5.1 (Librado and Rozas 2009) and Arlequin 3.5.1.2 (Excoffier and Lischer 2010) programs.
We estimated the number of haplotypes (NH), haplotypic diversity (Hd), nucleotide diversity (π), and the statistic Ø per sequence in the DNAsp 5.1 program (Librado and Rozas 2009) for the total sample and for each of the six genetic groups detected by the phylogenetic analyses.
Spatial autocorrelation analysis. A total of four spatial analyses were applied to the set of three mt loci and three to the set of mitogenomes. The first analysis was a Spatial Analysis of Molecular Variance (SAMOVA) with the SAMOVA 1.0 program (Dupanloup et al. 2002) to assess the spatial structure in a geographic context. This program seeks to define geographically homogeneous groups of populations and maximize differentiation with other geographic groups. This would potentially facilitate the identification of genetic barriers between population groups. The method is based on a simulated annealing procedure that helps maximize the proportion of total genetic variance due to differences between population groups. We analyzed the number of different populations (k; from two to six), and the statistical significance was estimated with 1,000 permutations.
The second analysis was isolation by distance with the Mantel test (Mantel 1967) performed in the Alleles In Space 1.0 (AIS) program (Miller 2005). The matrix of genetic distances of the Kimura two-parameter model (Kimura 1980) between the different individuals of N. narica sequenced was compared with the matrix of Euclidean geographic distances between them. Statistical significance was estimated with 10,000 permutations.
The third procedure was a spatial autocorrelation analysis using the Ay statistic with AIS 1.0 (Miller 2005). This can be interpreted as the average genetic distance between pairs of individuals falling within a particular distance class (DC). Ay takes a value of 0 when all individuals within a DC are genetically identical and a value of 1 when all individuals within a DC are completely different. The probability for each DC was obtained using 10,000 permutations. To carry out this analysis, we defined 10 DCs constructed using DCs of identical size (in km) with unequal sample size per DC for the set of three mt loci (DC 1: 0-183 km; DC 2: 183-366 km; DC 3: 366-549 km; DC 4: 549-732 km; DC 5: 732-915 km; DC 6: 915-1,098 km; DC 7: 1,098-1,281 km; DC 8: 1,281-1,464 km; DC 9: 1,464-1,647 km; DC 10: 1,647-1,831 km), and 10 DCs constructed with unequal CDs but with approximately the same sample sizes per DC for mitogenomic data (DC 1: 0-26 km; DC 2: 26-83 km; DC 3: 83-183 km; DC 4: 183-270 km; DC 5: 270-337 km; DC 6: 337-381 km; DC 7: 381-547 km; DC 8: 547-730 km; DC 9: 730-1,089 km; DC 10: 1,089-2,298 km). The specimens were connected to the Gabriel and Sokal network (Gabriel and Sokal 1969) and other types of networks (Ruiz-García 1993, 1994, 1997, 1999; Ruiz-García and Álvarez 2000).
The fourth analysis was the Monmonier algorithm (Monmonier 1973; MMDA) with the AIS 1.0 program (Miller 2005). This geographic regionalization method was used to detect putative geographic barriers to gene flow by iterative identification of contiguous sets of high genetic distances across connectivity networks (Doupanloup et al. 2002; Manel et al. 2003; Manni et al. 2004). The Delaunay triangulation was used (Watson 1992; Brouns et al. 2003) to generate the connectivity network between sampling points. A graphic representation of the putative geographic barriers inferred by the algorithm was overlaid on the connectivity network to facilitate the detection of likely geographic obstacles reflected in the sequence data. In this case, the procedure was used to identify the five most important possible putative geographic barriers for the set of three mt loci.
Results
Phylogenetic analysis for three mitochondrial loci and for complete mitogenomes. The optimal nucleotide substitution models for the set of three mt loci were TN93 + G for CIA (-Ln = 11,861.36) and GTR + G + I for CIB (-Ln = 17,332.27); for the mitogenomic set, the optimal nucleotide substitution model was GTR + G + I for CIA (-Ln = 55,535.88) and TN93 + G for CIB (-Ln = 63,912.52). For the phylogenetic analyses, we used the GTR + G + I model since it was one of the two optimal models in all cases and is a model implemented in the programs used.
In the ML tree (Figure 2) with three mt loci, the N. nasua clade had good nodal support and was the sister group of the other clades (Bootstrap Support, BS = 100). An interesting finding is the inclusion in this clade of three specimens that a priori would correspond to N. narica based on their phenotype and geographic origin. The first is a specimen from Robinson Crusoe Island (Chile). The other two specimens were collected in northern Colombia. In both cases, the analysis with three mt genes showed that they were highly related (BS = 95). The remaining clades found in N. nasua were already analyzed in detail by Ruiz-García et al. (2021a).

Figure 2 Maximum Likelihood Tree showing the phylogenetic relationships of 74 specimens of white-nosed coati (Nasua narica) for three mitochondrial genes (ND5, Cyt-b, and D-loop). The mountain or Andean coati, Nasuella olivacea, and the South American coati, Nasua nasua, were used as external groups. Numbers on nodes are bootstrap percentages greater than 70 %. The number of specimens sampled in a given locality is shown in parenthesis.
The clade of N. olivacea also had high nodal support (BS = 95) and was the sister group of N. narica; this may be considered evidence that the genus Nasuella could be included in the genus Nasua (Ruiz-García et al. 2021b). On the other hand, a group of five specimens of N. narica distributed in southern Costa Rica, Panama, and northern Colombia (Antioquia and Choco) - the typical distribution of N. narica - with an undoubted morphotype of this species, nested within the N. olivacea clade. This group (BS = 72), which we named G6, has a mitochondrial DNA clearly introgressed by N. olivacea.
The N. narica group was monophyletic (BS = 74) and was composed of five distinct genetic groups. The first (G1; BS = 79) comprised two specimens from the trans-Andean (Pacific) part of Ecuador (Guayas province). The second group (G2; BS = 97) is composed of two specimens sampled in Yucatán (México). The third genetic group (G3; BS = 81) is formed by specimens sampled in northern Costa Rica, Nicaragua, El Salvador, Honduras, and southern Guatemala. It should be noted that an Ecuadorian Amazonian specimen with the phenotype of N. narica (Macas, province of Morona-Santiago) was included in this clade. The fourth group (G4; BS = 91) consisted of specimens distributed in the northwestern part of Guatemala and Belize; however, two specimens from the Pacific coast of Ecuador (Guayas province) were also included in this group. Finally, the fifth genetic group (G5; BS = 90) comprised specimens from northwestern Guatemala and southern México, with specimens from Quintana Roo (including Cozumel Island), Campeche, Chiapas, Tabasco, and Yucatán.
The ML tree (Figure 3) with mitogenomic data was similar to the previous one, with minor differences. Nasua nasua was the sister clade of all others (BS = 87). The specimen from Robinson Crusoe Island (Chile) was included in this taxon. Contrary to the ML tree calculated with three mt loci, one specimen of N. narica from central-northern Costa Rica was shown to be the most divergent within the N. nasua clade. The N. olivacea clade (BS = 99) was the sister group of N. narica (BS = 87); it included the genetic group (MG6) of N. narica (BS = 98), with which the complete mitogenomes confirmed the genetic introgression of one group of N. olivacea in the distribution range of N. narica in southern Central America and northern Colombia. In the present tree, the specimen from PN Tamá (North of Santander, Colombia) forms a polytomy with the genetic groups MG1 (BS = 91) and MG3 (BS = 99). This was followed by the subsequent divergence of groups MG2 (BS = 93; in this case, a third specimen from the Yucatán Peninsula was added, which had been included in G5 in the previous tree), MG4 (BS = 85), and MG5 (BS = 94).

Figure 3 Maximum Likelihood Tree constructed with the complete mitogenomes of 59 specimens of white-nosed coati (Nasua narica). The mountain or Andean coati (Nasuella olivacea) and the South American coati (Nasua nasua) were used as external groups. Numbers on nodes are bootstrap percentages greater than 70 %. The number of specimens sampled in a given locality is shown in parenthesis.
The haplotype network (Figure 4) for the set of three mt loci showed that the earliest ancestral N. narica haplotypes would have derived from N. nasua haplotypes; these specimens already displayed the distinctive phenotype of N. narica and with haplotypes very close to one of the external groups. These were found in the trans-Andean and Pacific zones of Ecuador (H2 and H4), along with the haplotype of the specimen from the Ecuadorian cis-Andean (Amazon) zone (H3) that had been included in G3 in the phylogenetic trees for the three mt loci. In other words, the first N. narica (with explicit phenotypes of this species) with haplotypes already differentiated from those of N. nasua and closer to the Central American N. narica are found in Ecuador, in the trans-Andean and cis-Andean areas (G1). From this group (haplotypes that were gradually differentiated from the external group), G3 would have emerged, distributed in the south-central zone of Central America, with H20 occupying the central position in the analysis (El Salvador, Honduras, and southern Guatemala). G5 would have later derived from G3, with H14 at the central position in the analysis (northern Guatemala and México, including Chiapas, Tabasco, Campeche, and part of Yucatán). G4 derived from G5 (northwestern Guatemala and Belize, although these groups also included haplotypes from the trans-Andean zone of Ecuador). Finally, G6 clearly showed that it was introgressed by N. olivacea, as reflected by phylogenetic trees. In this network of haplotypes, G2, clearly visible in the trees mentioned above, does not form a well-consolidated group. One haplotype (H24) appears as derived from a non-sampled haplotype between G3 and G5, and another haplotype (H7) appears as derived from G5.
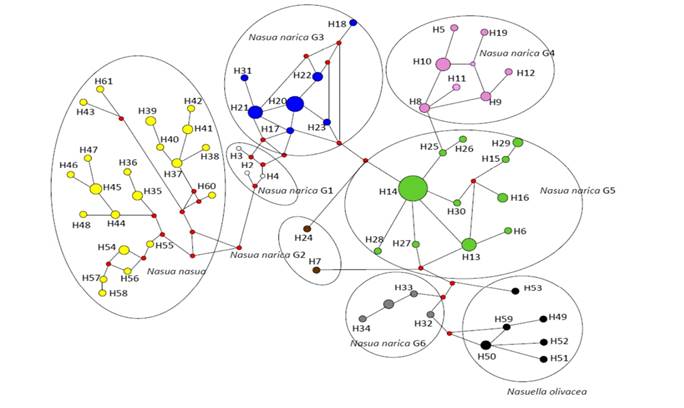
Figure 4 Median Joining Network procedure applied to the haplotypes found in 74 specimens of white-nosed coati (Nasua narica) for three mitochondrial genes (ND5, Cyt-b, and D-loop). The haplotypes of eight mountain or Andean coatis (Nasuella olivacea) and 29 South American coatis (Nasua nasua), were used as external groups. White = haplotypes of G1 specimens; brown = haplotypes of G2 specimens; blue = haplotypes of G3 specimens; pink = haplotypes of G4 specimens; light green = haplotypes of G5 specimens; gray = haplotypes of G6 specimens; black = haplotypes of N. olivacea specimens; yellow = haplotypes of N. nasua specimens; small red circles indicate intermediate haplotypes that were not found.
Divergence times within and between N. narica groups. For the matrix of three mt loci, using the MJN, the time elapsed for the G1 haplotype to give rise to all the Central American haplotypes derived from it was 4.06 ± 0.93 million years ago (Mya). On the other hand, for the mitogenomic data set, the divergence between the intermediate haplotype of the N. narica specimen from central-northern Costa Rica and all other Central American haplotypes detected occurred 3.16 ± 0.34 Mya. The time elapsed since G1 gave rise to the first G3 haplotype was estimated at 2.20 ± 0.27 Ma for the set of three mt loci and 1.21 ± 0.02 Mya between the intermediate Costa Rican haplotype and the first MG3 haplotype, respectively. The time of divergence since the G3 generated all the other northernmost haplogroups in Central America was 1.93 ± 0.54 Mya and the time between the G3 haplotype and the emergence of G5 from it was 1.07 ± 0.30 Mya. The same divergence times with mitogenomic data were 0.82 ± 0.15 Mya and 0.36 ± 0.01 Mya, respectively. The time elapsed since G5 gave rise to the first G4 haplotype was estimated at 0.12 ± 0.27 Mya for the set of three mt loci and 0.09 ± 0.02 Mya for the mitogenomic set, respectively. Additionally, the time of divergence between the nearest N. narica haplotypes and the N. narica haplotypes introgressed by N. olivacea was 4.4 ± 0.15 Mya for the set of three mt loci and 2.34 ± 0.08 Mya for the mitogenomic set, respectively. Finally, the temporal separation between the present N. olivacea haplotypes and those of G6 (MG6) (N. narica introgressed by the latter species) was 2.32 ± 0.34 Mya for the set of three mt loci and 0.73 ± 0.08 Mya for the mitogenomic data. In general, for most estimates, the divergence times estimated with mitogenomic data are shorter than those estimated with the set of three mt loci. Additional divergence times are shown in Table 1.
Table 1 Divergence times within the different groups of white-nosed coati (Nasua narica) detected through its geographic distribution range in Central America and northern South America. A) Based on three mitochondrial genes (ND5, Cyt-b, and D-loop); B) based on complete mitogenomes. SD = Standard Deviation. Time in millions of years.
| Groups of Nasua narica | Divergence Times + SD |
|---|---|
| A | |
| Within G1 | 2.99 + 0.69 |
| Within G3 | 0.25 + 0.11 |
| Within G4 | 0.49 + 0.18 |
| Within G5 | 0.60 + 0.13 |
| Within G6 | 2.47 + 0.77 |
| B | |
| Within MG1 | 1.34 + 0.16 |
| Within MG3 | 0.15 + 0.04 |
| Within MG4 | 0.41 + 0.09 |
| Within MG5 | 0.12 + 0.03 |
| Within MG6 | 0.37 + 0.09 |
Genetic heterogeneity and diversity within and among Nasua narica groups. The analysis of genetic heterogeneity for the six genetic groups of N. narica detected from phylogenetic analyses for the matrix of three mt loci showed a significant global genetic differentiation (γST = 0.734, p < 0.0001; F ST = 0.658, p < 0.0001; Table 2). The global genetic flow estimates showed low values among these groups, taken globally (Nm γST = 0.18; Nm FST = 0.26). The same analysis including only the four Central American groups (excluding G1 and G6) also showed high and significant values (γ ST = 0.599, p < 0.0001; F ST = 0.496, p < 0.0001; Table 2), and genetic flow estimates were also low (Nm γST = 0.33; Nm FST = 0.51). These results are consistent with the mitogenomic data (γ ST = 0.755, p < 0.00001; F ST = 0.775, p< 0.00001; Table 2), with low genetic flow values (Nm γST = 0.16; Nm FST = 0.14).
The analysis of paired genetic heterogeneity of genetic groups with data from three mt loci showed that all comparison pairs were significant (Table 3), except for the pair G1 vs. G2 (p = 0.331). The highest genetic flow was estimated between G1and G2 (Nm = 0.504) and the lowest between G3 and G6 (Nm = 0.038; Table 4). The mitogenomic data showed similar results. The only pair of groups with a nonsignificant difference was between MG1 and MG2 (p = 0.103; Table 3). The highest estimate of genetic flow was between the pair of groups MG1 and MG2 (Nm = 0.578) and the lowest between G5 and G6 (Nm = 0.021; Table 4). Therefore, there is very high genetic heterogeneity among the six groups detected with phylogenetic methods.
The levels of global genetic diversity for both three-loci-based data and mitogenomic data (Supplementary Table 2) are high. By group, G1 (MG1), G2 (MG2), and G6 (MG6) showed the highest levels of genetic diversity for both the three-loci mt matrix and the mitogenomic matrix. The groups that showed the lowest levels of genetic diversity were G3 and G5 for both the data with three mt loci and mitogenomic data.
Spatial structure in N. narica. With the three mt loci, the maximum differentiation was observed between four groups (F CT = 0.702, p < 0.0001), i. e., G6, G1, G2, and the set of G3, G4, and G5. With mitogenomes, the maximum differentiation occurred between two groups (F CT = 0.817, p < 0.0001), namely, between MG6 and all the other groups of N. narica, regardless of their geographic location (Supplementary Table 3).
Table 2 Statistics of genetic heterogeneity and gene flow comparing simultaneously the different groups of white-nosed coati (Nasua narica) detected in Central America and northern South America. A) Based on three mitochondrial genes (ND5, Cyt-b, and D-loop) for six different groups (four in Central America and two in northern South America); B) based on three mitochondrial genes (ND5, Cyt-b, and D-loop) for four groups in Central America; C) based on mitogenomes for all groups detected. ** p < 0.01, df = degrees of freedom. Nm = Gene Flow statistic. Nm 1 = Gene flow obtained with the γST statistic; Nm 2 = gene flow obtained with the N ST statistic; Nm3 = gene flow obtained with the F ST statistic.
| Genetic Heterogeneity and gene flow statistics | Values | Probabilities |
|---|---|---|
| A | ||
| X 2 | 360.000 df = 165 | 0.00001** |
| H ST | 0.1732 | 0.00001** |
| K ST | 0.6718 | 0.00001** |
| K ST* | 0.5162 | 0.00001** |
| ZS | 492.11 | 0.00001** |
| ZS* | 5.8609 | 0.00001** |
| Snn | 0.9563 | 0.00001** |
| γ ST | 0.7344 | 0.00001** |
| N ST | 0.6689 | 0.00001** |
| F ST | 0.6578 | 0.00001** |
| Nm1 | 0.18 | |
| Nm2 | 0.25 | |
| Nm3 | 0.26 | |
| B | ||
| X 2 | 195.000 df = 81 | 0.00001** |
| H ST | 0.1651 | 0.00001** |
| K ST | 0.5269 | 0.00001** |
| K ST* | 0.4456 | 0.00001** |
| ZS | 465.6 | 0.00001** |
| ZS* | 5.8262 | 0.00001** |
| Snn | 0.967 | 0.00001** |
| γ ST | 0.5995 | 0.00001** |
| N ST | 0.4963 | 0.00001** |
| F ST | 0.4956 | 0.00001** |
| Nm1 | 0.33 | |
| Nm2 | 0.51 | |
| Nm3 | 0.51 | |
| C | ||
| X 2 | 996.000 df = 240 | 0.00001** |
| H ST | 0.0112 | 0.00069** |
| K ST | 0.7068 | 0.00001** |
| K ST* | 0.3718 | 0.00001** |
| ZS | 2262.6 | 0.00001** |
| ZS* | 5.211 | 0.00001** |
| Snn | 0.9464 | 0.00001** |
| γ ST | 0.755 | 0.00001** |
| N ST | 0.7862 | 0.00001** |
| F ST | 0.7755 | 0.00001** |
| Nm1 | 0.16 | |
| Nm2 | 0.14 | |
| Nm3 | 0.14 |
The results of the Mantel test were significant for the matrices of three mt loci and mitogenomes. In the first case, geographic distance significantly explained 30.59 % of the genetic distances between the specimens analyzed (r = 0.553, p = 0.00009); in the second, geographic distance significantly explained 23.81 % of genetic distances (r = 0.488, p = 0.0014). In general, evidence of isolation by distance was detected in the geographic distribution of N. narica.
The spatial autocorrelation analysis showed evidence of spatial structure. For the matrix with three mt loci, the global correlogram was statistically significant (V = 0.0361, p < 0.000001). The first two distant classes (DCs) showed a significant positive spatial autocorrelation (DC 1: p = 0.000001; DC 2: p = 0.000001). This indicates that in areas around 360 km in in diameter there are specimens more genetically similar to each other than expected at random. From DC 6, all spatial autocorrelation values were significantly negative (DC 6: p = 0.0021; DC 7: p = 0.0026; DC 8: p = 0.0001; DC 9: p = 0.0003; DC 10: p = 0.0002). That is, from 1,098 km to 1,831 km, genetic differentiation progressively increased. Similar results were obtained with mitogenomic data. The overall correlogram was statistically significant (V = 0.0146, p < 0.0008), with the first six DCs showing a significant positive spatial autocorrelation (DC 1: p = 0.00001; DC 2: p = 0.026; DC 3: p= 0.0175; DC 4: p = 0.0338; DC 5: p = 0.000001; DC 6: p = 0.0365). This indicated a strong genetic similarity between specimens geographically separated by a distance of about 380 km between them. This value is very similar to the one reported above for the first spatial autocorrelation analysis. DCs 9 and 10 yielded a significant negative spatial autocorrelation (DC 9: p = 0.0071; DC 10: p = 0.0023). That is, genetic differentiation increased from 729 km to 2,297 km. Therefore, both analyses show a clear monotonic cline in northern South America and Central America.
The analysis with the Monmonier algorithm (Figure 5) was performed for only three mt loci. The first barrier detected differentiated the geographic area corresponding to G6 specimens introgressed by N. olivacea. The second barrier demarcated a geographic area correlated with the area where part of the G4 specimens are interspersed (Belize) with part of the G5 specimens (Cozumel Island and part of Yucatán). The third barrier bordered the geographic area corresponding to G2 specimens (Yucatán). The fourth barrier delimited the geographic area that included G1 specimens (Ecuadorian Pacific). The fifth barrier marked the geographic area that was aligned with the trans- and cis-Andean zones of Ecuador but with specimens more genetically related to the Central American group G3. The geographic structure of N. narica in Central America and northern South America is very pronounced.
Discussion
Systematics of N. narica. This article reports the population phylogeographic and genetic analysis encompassing the broadest geographic extension of the distribution range of N. narica to date and uses complete mitogenomes for this species for the first time. From a strictly systematic standpoint, this analysis provides new evidence for the re-interpretation of the systematics of this species.
The genetic distances between the different N. narica groups found are smaller than those observed in N. nasua (Ruiz-García et al. 2020a, 2021a). The values ranged from 1.6 % to 4.5 %, typical of well-differentiated populations or subspecies (Kartavtsev 2011). This is consistent with the fact that the ancestor of the present N. narica is considerably more recent than the ancestor of the present N. nasua, which, in turn, shows that the mitochondrial evolution of coatis occurred in South America in the first place and then in Central America. This conclusion contrasts with the traditional paleontological view that the current coatis migrated from North to South America in the early Pleistocene. The arrival of the first procionids in South America produced endemic forms (Argentina) such as Cyonasua and Chapalmalania (Soibelzon and Prevosti 2013) around 7.3 Mya. However, paleontologists consider that these procionids became extinct and did not give rise to the present Nasua. They are considered to have arrived in South America in a second migratory wave of procionids during GABI 4 (Woodburne 2010), which occurred during the Lujanense (126,000-8,500 before present, BP) and Platense (8,500-1,500 BP) ages. However, N. nasua haplotypes started to differentiate in situ in northwestern South America some 13-10 Mya (Ruiz-García et al. 2020a, 2021a, b), preceding the diversification of N. narica haplotypes (also in northwest South America) 4.1-3.2 Mya. These findings indicate a south-to-north migration of the current coatis, opposite to the direction suggested by paleontologists.
Four morphological subspecies of N. narica have been considered in recent decades (Gompper 1995): N. n. molaris, N. n. nasua, N. n. nelsoni, and N. n. yucatanica. In particular, N. n. nelsoni has been considered a full species (N. nelsoni). However, the present study showed at least six genetically distinct groups.

Figure 5 Analysis of the Monmonier algorithm to detect the five most important geographic barriers in the geographic distribution range of the samples of white-nosed coati (Nasua narica) analyzed from Central America and northern South America. A) Geographic area analyzed; B) Geographic barriers for 74 specimens of N. narica sequenced for three mitochondrial genes (ND5, Cyt-b, and D-loop).
The first group (G1, MG1) is distributed in northwestern South America. We have detected haplotypes of this group in the Ecuadorian Pacific and, in the mitogenomic study, also in one specimen from northern Colombia (PN Tamá, North of Santander). Traditionally, the coatis of the trans-Andean and Pacific Colombian and Ecuadorian areas have been classified as N. narica (Emmons 1990; Emmons and Feer 1997; Tirira 2007, 2011); however, some authors (Gompper 1995; Nowak 1999) suggest that the coati living in the Pacific area of Colombia and Ecuador is N. nasua based on its morphological traits.
Our research showed that some of those specimens might be intermediate forms between N. nasua and N. narica. The specimens in this group from the Ecuadorian Pacific had external phenotypes (coloration and fur pattern) typical of N. narica. However, Ruiz-García et al. (2021a) observed that most specimens with the N. narica phenotype in the trans-Andean and Pacific areas of Ecuador had the mitochondrial haplotypes typical of N. nasua. The study also detected specimens in the Ecuadorian Pacific with intermediate morphotypes between N. nasua and N. narica. That study also showed that the N. narica haplotypes of the Ecuadorian Pacific and North Santander (Colombia) had originated from an N. nasua haplotype distributed in the Colombian and Ecuadorian Amazon. One specimen from the Colombian Pacific (not included in this study; Buenaventura, Valle del Cauca) with an intermediate phenotype between N. narica and N. nasua showed inconclusive results according to different molecular analyses performed (Ruiz-García et al. 2021a). In fact, in the present study, we detected one specimen of PN Tamá (located in an area where N. nasua and N. narica allegedly converge), which, despite having the distinct N. narica morphotype, resembled N. nasua in the analysis with three mt genes (not so in the mitogenomic analysis). The analysis with three mt genes also included one specimen (Turbo, Antioquía, Colombia; border area between Colombia and Panama) with a morphotype closer to N. nasua but within a distribution area typical of N. narica. The analysis based on three mt loci associated this specimen with the previous specimen within the N. nasua clade. Unfortunately, that specimen could not be sequenced for its complete mitogenome because of the poor quality of its DNA. However, there is evidence on the Pacific coast of Ecuador and Colombia, and in northern Colombia, of specimens with a full N. narica morphotype and with mitochondrial haplotypes intermediate between N. nasua and Central American N. narica, albeit closer to the latter. Ruiz-García et al. (2020a, 2021ab) showed that the haplotypes of N. nasua and N. olivacea diverged in South America before those of N. narica. The existence of intermediate haplotypes between N. nasua and N. narica are particularly well-detected in the haplotype networks of the Ecuadorian Pacific and northern Colombia.
Table 3 F ST statistic for paired groups of white-nosed coati (Nasua narica) analyzed in Central America and northern South America. Below the diagonal, based on three mitochondrial genes (ND5, Cyt-b, and D-loop) (G); above the diagonal, based on mitogenomes for all groups detected (MG). * p < 0.05; ** p < 0.01.
| Groups of Nasua narica | G1 (MG1) | G2 (MG2) | G3 (MG3) | G4 (MG4) | G5 (MG5) | G6 (MG6) |
|---|---|---|---|---|---|---|
| G1 (MG1) | 0.463 | 0.786** | 0.564* | 0.803** | 0.910 | |
| G2 (MG2) | 0.498 | 0.734** | 0.629** | 0.723** | 0.823 | |
| G3 (MG3) | 0.822** | 0.833** | 0.697** | 0.723** | 0.952** | |
| G4 (MG4) | 0.771** | 0.788* | 0.764** | 0.578** | 0.928** | |
| G5 (MG5) | 0.817** | 0.834** | 0.652** | 0.615** | 0.960** | |
| G6 (MG6) | 0.849* | 0.810* | 0.928** | 0.912* | 0.735* |
The case of the assumed N. narica from Robinson Crusoe Island in the Chilean Pacific might represent a hybridization event. In the 1950s, a couple of Germans introduced coatis to fight rodent pests on the island. The morphotype of these island animals matches N. narica. However, this study, together with that of Ruiz-García et al. (2021a), showed that the mtDNA of that specimen behaved like N. nasua. The coatis introduced to those islands likely came from the Ecuadorian Pacific with the typical phenotype of N. narica but with the mtDNA of N. nasua that characterizes part of the coatis inhabiting the Pacific slope of Ecuador.
The problem with N. narica from Ecuador and Colombia is that they have not been assigned a sub-specific denomination because it has recently been considered that this species is not present in the Pacific zone of these two countries. It would be very important to perform morphological and molecular analyses of the N. nasua holotypes or paratypes described for the trans-Andean and Pacific areas of Ecuador. The holotype described for this Ecuadorian area was first named N. nasua manium (Thomas 1912), but a more recent paratype was also described for the same area, N. nasua gualeae (Lönnberg 1921; Type locality: Gualea, province of Pichincha, Ecuador). If either of these two taxa could be analyzed at molecular level and had N. narica mtDNA, then the G1 (MG1) specimens could be assigned to N. narica manium or N. narica gualeae, with preference for the first name.
Therefore, our results drastically change the traditional view of the existence of only N. narica on the Colombian and Ecuadorian Pacific coast and challenge the idea of the absence of this species in that geographic area, as claimed by other authors (Gompper 1995; Nowak 1999). Indeed, most coatis living in the Pacific trans-Andean zone of Colombia and Ecuador belong to N. nasua. However, a small proportion of individuals in this geographic area show the oldest N. narica haplotypes found to date with a morphotype very similar to the Central American populations (present study and Ruiz-García et al. 2021a). Additionally, in the Ecuadorian Pacific, we detected two specimens (for the set of three mt loci, only one for mitogenomes) with the N. narica phenotype and the typical Central American G4 (MG4) haplotypes. Furthermore, an Ecuadorian cis-Andean animal (Macas, Morona-Santiago province, Ecuadorian Amazon) showed the typical Central American G3 haplotype. This would indicate that an N. narica haplotype would have crossed the Andes mountain range; however, we currently ignore whether this crossing was natural or resulted from humans transporting animals through the Ecuadorian Andean Cordillera. The fact that the Macas specimen showed a haplotype with some nucleotide differentiation relative to the G1 haplotypes leads us to think that the crossing of the Cordillera was not recent, likely a natural process.
Therefore, nuclear genes should be analyzed to determine the degree of hybridization or introgression (if any) between the small proportion of coatis with N. aff. narica phenotype and mtDNA (defined in this study as N. narica) and the largest proportion of specimens, many of them also with phenotypes with N. narica traces but with mtDNA belonging to different N. aff. nasua haplogroups (defined herein as N. nasua), especially in the Ecuadorian area considered. Nuclear DNA sequencing could contribute to defining the coati systematics. Additionally, our results indicate that in the Pacific area and northern Colombia there is another group of N. narica (G6, MG6) introgressed with mtDNA of N olivacea. These new findings are relevant to the conservation policies of coatis in Colombia and Ecuador.
Table 4 Estimated gene flow between six groups of white-nosed coati (Nasua narica) analyzed in Central America and northern South America. Below the diagonal, based on three mitochondrial genes (ND5, Cyt-b, and D-loop) (G); above the diagonal, based on mitogenomes for all groups detected (MG).
| Groups of Nasua narica | G1 (MG1) | G2 (MG2) | G3 (MG3) | G4 (MG4) | G5 (MG5) | G6 (MG6) |
|---|---|---|---|---|---|---|
| G1 (MG1) | 0.578 | 0.136 | 0.387 | 0.122 | 0.049 | |
| G2 (MG2) | 0.504 | 0.182 | 0.295 | 0.182 | 0.107 | |
| G3 (MG3) | 0.108 | 0.100 | 0.218 | 0.191 | 0.025 | |
| G4 (MG4) | 0.148 | 0.134 | 0.155 | 0.365 | 0.039 | |
| G5 (MG5) | 0.118 | 0.099 | 0.267 | 0.312 | 0.021 | |
| G6 (MG6) | 0.088 | 0.117 | 0.038 | 0.048 | 0.041 |
In Central America, the situation would be as follows: 1) N. n. molaris, from the north-central and Pacific areas of México to southern USA, was not represented in our samples. However, Silva-Caballero et al. (2017) showed with the mt Cyt-b gene, on the one hand, a clade including the haplotypes of the Mexican Pacific coast (Punta Raza and Chamela-Cuixmala, Nayarit and Jalisco, respectively) and, on the other hand, a clade comprising the haplotypes of central México (El Tepozteco; Morelos) and southeast México (La Venta and Puerto Morelos, Tabasco and Quintana-Roo, respectively). In fact, the highest F ST statistic was between one of the Pacific populations (Chamela-Cuixmala) and the central population (El Tepozteco; F ST = 0.125, p < 0.05). The same trend was observed with nuclear microsatellites. With the R ST statistic (0.995; p < 0.05), the most differentiated populations were those of Chamela-Cuixmala (Mexican Pacific) and Puerto Morelos in the Yucatán Peninsula; with the F ST statistic 0.258; p < 0.05), the most differentiated populations were Punta Raza (Mexican Pacific) and El Tepozteco (Central México). Likewise, Nigenda-Morales et al. (2019) detected five distinct groups in the sample of N. narica studied with both mitochondrial sequences and nuclear microsatellites. Three of these groups were detected in the geographic area attributed a priori to N. n. molaris. These three groups were distributed in the Mexican Pacific, Central México, and southwestern United States. The N. n. molaris holotype comes from Colima in the Mexican Pacific. Therefore, the Mexican Pacific group can be related to N. n. molaris. In contrast, the other two groups found by Nigenda-Morales et al. (2019) in central-northern México and southwestern USA may correspond to pallida (Allen 1904), tamaulipensis (Goldman 1942), vulpecula (Erxleben 1777), or solitaria var. mexicana (Weinland 1860); the respective holotypes should be analyzed to confirm those denominations. 2) N. n. narica, whose holotype comes from the State of Veracruz corresponds well with our fifth genetic group (G5, MG5). It also corresponds to one of the groups detected by Nigenda-Morales et al. (2019) in the Yucatán Peninsula and Guatemala. 3) N. n. yucatanica, whose holotype comes from “Merida in the Yucatán Peninsula”, may be represented by our second genetic group (G2, MG2). However, this group, which comprises a few specimens, shows a high internal genetic heterogeneity and a variable relationship with other groups according to the analyses used. An extensive molecular study is needed in the Yucatán and north Quintana Roo since this area appears to have a highly marked genetic structure at the micro-geographic level. We have detected specimens in the area of Mérida separated by a few kilometers, belonging to groups G2 and G5, suggesting the possibility of areas with hybrid specimens of these two groups in that Mexican state. 4) N. n. nelsoni or N. nelsoni is typical of Cozumel Island. We only studied one specimen from this area, which was included in G5. Likewise, Nigenda-Morales et al. (2019) analyzed nine specimens from this island and found no obvious differentiation between these specimens and those from the Yucatán and north Guatemala discussed above. Therefore, molecular evidence seems to reject the validity of N. n. nelsoni (N. nelsoni). The only possibility for this taxon to be valid is that the specimen studied by us, and the nine specimens analyzed by Nigenda-Morales et al. (2019) had been recently introduced by human activities from southern México to Cozumel, and that an original population persists in the island, which had not been sampled in either of the two works. Otherwise, this taxon would have no systematic validity since it could have been introduced to the island in relatively recent historical times. The smaller body size of the coati of Cozumel Island may have been generated over a few generations through natural selection as an adaptation to a small island with few food resources. We agree with Glatston (1994) that this coati was introduced to Cozumel by the Mayans, although we do not agree that N. nelsoni is a full species. Similarly, the coati sampled on Roatán Island (Honduras) had the same haplotype as the others found in G3 (MG3), suggesting that it was recently introduced in that locality by human action.
However, three of the genetic groups detected here (and one of those found by Nigenda-Morales et al. 2019, which corresponds to our G6-MG6) do not match any putative morphological subspecies of N. narica. Two of these groups, G3 and G4, were not observed by Nigenda-Morales et al. (2019) because these authors did not collect samples in Honduras, southern Guatemala, El Salvador, Nicaragua, and Costa Rica (only a single specimen was analyzed). Thus, the subspecific name for these two groups remains to be established. A more complex matter is the likely subspecies designation of G6 (MG6). This group, distributed across southern Costa Rica, Panama, and the border area between northern Colombia and Panama, is introgressed with mt DNA of N. olivacea. We propose an ancient introgression with mtDNA from N. olivacea to the genetic stock of N. narica in the border zone between South America and the south of Central America. In the first place, this hypothesis is supported, by the MJN analysis showing a temporal separation between G6 (MG6) haplotypes and N. olivacea haplotypes, both located in the same clade at 2.3 Mya for the set of three mt loci and 0.8 Mya for the mitogenomic set. Secondly, the introgressed specimens lack an intermediate morphotype between N. narica and N. olivacea, but showed the typical morphotype of N. narica. Third, the five specimens studied in southern Costa Rica, Panama, and the area bordering Colombia, and the 13 specimens analyzed by Nigenda-Morales et al. (2019), showed N. olivacea mtDNA in all cases. If a recent hybridization event had caused this phenomenon, we would expect the N. olivacea mtDNA in one specimen, but not in all specimens sampled in that area. A possible subspecific denomination could be N. narica panamensis (Allen 1904). However, only molecular analysis of the respective holotype may solve this issue because an alternative possibility is that this subspecific denomination may correspond to G3.
In summary, considering Nigenda-Morales et al. (2019) and the present study, at least nine genetically differentiated N. narica groups are detectable across its geographic range. Three of the morphological subspecies described would match three of the genetic groups mentioned, one morphological subspecies described should be invalid, and six new subspecific names should be proposed. The large number of groups found in the present study may respond to different geographic, geological, and ecological causes. In the case of coatis, their behavior is also relevant since they have high levels of phylopatry and a limited dispersal capacity (Frantz et al. 2010). They form groups with a small territorial range of 0.5 to 4 km2 (Valenzuela and Ceballos 2000; Hirsch and Gompper 2017). Being barely dispersed from the birth site, the groups, mainly formed by females, are strongly bonded. Occasionally, males that moved up to 20 km away from their birth sites have been detected (Lanning 1976). However, estimates of gene flow between populations in México (Silva-Caballero et al. 2017) or Central and South America (Nigenda-Morales et al. 2019 and the present study) show that the coati groups are virtually genetically isolated.
Colonization dynamics and evolutionary times of the different N. narica groups found. The results obtained are useful for reconstructing the evolutionary history of N. narica; to this end, different hypotheses are proposed regarding the origin of each of the N. narica groups detected. The analysis of three mt loci suggests the following colonization schemes: 1) The first group to emerge was the Ecuadorian (G1) ( → = gave rise), which gave rise to two separate colonization events in Central America. The oldest was of G1 → Yucatán Peninsula (G2) and, on the other hand, G1 → south-central Central America (G3) (northern Costa Rica, Nicaragua, El Salvador, Honduras, and part of Guatemala). G3 → G4 (southern Guatemala and Belize) → G5 (northern Guatemala and southern México). In this hypothesis, some differential nuances can be considered to explain the existence of two Ecuadorian trans-Andean specimens in G4 and one Ecuadorian cis-Andean specimen in G3. There are two alternatives. The first is that the oldest haplotypes of G3 and G4 were generated in situ in South America, followed by subsequent colonization events to Central America. Some of the original haplotypes that expanded through Central America would still “survive” in the Ecuadorian trans-Andean area. The second is that these haplotypes of G3 and G4 emerged in situ in Central America from G1, but there was a subsequent migration of individuals with haplotypes originating in Central America, again, to South America. Besides, in northern South America, an N. narica group was introgressed with mt DNA of N. olivacea and another colonization event took place from northern South America to southern Central America. This hypothesis is consistent with three mitochondrial colonization events from northern South America to Central America, with the G5 haplotypes (southern México and northern Guatemala) being the most recent ones and the G1 haplotypes (Pacific coast of Ecuador) as the original ones. 2) Based on the MJN analysis, only two colonizing events from northern South America to Central America would be considered. In this case, G1 → G3 → G5 → G4, and G2, and the additional colonization with the introgression of N. olivacea. All other details would be identical to the previous hypothesis. Other species of Neotropical mammals have also shown at least two colonization events from South America to Central America. An example is the case of the howler monkey (Alouatta; Ruiz-García et al. 2017), armadillo (Dasypus novemcinctus; Arteaga et al. 2012), or anteater (Tamandua sp.; Ruiz-García et al. 2021c). Using mitogenomic data, an alternative hypothesis can be proposed: 3) An N. nasua haplogroup in northern South America (Ruiz-Garcia et al. 2021a) gave rise to intermediate haplotypes between the current N. nasua haplotypes and the current N. narica haplotypes, some of which could still be detectable in southern Central America (southern Costa Rica). However, the haplotypes from the Central American N. narica would have originated in the north of present-day Colombia, as evidenced by the specimen of the PN Tama (North of Santander), which → MG1 (trans-Andean Ecuador) → MG3 → MG2, MG4, and MG5. In addition, the colonization of specimens introgressed with the mtDNA of N. olivacea (MG6) would have occurred. Therefore, this hypothesis proposes two colonizing events from South America to Central America, adding the possibility of a small colonizing event of intermediate haplotypes and even of haplotypes closer to N. nasua that occurred before the two major colonization events.
Ruiz-García et al. (2021a) proposed the beginning of mitochondrial evolution of the genus Nasua (including Nasuella) in the Andean zone of northwest South America 13-10 Ma (Miocene). This is consistent with the start of an intense uplifting in the central and northern Andes estimated to have occurred between 13 and 11 Mya (Antonelli et al. 2009; Hoorn et al. 2010) and with the completion of the Pebas system, which was characterized by the complete, or almost complete, flooding of the western Amazon during the Middle Miocene (Hoorn et al. 2010). From 11 to 7 Mya, another rapid uplifting of the Andean zone took place (Quechua II and III phases; Noble et al. 1990; Antonelli et al. 2009), and the Pebas System was replaced by the Acre fluvial system (Hoorn et al. 2010). These geomorphological and hydrological changes may have contributed to the emergence of different genetic clusters within N. nasua and the genesis of N. olivacea. However, this means that the ancestors of the current coatis had already reached South America during the Middle Miocene, supporting the hypothesis that the closure of the Central American Seaway occurred 15-13 Mya (Farris et al. 2011; Montes et al. 2012a b, 2015; Carrillo et al. 2015; Ruiz-García et al. 2018a).
According to the results reported here, the oldest N. narica haplotypes in South America seem to have emerged 4.5-3.2 Mya (Pliocene), with the Andes having played a major role. During the Pliocene, the eastern Andes mountain range in Colombia did not reach 40 % of their current elevation (Hoorn et al. 2010). The uplifting of the Andes continued until 2.7 Mya (Andriessen et al. 1994; Gregory-Wodzicki 2000). Therefore, the Andes mountain range itself may have been a physical and climatic barrier for multiple species that previously would have been widely distributed in northwestern South America (Miller et al. 2008; Rull 2011). This period was characterized by glaciations in Argentina (3.5 Mya; Mercer 1984), Bolivia (3.27 Mya; Clapperton 1981), Chile (3-2 Mya; Caviedes and Paskoff 1975). According to the standard GABI model, the Isthmus of Panama emerged completely around 3.5-3.0 Mya (Middle Pliocene) with the definitive closure of the Central American Seaway (Coates and Stallard 2013; O’Dea et al. 2016), which could enable some colonizing events by N. narica from South America to Central America. Therefore, the case of coatis is contrary to the hypothesis supported by the fossil record, which suggests the predominance of a north-to-south colonization process that occurred 2.8-2.4 Mya (Simpson 1980; Webb 2006; Woodburne 2010). However, the Central American Seaway closure model during the Middle Miocene (15-13 Mya) seems more likely as it predicts active colonization from South America to North America over the past 6 Mya (Bacon et al. 2015, 2016; Marko et al. 2015), as observed for the coati in the present study.
The formation of the truly Central American haplotypes (excluding those of G6-MG6) took place between 1.9-1.1 Mya (Pleistocene), but the time of the introgression of N. olivacea into an N. narica group also occurred in this period (2.3-0.8 Mya). Nigenda-Morales et al. (2019) placed the divergence of the Central American groups at around 1.3 Mya, within the time range established in the present study. During this period, particularly in the range of 1.3-0.8 Mya, called Pre-Pastonian (maximum glacial peak of the great Gunz glaciation), the Central American groups of N. narica started to emerge. This period was extremely dry, which significantly reduced the extent of forests and boosted much of the genetic structure in different species of Neotropical mammals (Lagothrix sp., Ruiz-García et al. 2014, 2019a, 2020b; Puma yagouroundi, Ruiz-García et al. 2018b; Lycalopex sp., Ruiz-García et al. 2013).
The genetic structuring of N. narica in Central America during the Pleistocene is consistent with the refuge hypothesis (RH; Haffer 1969, 1997, 2008; Vanzolini 1970; Vanzolini and Williams 1970) of alternating humid-dry periods as a result of the Milankovitch cycles. This led to periods of forest contraction where much of the fauna was relegated. During dry periods, forests became shelter patches isolated by shrub zones, savannas, or arid steppes. This fostered the divergence between populations of the same species that became isolated in different refuges and the emergence of new lineages within them. Conversely, forests expanded in the humid periods, and the different lineages coexisted again in sympatric territories. At that time (1.30-1.10 Mya), sixth and seventh North American glaciations occurred (1.1-0.9 Mya) that affected southern México and northern Guatemala (Barendregt and Duk-Rodkin 2011; Rutter et al. 2012) and could have led to the differentiation of the G3 haplotypes from G4 and G5. Subsequently, the Reid glaciation (0.3-0.13 Mya; Barendregt and Duk-Rodkin 2011; Rutter et al. 2012), with severe dry peaks in North and Central America (Dansgaard et al. 1993; Hodell et al. 2008), also significantly reduced the extension of forests in Central and North America where N. narica lived, leading to the diversification within groups G3 and G5.
In Central America, more recent divergence processes have already occurred. For instance, the MJN showed that G5 (MG5) may have produced G4 (MG4) about 0.12-0.09 Mya. Although Hooghiemstra (1984) defined up to 27 potential climate changes with a periodicity of 100,000 years in the Colombian Andes (which also may had been reflected in Central America), there is only definitive evidence of the start of a great glaciation 116,000 years ago (Van der Hammen and González 1963; Van der Hammen et al. 1981; Helmens 1988; Florez 1992).
Genetic diversity and spatial structure. The levels of mitochondrial genetic diversity of N. narica were high but lower than those estimated for N. nasua, N. olivacea, or P. flavus (Ruiz-García et al. 2019b, 2020a, 2021a). This is correlated with the more recent origin of the ancestor of N. narica. In general, the populations that emerged more recently and peripheral to their geographic range have lower genetic diversity levels. The populations of other mammal species distributed in South America and which later colonized Central America and the south of the USA have lower genetic diversity levels than South American populations (long-nosed armadillo, Dasypus novemcinctus, Huchon et al. 1999; Arteaga et al. 2012; puma, Puma concolor, Culver et al. 2000; jaguarundi, Puma yagouroundi, Holbrook et al. 2013; Ruiz-García et al. 2018b).
In addition, a geographic pattern is observed in the distribution of genetic diversity. The groups living in northwestern South America (G1), and the southernmost part of Central America, introgressed by N. olivacea (G6), have the highest genetic diversities, whereas the northernmost groups of Central America have lower genetic diversity values. The group of Yucatán (México; G2) is an exception.
The spatial structure of N. narica was conspicuous and widespread throughout its range (Silva-Caballero et al. 2017, Nigenda-Morales et al. 2019), which appears to be common in the procionids studied from a population genetics stsandpoint (e. g., N. nasua, N. olivacea, or P. flavus; Ruiz-García et al. 2019b, 2020a, 2021a). In addition to the philopatric behavior of coati females and the climatic and ecological changes already described, geographic barriers may also have been drivers of the high spatial structure found in N. narica. Three physical barriers would help understand the spatial structure found in this study. The area between the Sierra Madre Oriental and the Isthmus of Tehuantepec south to the Nicaraguan depression is home to the groups G5, G2, G4, and part of the specimens of G3. In the area between the Nicaraguan depression and the Talamanca Mountain range (southern Costa Rica and northern Panama, whose emergence is dated at 5-3 Mya; MacMillan et al. 2006; Mann et al. 2007), we found another part of the specimens of G3 and one specimen of G6. In the area between the Talamanca Mountain range and the Darien region, we found the introgressed specimens of G6. Some of these barriers emerged at times consistent with the estimated divergence times between the N. narica groups and have been effective geographic barriers for different taxa. The Talamanca Mountain range has been a geographic barrier for reptiles (Daza et al. 2010) and mammals (Bradley et al. 2008; Harding and Dragoo 2012; Hardy et al. 2013). The same is true for the Nicaraguan depression, characterized by marine transgressions during the Pliocene and Pleistocene (Bagley and Johnson 2014), which have been effective in isolating rodent species (Gutiérrez-García and Vázquez-Domínguez 2012). The territory delimited between the Motagua-Polochic-Jocotan fault (southern Guatemala) and the Isthmus of Tehuantepec (México) has been considered an area of endemic fauna delimited by these geographic barriers (Daza et al. 2010; Gutiérrez-García and Vázquez-Domínguez 2013), although this area originated 6-3 Mya, that is, before the arrival of N. narica to that area of Central America.
However, these physical barriers only partially explain the groups found in this study. Within the first area delimited by the physical barriers just mentioned (Sierra Madre Oriental and the Isthmus of Tehuantepec south to the Nicaraguan depression), we defined three groups that, in principle, are not separated by physical barriers, and we even found specimens of G3, i. e., the only group found in the second geographic area delimited by the geographic barriers mentioned above (between the Nicaraguan depression and the Talamanca mountain range). The G6 specimens were found basically in the third geographic area mentioned (between the Talamanca mountain range and the Darien region); however, one specimen was found on the other slope of the Talamanca mountain range, whereas the Colombian specimens of the same group were found on the other side of the Darien region. Therefore, we consider that the behavior of the species and climatic changes were more relevant for defining the spatial structuring of N. narica than orographic barriers.
Our findings based on mtDNA can be interpreted as a first step toward solving the issue regarding the systematics of N. narica. This study provides the most comprehensive mitochondrial analysis and includes the widest geographic range covered to date for the species. However, the study of nuclear markers is essential to determine the hybridization and gene flow levels between the different mitochondrial groups of N. narica and achieve a complete evolutionary understanding of this species. Similarly, sampling efforts should be expanded to better understand the origin of this species.

