


 nueva página del texto (beta)
 Inglés (pdf)
 Artículo en XML
 Referencias del artículo
 Enviar artículo por email
 Citado por SciELO
  Similares en
SciELO
Similares en
SciELO 
 Permalink
Introduction
The morphological species concept has been used historically to describe new taxa (Mayden 1997; Mayr 2000). In fact, the majority of species that we know today were delimited and/or assigned to different taxonomic categories based on their morphological characteristics (Seifert 2014). However, establishing species boundaries in some instances is problematic (Mayr 2000). For example, for cryptic species, which are genetically different entities that do not show distinctive morphological characteristics (Struck et al. 2018). In these cases, species concepts with different criteria have been proposed, most of them based on the use of a single operational criterion to describe new species (Sites and Marshall 2003, 2004). In contrast, the General Lineage concept (de Queiroz 1998, 2007) employs multiple lines of evidence (genetic, morphological, ecological, ethological, etc.) to propose species as a separately evolving metapopulation lineage. This approach implements the use of an integrative taxonomy, which has been widely suggested in systematic studies (Dayrat 2005; Alström et al. 2008; Sangster 2018).
Recently, Leaché et al. (2009) argued that the use of morphological and ecological data, in addition to molecular data, allows better discrimination among species. Geometric morphometric analysis is a robust tool to highlight interspecific variation in zoological groups, such as mammals, corroborating the phylogenetic relationships within them (e. g.,Bogdanowicz et al. 2005; Camul and Polly 2005; Pavan and Marroig 2016). In addition, ecological niche studies are being increasingly used for these same purposes (e. g.,Rissler and Apodaca 2007; Rivera et al. 2018; Zhao et al. 2019), and for making inferences related to evolutionary questions of both historical distributions and speciation processes (Graham et al. 2004).
The genus Reithrodontomys (Cricetidae, Rodentia) constitutes a taxon in which species were originally described based on pelage coloration (Allen 1895), and morphological characteristics of the skull and dentition (Merriam 1901; Hooper 1952). However, variation in these characters overlap among populations of different species (Hooper 1952), making taxonomic recognition difficult and leading to misidentifications in many cases.
Reithrodontomys mexicanus (Saussure, 1860) is one of the most taxonomically complex species within the genus, nowadays considered as a complex of cryptic species (Arellano et al. 2003, 2005; Miller and Engstrom 2008). Hooper (1952, 1959) recognized 13 subspecies, but currently only 10 are remain valid (Bradley 2017). One of the species that has been subject to taxonomic changes is R. cherrii (Allen, 1891), restricted to some highland localities in central Costa Rica (Hooper 1952; Hall 1981). Howell (1914) relegated R. cherrii as a subspecies of R. mexicanus, without a clear justification for this nomenclatural change. Almost a century later, Arellano et al. (2005) raised R. cherrii back to the species level based on a molecular phylogenetic analysis of the mitochondrial cytochrome b gene. Specimens of R. cherrii were grouped into a genetically well-differentiated clade from R. mexicanus (recognized herein as R. mexicanus “classic” clade), with a genetic distance value (using the K2P evolutionary model) greater than 12 % (Arellano et al. 2006). Also, the species status of R. cherrii was recognized by Gardner and Carleton (2009) using traditional morphometrics and pelage coloration. However, it is desirable to complement the taxonomic distinction between R. cherrii and R. mexicanus with a larger sampling and under an integrative taxonomy approach employing alternative data sources such as geometric morphometrics and ecological attributes. Therefore, the goal of this study is to compare both species using cranial features and environmental characteristics of their habitats, based on the premise that they constitute genetically well-differentiated species.
Materials and methods
Geometric morphometrics data. We examined 47 skulls of adult individuals (M3 erupted, age classes following Arellano et al. 2012) from different museum collections (Appendix 1), and each specimen was photographed in the dorsal and ventral views of the skull. We based the selection of specimens; R. mexicanus (n = 28) and R. cherrii (n = 19); and their localities (Figure 1; Appendix 1), on the R. mexicanus “classic” and R. cherrii clades obtained in the phylogeny reported by Arellano et al. (2005). The specimens used in Arellano et al. (2005), but not available for morphometric analysis, were replaced by individuals from the same localities or within a radius less than 60 km. Digital images of skulls were taken using an Olympus DP73 Digital Camera coupled to an optical microscope, and to the computer through the CellSens program. The skulls were positioned on a black background, always keeping the same distance from the camera lens, and using a millimeter rule as a scale bar.
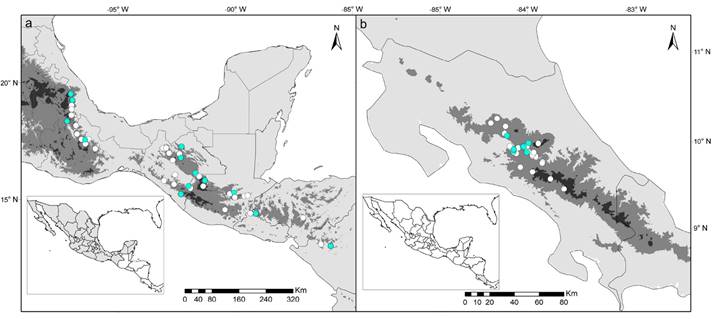
Figure 1 Map showing localities of the specimens used in this study. (a) Reithrodontomys mexicanus from Mexico and Central America and (b) R. cherrii from Costa Rica. Localities for geometric morphometric analysis are highlight in blue dots. Gray tones depict elevation gradient: light gray < 1,000 m, gray 1,000 to 2,500 m; and dark gray > 2,500 m.
Landmark and semi-landmark configurations for both views were selected based on previous studies of cricetid rodents (e. g.,Martínez and Di Cola 2011). Configurations were digitized assuming positional homology among individuals (Zelditch et al. 2004), with the TPSdig 2.31 program (Rohlf 2015). We used 17 landmarks, 13 semi-landmarks for the ventral view and 12 landmarks, 23 semi-landmarks for the dorsal view (Figure 2; Appendix 2). We aligned, rotated, and scaled all landmarks and semi-landmarks configurations using a Generalized Procrustes analysis (GPA; Rohlf and Slice 1990) implemented in the package geomorph 3.3.1 (Adams and Otárola-Castillo 2013) from R library (R Core Team 2018). During this processing, semi-landmarks position on the curved structures were allowed to slide along their tangent vectors until reaching the minimum point of bending energy (Bookstein 1997; Zelditch et al. 2004). Shape variables (Procrustes distances and Procrustes coordinates) and centroid size (CZ) were obtained from the GPA. The CZ is related to skull size and computed as the square root of the sum of the squared distances between each landmark and the configuration centroid (Bookstein 1991).
Sexual dimorphism and allometry. We evaluated the sexual dimorphism in shape and size of the skull within species for each view. A Procrustes ANOVA (Goodall 1991; Anderson 2001) was performed for skull shape using the function ProcD.lm, and a factorial design with shape as the dependent variable, sex as the main factor, and CZ as a covariate. Significant differences (P ≤ 0.05) in skull size between sex were tested using the function lm.rrpp in the R package RRPP (Collyer and Adams 2018). The allometric component (possible effect of the skull size on the shape variation) was analyzed using a Procrustes ANOVA and the same factorial design previously declared. Analyses of sexual dimorphism (shape) and allometry were carried out in geomorph 3.3.1.
Skull shape and size differences. Principal component analysis (PCA) on the Procrustes coordinates were performed for each view of the skull in geomorph 3.3.1. Then, we used the first two components to visualize the ordering of the data according to the skull morphometric variation, and the extreme variation (minimum and maximum) of the shape along component 1 were represented using deformation grids.
We determined shape differences between species for each skull view using a Procrustes ANOVA in geomorph 3.3.1. A factorial design was used with shape as the dependent variable, species as the main factor, and CZ as a covariate. The mean skull shape differences between species were quantified (Procrustes distances) and tested for its statistical significance (P ≤ 0.05; resampling = 1000), using a pairwise permutation test (function permudist) in the R package Morpho 2.4 (Schlager 2016).
We employed a similar approach to compare skull shape between species for skull size. This analysis was developed for each view with the function lm.rrpp of the RRPP package. The factorial design consisted of CZ as the dependent variable, species as the main factor, and shape as a covariate. We visualized the results of these analyses using the shiny application Extended Boxplot Graphics (Ramirez-Arrieta et al. 2020).
Ecological niche data. For the ecological analysis, we included the occurrences localities for the specimens used in the morphometric analysis. Additional localities were incorporated to represent the largest number of sites reported for both species (Figure 1; Appendix 3). Occurrence records were obtained from museums databases or downloaded from the VertNet database (http://portal.vertnet.org). Geographic coordinates were rectified against the known distribution of R. cherrii and R. mexicanus (Hooper 1952; Hall 1981), to reduce georeferencing errors.
We characterize the species ecological niche using six bioclimatic variables from Wordclim 2.0 (Fick and Hijmans 2017; http://www.worldclim.org): BIO1 = Annual Mean Temperature, BIO5 = Max Temperature of Warmest Month, BIO6 = Min Temperature of Coldest Month, BIO12 = Annual Precipitation, BIO13 = Precipitation of Wettest Month, and BIO14 = Precipitation of Driest Month, with a spatial resolution of ~1 km2. The selection of variables was based on previous studies that highlight their importance for small mammals ecological analyses (Santos et al. 2017; Guevara et al. 2018; Stanchak and Santana 2018). Because the distribution of small mammals may also depend on elevation gradient and vegetation quality (Patterson et al. 1989; McCain 2005; Umetsu and Pardini 2007), we also used elevation as a topographic variable derived from a digital elevation model (data available at http://www.worldclim.org), and the Normalized Vegetation Difference Index (NDVI; Pettorelli et al. 2005). The NDVI layer was obtained from the Climate Engine Platform available at http://ClimateEngine.org (Huntington et al. 2017), which represents the average conditions of this index in the last five years.
Ecological niche differences. Ecological niche characteristics of R. cherrii and R. mexicanus were summarized using the predictor variables described above (bioclimatic, elevation, and NDVI). To determinate the environmental ranges of each species, we calculated descriptive statistics (Mean, Standard Error, Maximum and Minimum values, Confidence Intervals constructed from the percentile method, Standard Deviation, and Coefficient of Variation) using information extracted from the occurrence records.
With the predictor variables, we generated an environmental background using ArcGIS 10.8 (ESRI 2020), which included the information extracted from 10,000 random points within a buffer of 100 km2, around each occurrence record. This buffer selection allows to consider regions with suitable environmental conditions for the species and to minimize the inclusion of areas where they would not be found due to the presence of physical barriers or biotic interactions (Kubiak et al. 2017).
The environmental background and the occurrence data were used to visualize the species ecological niche in a three-dimensional space constructed from the first three principal components (which explained over 95 % of the variance in the data). For this, the minimum-volume ellipsoid (Van Aelst and Rousseeuw 2009) and convex polyhedron (Soberón and Nakamura 2009) were displayed as a representation of the fundamental and realized niche (Qiao et al. 2016) for each species, respectively. Analyses were performed using NicheA (Qiao et al. 2016), a software for exploring and analyzing the environmental and geographic spaces of virtual and real species. Niche similarity between species was quantified in NicheA, based on Jaccard index (Jaccard 1912), and using the minimum-volume ellipsoid calculation method. This index based on the superposition of ellipsoids in the environmental space, captures the fundamental niche rather than the realized.
Additionally, we performed PCA on the environmental data of the occurrence records, to determine whether the ecological niches were significantly different (P ≤ 0.05) between species, using the first two principal components (which explained 99.7 % of the total variance). Finally, we performed a Mann-Whitney U test for each variable in the program Statistica 8.0 (STATSOFT 2007), to know which of them contributed to the environmental niche differentiation between R. mexicanus and R. cherrii.
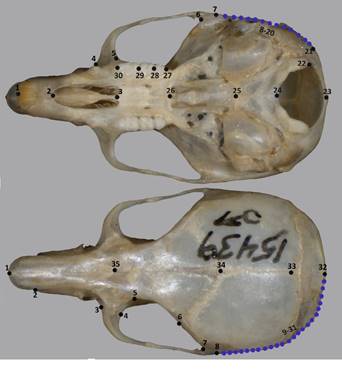
Figure 2 Landmarks (black dots) and semi-landmarks (blue dots) digitized in ventral and dorsal views of the skull. Anatomical positions of landmarks described in Appendix 2. The specimen voucher (BYU 15439) is a male of Reithrodontomys mexicanus.
Results
Sexual dimorphism and allometry. Females and males of R. mexicanus and R. cherrii did not show sexual dimorphism in shape or size of the skull for both ventral and dorsal views (Table 1). Consequently, we did not distinguish between sexes to perform the morphometric analyses. Likewise, none of the species demonstrated significant allometry between shape or size of any skull view, therefore, we used the Procrustes distances matrix in our analyses of interspecific comparison.
Table 1 Results of sexual dimorphism and allometry analyses in Reithrodontomys mexicanus and R. cherrii, using shape and size (centroid size) of the skull from ventral and dorsal views
| SS | MS | R 2 | F | Z | P | |
|---|---|---|---|---|---|---|
| A. Reithrodontomys mexicanus | ||||||
| Ventral view | ||||||
| Shape ̴ Sex | 0.002 | 0.002 | 0.051 | 1.416 | 0.870 | 0.208 |
| Centroide size ̴ Sex | 2.856 | 2.856 | 0.028 | 0.764 | 0.400 | 0.404 |
| Shape ̴ Centroide size | 0.002 | 0.002 | 0.048 | 1.319 | 0.809 | 0.207 |
| Dorsal view | ||||||
| Shape ̴ Sex | 0.002 | 0.002 | 0.054 | 1.554 | 0.985 | 0.162 |
| Centroide size ̴ Sex | 8.509 | 8.509 | 0.064 | 1.779 | 0.805 | 0.207 |
| Shape ̴ Centroide size | 0.003 | 0.003 | 0.079 | 2.272 | 1.556 | 0.078 |
| B. Reithrodontomys cherrii | ||||||
| Ventral view | ||||||
| Shape ̴ Sex | 0.002 | 0.002 | 0.091 | 2.017 | 1.569 | 0.067 |
| Centroide size ̴ Sex | 0.165 | 0.165 | 0.012 | 0.210 | 0.168 | 0.651 |
| Shape ̴ Centroide size | 0.002 | 0.002 | 0.092 | 2.029 | 1.448 | 0.084 |
| Dorsal view | ||||||
| Shape ̴ Sex | 0.003 | 0.003 | 0.103 | 1.949 | 1.288 | 0.106 |
| Centroide size ̴ Sex | 2.310 | 2.310 | 0.133 | 2.612 | 0.924 | 0.157 |
| Shape ̴ Centroide size | 0.002 | 0.002 | 0.063 | 1.196 | 0.531 | 0.283 |
SS = sum of squares; MS = means squares; Z and P values based on 1000 permutations
Skull shape and size differences. For the ventral view of the skull, the first principal component (PC1) separated R. cherrii from R. mexicanus almost completely, which together with the second component (PC2) explained 63.12 % of shape variation (Figure 3a). For the dorsal view, the first two principal components overlapped in the skull shape for both species (Figure 3b). The PC1 segregated the two species better than the PC2, explaining 49.67 % and 11.05 % of the skull shape variation, respectively.
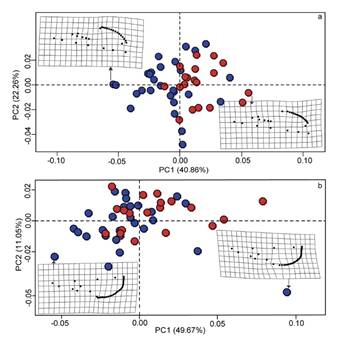
Figure 3 Principal component analysis of ventral (a) and dorsal (b) views of the skull. Red dots = Reithrodontomys mexicanus and blue dots = R. cherrii. Deformation grids represent the minimum and maximum variation in skull shape along the first component.
Procrustes ANOVA analyses revealed differences between R. mexicanus and R. cherrii for the ventral (F 1.46 = 6.42; P ≤ 0.01) and dorsal (F 1.46 = 3.19; P ≤ 0.01) views of the skull shape. Differences between mean shape for the ventral view were found mainly in the posterior region of the cranium (Figure 4). R. mexicanus displayed an expansion of the landmarks of the foramen magnum, and a relatively broader braincase than R. cherrii. In the dorsal view, the most notable differences were located on the anterior and middle region of the cranium (Figure 4). R. cherrii exhibited a relatively longer nasal bones, a broader configuration between the 3-4-5 landmarks that described the zygomatic plate and the interorbital region, and a relatively broader parietal bone. Skull size differences between species (Figure 5) were highly significant for the ventral view (F 1.46 = 17.01; P ≤ 0.01), and significant for the dorsal view (F 1.46 = 4.50; P ≤ 0.05).
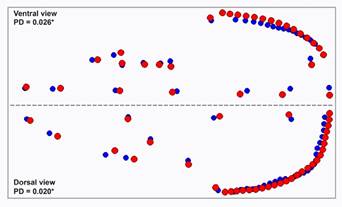
Figure 4 Differences in mean shapes of ventral and dorsal views of the skull, using the Procrustes distances. Red dots = Reithrodontomys mexicanus and blue dots = R. cherrii, PD = Procrustes distances, asterisks = significant differences based on pairwise permutation test (P < 0.05).
Ecological niche differences. Most variables that characterized the ecological niche of each species were relatively distinct in mean and ranges (Table 2). The environmental space of R. mexicanus had ranges with higher values of temperature for the warmest and coldest months, although the mean annual temperature was similar for both species. With respect to precipitation, the environmental space of both species showed similar means for the driest month, but not for the wettest month. Annual precipitation values were notably different, the environmental niche of R. cherrii exhibited a higher mean value than that reported for the geographic region where R. mexicanus is distributed. The elevation gradient occupied by R. cherrii ranged from 900 to almost 3,300 masl, whereas in R. mexicanus it ranged from over 400 to around 3,000 masl. Distribution areas of R. mexicanus presented NDVI ranges slightly higher than those of R. cherrii, although in both species the NDVI means were above 0.6.
Table 2 Descriptive statistics used to summarize the ecological niche characteristics of Reithrodontomys mexicanus and R. cherrii based on the environmental information from occurrence records.
| Environmental Variables | Mean ± SE | Min - Max | CI | SD | CV | |
|---|---|---|---|---|---|---|
| R. mexicanus | ||||||
| Annual Mean Temperature | 17.87 ± 0.53 | 10.44 - 25.43 | 12.36 - 21.57 | 3.61 | 20.26 | |
| Max Temperature of Warmest Month | 25.94 ± 0.62 | 18.80 - 36.00 | 19.50 - 31.30 | 4.21 | 16.25 | |
| Min Temperature of Coldest Month | 9.58 ± 0.50 | 1 - 18.90 | 5.50 - 13.20 | 3.42 | 35.68 | |
| Annual Precipitation | 1906.39 ± 128.08 | 482 - 4875 | 1145 - 2943 | 868.68 | 45.57 | |
| Precipitation of Wettest Month | 346.09 ± 22.38 | 103 - 886 | 223 - 546 | 151.82 | 43.87 | |
| Precipitation of Driest Month | 34.80 ± 4.45 | 2 - 144 | jun-68 | 30.16 | 86.85 | |
| Elevation | 1696.91 ± 82.87 | 438 - 3083 | 997 - 2434 | 562.09 | 33.12 | |
| NDVI | 0.77 ± 0.02 | 0.34 - 0.90 | 0.58 - 0.87 | 0.12 | 15.9 | |
| R. cherrii | Annual Mean Temperature | 17.88 ± 0.56 | 8.41 - 22.03 | 12.51 - 20.42 | 3.28 | 18.36 |
| Max Temperature of Warmest Month | 24.35 ± 0.62 | 14.1 - 29 | 18.10 - 27.20 | 3.61 | 14.85 | |
| Min Temperature of Coldest Month | 11.92 ± 0.56 | 2.3 - 16.3 | 6.70 - 14.60 | 3.28 | 27.55 | |
| Annual Precipitation | 2721.65 ± 90.67 | 1961 - 4052 | 2197 - 3562 | 528.75 | 19.43 | |
| Precipitation of Wettest Month | 426.48 ± 11.73 | 317 - 592 | 340 - 520 | 68.42 | 16.04 | |
| Precipitation of Driest Month | 46.29 ± 5.50 | 10 - 131 | 10 - 100 | 32.07 | 69.29 | |
| Elevation | 1629.76 ± 96.25 | 900 - 3297 | 1170 - 2573 | 561.28 | 34.43 | |
| NDVI | 0.67 ± 0.03 | 0.23 - 0.87 | 0.38 - 0.83 | 0.17 | 25.87 |
SE = Standard Error, Min = Minimum, Max = Maximum, CI = Confidence Intervals (Percentile method), SE = Standard Deviation, CV = Coefficient of Variation
The ecological niche visualization using the first three components showed that R. mexicanus occurs in a broader environmental space than R. cherrii (Figure 6a). The minimum-volume ellipsoids displayed a partial overlap of the environmental conditions of each species, with a low niche similarity of Jaccard index (0.08). The statistical comparison of the principal component scores showed significant differences (U = 313; P = 0.02) between the environmental niche of each species for the first component, while no differences were found (U = 458; P = 0.25) for the second component (Figure 6b, 6c). In the pairwise comparisons, all variables were statistically different, except for BIO1, BIO14, and elevation (Figure 7).

Discussion
Geometric morphometrics has shown great applicability in mammal taxonomic studies, mainly for anatomical structures such as the cranium, dentition, or mandibles (e. g.,Cordeiro-Estrela et al. 2008; Barčiová 2009; Kryštufek et al. 2021). As part of an integrative taxonomy, this morphological tool has allowed researchers to corroborate hypotheses derived from phylogenetic studies and to establish species boundaries (Camul and Polly 2005; Pavan and Marroig 2016). This taxonomic approach also includes other lines of evidence, such as ecological data (Dayrat 2005). In particular, the environmental niche characteristics can be useful to delimit cryptic species or phylogenetically related groups, especially when their relationships are known, something that has been confirmed in several rodent species (Martínez-Gordillo et al. 2010). This could be the case of the harvest mice R. mexicanus and R. cherrii, for which genetic differences are well established, but lack modern morphometrics and ecological data. In this study, we tested the premise that differences in the skull and the environmental characteristics would be consistent with the genetic divergence documented between these species (Arellano et al. 2003, 2005, 2006).
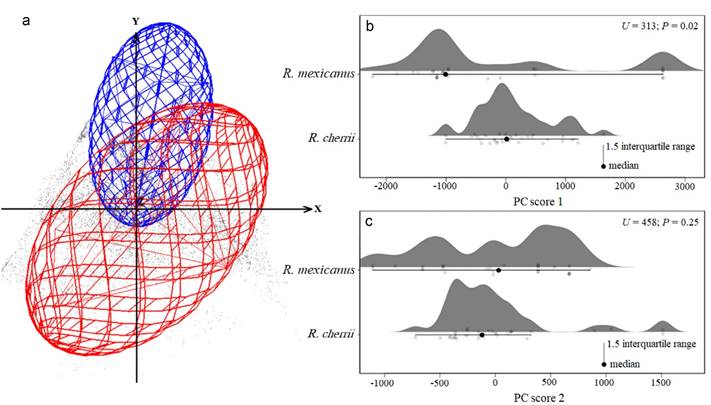
Figure 6 Environmental niche of Reithrodontomys mexicanus (red ellipsoid) and R. cherrii (blue ellipsoid) displayed in a three-dimensional space and based on the occurrence records and a background data (a). On the right (b and c) show the statistical comparisons using the scores of the first two principal components derived from the environmental variables. Statistical significance considered with P ≤ 0.05.
Our findings of sexual non-dimorphism in both species coincide with that previously described for Reithrodontomys (Hooper 1952). In R. mexicanus, the absence of sexual dimorphism was reported by Arellano et al. (2012) analyzing the morphometric variation in a population from Sierra Juárez, Oaxaca. Whereas for R. cherrii, here we report for the first time sexual non-dimorphism for cranial characteristics.
The PCA revealed some overlap in the skull shape for both ventral and dorsal views. However, the cranial structures on the ventral view were more useful to differentiate R. cherrii from R. mexicanus. The greater discriminative power of the ventral side versus the dorsal of the skull has been noted for other cricetid rodents (Martínez and Di Cola 2011). Particularly for Reithrodontomys, Mayares (2012) evaluated the morphometric variation in the skull ventral view among R. sumichrasti populations distributed on both sides of the Isthmus of Tehuantepec in Mexico and correctly differentiated populations grouped according to genetic clades suggested as different species by Hardy et al. (2013).
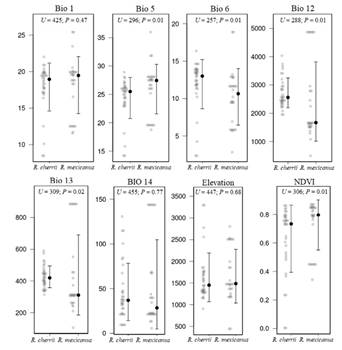
Figure 7 Pairwise comparisons of variables used to characterize the environmental space between Reithrodontomys mexicanus and R. cherrii. Variable names are in the methods section. Statistical significance considered with P ≤ 0.05.
Despite the overlap in skull shape, we found statistically significant differences between R. cherrii and R. mexicanus for ventral and dorsal views. Gardner and Carleton (2009) used craniodental measurements to compare different Reithrodontomys taxa distributed in Costa Rica and Panama, including R. cherrii, R. m. garichensis, and R. m. potrerograndei. The skull of R. cherrii was differentiated by “its overall robust size and evenly arched dorsal profile, especially over the braincase and occiput; it is notably broad across the braincase and zygomata but has a proportionally shorter rostrum” (Gardner and Carleton 2009:167). These characteristics partially differ from our results, since R. cherrii has a narrower foramen magnum region and braincase than R. mexicanus, while the nasal bone was relatively longer. Hooper (1952) compared specimens of R. cherrii from central Costa Rica to R. m. lucifrons central Honduras. Hooper (1952) described R. m. lucifrons as possessing a rostrum and incisive foramen that were slightly smaller than that of R. cherrii, consistent with the differences we documented for the ventral view of the skull.
The differences in size (CS) for both views of the skull showed that R. cherrii tends to have a larger cranium than R. mexicanus. These results are consistent with the linear measurements given by Hooper (1952) and traditional morphometric analyses carried out by Gardner and Carleton (2009). Hooper (1952) highlighted R. cherrii as one of the largest subspecies within R. mexicanus, comparing it in body size and skull length with Peromyscus maniculatus.
Although our morphometric analyses statistically differentiate R. cherrii from R. mexicanus, both species showed overlap in shape and size of the skull. The degree of morphological overlap among species of Reithrodontomys has been evident since the earliest monographs of the genus (Howell 1914; Hooper 1952). This may be why the taxonomic identification of Reithrodontomys species is difficult, leading to an underestimation of the actual number of species within this genus. For R. mexicanus, Hooper (1952) reported cranial and body measurements very similar or with very wide ranges among all its subspecies, including the former R. m. cherrii. The strong similarity of morphological (cranial and body measurements) and pelage coloration among these subspecies explains the inclusion of R. cherrii within R. mexicanus (Howell 1914), even though it was originally described as a species (Allen 1891).
Reithrodontomys mexicanus has one of the widest distributions within the subgenus Aporodon (Arellano 2015), whereas R. cherrii is restricted to the highlands of central Costa Rica and the Cordillera de Talamanca (Gardner and Carleton 2009; Villalobos-Chaves et al. 2016). Throughout its distribution, R. mexicanus is associated with a variety of vegetation-types such as humid oak forests, cloud forests, deciduous arid forests, and deciduous lowland forests (Hooper 1952), which coincides with its broader environmental space here reported compared to that of R. cherrii. R. mexicanus also occupies areas with high mean values of temperature and low values of precipitation compared to those for the distribution area of R. cherrii. The overlap of the minimum-volume ellipsoids in a small region, as well as the low Jaccard similarity index value, may be due to shared environmental characteristics between cloud forests and montane pluvial forests, the main plant formations where R. mexicanus and R. cherrii occurs, respectively.
The bioclimatic variables used in this study have been previously used in mammal ecological studies (Santos et al. 2017; Guevara et al. 2018; Stanchak and Santana 2018). BIO5, BIO6, BIO14, and BIO15 are variables that may be limiting the distribution of cloud forest species (Guevara et al. 2018). Of these four variables, only BIO14 (Precipitation of the driest month) was not significantly different, while the annual precipitation values were the most divergent among regions occupied by these species. These values were higher than 2,000 mm per year for R. cherrii, coinciding with the physical-geographical characteristics of the Central Valley (Gómez 1986), which is the climatic region where it is distributed in Costa Rica.
Additionally, we used elevation and NDVI variables to characterize the environmental space of each species. Although the minimum and maximum elevation values were higher for R. cherrii, the mean was similar between species. The altitudinal gradient of Aporodon species is variable, but most of them inhabit above 1,000 masl (Hooper 1952; Hall 1981). This could explain the lack of statistical differences when comparing this variable between the two species. Elevation has been widely used in studies focused on small rodents (McCain 2005), and it is useful to characterize the habitat in this group. However, this variable should be treated with caution when carrying out ecological analyses, such as niche modeling, due to the high association to temperature and precipitation, especially for small mammals distributed at high elevations (Rubidge et al. 2011; Santos et al. 2017; Guevara et al. 2018).
The NDVI is related to different vegetation parameters (Pettorelli 2013), with values ranging between 0.2 and 0.8, where higher numbers are indicators of photosynthetic activity linked to vegetation types such as temperate forest, rain forest, among others (Meneses-Tovar 2011). Beyond the statistical differences found for this index between R. mexicanus and R. cherrii, it is important to highlight that the natural areas where these two species are distributed could be considered high quality ecosystems following Pettorelli et al. (2007), considering that the mean values were greater than 0.6. However, quantitative and qualitative indicators are needed to assess integrative ecosystem health (Lu et al. 2015). The NDVI application in animal ecology appears to be helpful, especially since it can be linked to animal distribution and abundance (Pettorelli et al. 2005). Its use in carnivorous and omnivorous mammal species has been well explored but little is known for small mammals (Pettorelli et al. 2011). Our results confirm the utility of this index in habitat characterization and encourages their inclusion in ecological studies for small rodents.
Howell (1914) included R. cherrii within R. mexicanus as one of its largest and brightest subspecies (Hooper 1952). In mammals, environment can include changes in structures such as skull and jaw, leading to ecophenotypic variations (Camul and Polly 2005). This phenotypic change due to habitat could justify R. cherrii misclassification at the subspecific level. However, the high genetic divergence reported between this former subspecies and R. mexicanus, translates into different evolutionary histories that vindicates it at the species-level, now as a member of the R. tenuirostris species group (Arellano et al. 2003, 2005). We found these two species to be different based on the skull morphometry and environmental. Thus, complementing the previous molecular evidence as a whole integrative taxonomy approach that supports R. cherrii as a different species from R. mexicanus.

