


 nova página do texto(beta)
 Inglês (pdf)
 Artigo em XML
 Referências do artigo
 Enviar este artigo por email
 Citado por SciELO
  Similares em
SciELO
Similares em
SciELO 
 Permalink
Introduction
Rodents in the subfamily Arvicolinae (lemmings, voles, and muskrats) have attracted a great deal of scientific attention for several reasons. They are widespread and abundant in the Northern Hemisphere; many species have dramatic population fluctuations; they often strongly affect the structure and function of ecosystems owing to their impact on vegetation, soils, and predators; and they can have substantial economic impact, both negative (damage to crops, orchards, and reforestation efforts) and positive (use of muskrat pelage for furs). Arvicolines fascinate population biologists because they often show multiannual patterns of alternating high and low densities (3- to 5-year population cycles). Charles Elton (1924) first brought population cycles to the attention of ecologists after learning about the phenomenon from a book on Norwegian mammals (Collet 1911-1912). Stenseth and Ims (1993) provide historical details.
Later studies of the cyclic fluctuations of arvicolines have stimulated an extraordinary number of explanatory hypotheses. Three decades ago I found 22 of them in the literature (Batzli 1992), and several more have appeared since. Many species do not appear to cycle, however, and even within species some populations cycle whereas others do not (Hansson and Hentonnen 1985a; Stenseth et al. 1996; Boonstra and Krebs 2012). A clear statistical demonstration of cyclic behavior requires a long time series of annual densities (3 to 4 times longer than the period of the cycle), however, and few such records exist, so we do not know if cycling occurs in many populations (Turchin 2003). As a further complication, some populations appear to go through cyclic and noncyclic phases in their long-term dynamics (Mihok et al. 1985a; Krebs 2013, Chap.1). Thus, it seems clear that the dynamics of arvicoline rodent populations differ dramatically within and between species, and this paper seeks to link this variability in abundance to differences in reproduction.
Given that there are about 160 species of arvicolines that occur throughout the Northern Hemisphere, mostly in temperate and arctic regions (they reach subtropical latitudes only at high elevations), it comes as no surprise that species also differ widely in their habitat preferences, food habits (even though all species eat mostly plants), and life history characteristics (Wilson et al. 2017). Of course, differences in life history characteristics of populations, such as age at first reproduction, litter size, and survivorship, result in differences in rate of population growth. In an analysis of available life table data for 138 mammalian species, including two arvicolines, Oli (2004) divided mammals into fast, medium, and slow life histories based on the ratio of fertility rate to age at first reproduction. In addition to high reproductive rates and early ages of first reproduction, fast species had smaller body size, lower survival rates, and greater potential rates of population growth compared to slow species. These trends in life history continued even after removal of the effects of body size and phylogeny. Changes in the age at first reproduction and fertility (litter size and frequency of litters) strongly influenced rates of population growth of fast species, but not slow species; whereas comparable changes in survival had strong influence on population growth in slow species, but not fast species.
In a review of reproduction Hasler (1975) found that most arvicoline species (those that shelter in burrows and forage on the ground-level plants in grasslands or forests) have short gestation times (18 to 21 days), rapid growth to weaning (12 to 14 days old), quick maturation to reproductive maturity (15 to 30 days old), postpartum estrus with induced ovulation (which results in simultaneous pregnancy and lactation and produces multiple litters for females within a single breeding season), and large litter size (usually means of four to eight young per litter). Nonconforming species in North America include highly specialized species that favor aquatic (larger body size and slower maturation), subterranean (smaller litter size and a diet including many roots and rhizomes), or arboreal habitats (smaller litter size and a diet consisting of needles of coniferous trees), and poorly known montane species at subtropical latitudes (small litter size). See Wilson et al. (2017) for further information on these exceptional species. With such high potential rates of reproduction, most arvicoline rodents must also have relatively low survival rates, if not the world would be awash in arvicolines. Further, because they are at the fast end of the continuum, population growth in most arvicoline rodents should respond more to changes in reproductive output than to changes of similar magnitude in survival.
In light of their fast life history, it’s not surprising that many arvicolines have episodic outbreaks in abundance, exponential increases during favorable times (relatively mild weather, good food supply, and few enemies) followed by steep declines (weather deteriorates, resources dwindle, and/or enemies increase). But even within the fast group some populations and species of arvicolines have later ages of first reproduction, fewer litters per breeding season, fewer young per litter, and slower potential rates of population growth than others. These populations should have fewer or no outbreaks, and that leads to the prediction that variability in density of arvicoline populations should be positively correlated with potential reproductive rates. Further, insofar as environmental factors that influence reproduction show geographic patterns, the variability of populations should show similar patterns.
Two environmental factors clearly influence the reproductive output of arvicolines, viz., physical conditions and food availability. The actual physical environment that an individual encounters depends not only on the local climate at its geographic location, but also on the shelter that its habitat provides. Latitude, elevation, and proximity large bodies of water all influence seasonal weather patterns (climate) and habitat type (vegetation and the substrate). The resultant shifts in vegetation and substrate change the nature of available food and shelter. As discussed below, these factors can influence the reproductive output of arvicolines, which suggests that a synthesis of geographical factors, reproductive characteristics, and population fluctuations of arvicoline rodents might be possible.
To develop the synthesis described above, I first review the complex of functional factors and evolutionary factors influencing arvicoline reproduction and population growth using a box and arrows model. Then I embark on a more detailed consideration of the factors that cause the considerable variation in reproductive traits within and between arvicoline populations. Next I consider previous work on reproduction of arvicolines, particularly litter size, in relation to geographic patterns. Finally, I test the reproductive potential (RP) hypothesis which states that under favorable conditions, populations with higher reproductive potential can grow more rapidly and can reach higher densities during the breeding season, which leads to greater variability in abundance because very high populations eventually decline to low densities. To do this I correlate the reproductive potential, which incorporates length of the breeding season as well as litter size of an average female, with the long-term (at least 10 years) variability in relative abundance for a series of North American populations for which I could find appropriate data. I also conduct comparisons of reproductive potential and variability in abundance for populations of the same and different arvicoline species in different habitats at the same site or in similar habitats at different sites.
A model of factor interactions. The series of functional and evolutionary relationships that link the geography, physical environment, habitat, nutrition, life history, and variability in abundance of arvicoline rodents are shown in Figure 1. Climatic harshness, including colder temperatures and a shorter growing season, increases at higher elevations and latitudes. This should reduce survival unless the rodent can compensate in some way, for instance by finding refuge from predators and by storing adequate food for winter (arvicoline rodents do not hibernate). The shorter growing season usually produces a shorter breeding season because winter imposes a less favorable nutritional regime and more severe physical conditions. This likely reduces the number of litters that can be produced in a year, which without compensation reduces recruitment. For the population to succeed, this decrease in reproduction must be balanced by adjustments that increase survival or that increase fertility, either by more rapid production of litters or by increasing litter size or both. One way to increase the survival of young might be to make them larger at birth, thereby also reducing time to maturity, but any increase in the size of the young without reducing litter size might strain the mother and reduce her survival. The number of young could be increased without requiring more resources by making them smaller, but any decrease in the size of the young might also reduce the survival of the young. Thus, some sort of balancing act between number and size of offspring seems likely, and much depends on the availability of resources. Both theoretical and empirical analyses of this trade-off have been examined for decades (Smith and Fretwell 1974; Charnov and Ernest 2006).
Habitat type (substrate and vegetation) also changes with latitude and elevation, though not necessarily positively or negatively. Whether the change improves or reduces habitat quality depends on the nature of the changes. Habitat type determines the availability and quality of food because arvicolines depend on plants, and increased availability of high quality food can increase both the frequency of litters and litter size (Batzli 1985). As noted above, the nature of the substrate affects the quality of shelter available, which also influences survival and breeding success.
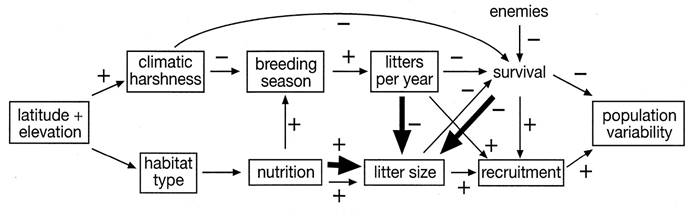
Figure 1 This model summarizes the interrelationships of geography, physical and biological environment, demography, and variability in abundance of arvicoline rodent populations. The thin lines represent patterns of functional relationships, and the heavy lines represent evolutionary influences.
Increased reproductive success leads to an increased rate of population growth, which leads to greater densities and ultimately to greater declines, so populations seem likely to show increased variability of abundance in higher quality habitats. Such a straightforward relationship is not a given, however. Survival and dispersal also influence rate of population growth and contribute to population variability, and increased reproductive effort and population growth can lead to increased dispersal and reduced survival. Predators, parasites, and disease also reduce survival, and the abundance of enemies may increase as the arvicoline population increases. Even though mortality and dispersal may play an important role in population fluctuations, they can be difficult to measure, and reliable quantitative data on patterns of survival are even less available than those for reproduction. Predation can account for a large portion of estimated mortality (Pearson 1964, 1966, 1971), but separating mortality from dispersal remains a difficult problem in natural populations. In fact, more seems to be known about the causes of dispersal than about the effects of dispersal on population dynamics (Krebs 2013), and I include dispersal within mortality to simplify Figure 1.
Other factors, such as changes in social behavior with increased population density or increase exposure to predation, both of which might reduce reproductive output indirectly because of stress responses (Krebs 2013), could be included in Figure 1. I have not included them or others because the model is not meant to show all factors that influence reproduction and population dynamics. Rather it elucidates the links between the environment, reproduction, and population variability that I used to develop and test the RP hypothesis. Litter size and length of the breeding season were the only aspects of reproduction for which I could find adequate data to compare with long-term data on relative abundance.
In addition to functional relationships among factors, evolutionary patterns also occur, and those that influence litter size are particularly germane to this paper (Figure 1). Several proposals link the evolution of reproductive rates, particularly to explain the frequent pattern of increasing litter sizes with increasing latitude among birds and mammals. Errington (1946, 1951), drawing on his extensive experience with muskrat populations, argued that intercompensation allowed populations to maintain themselves. He observed that changes in mortality and fertility compensated for one another; higher mortality led to greater reproduction as densities declined, and greater reproduction led to higher mortality as densities increased. Although he seemed to be emphasizing phenotypic plasticity in response to short-term environmental changes, he is also associated with the balanced mortality hypothesis: if increased climatic harshness results in increased mortality at higher latitudes, then natural selection favors individuals with more offspring. Of course, adequate resources must exist to support greater fertility if the population is to persist in a given habitat.
Lack (1954) countered with the maximal fecundity hypothesis and argued that selection will always favor individuals that produce additional viable offspring when adequate resources exist. For birds, he argued that more daylight hours for foraging during the breeding season at higher latitudes results in greater food availability, and this accounts for larger clutch sizes with increased latitude. Arvicolines forage day and night so daylength seems unlikely to be a critical factor for them, but the principle of selection for larger litter size with improved nutritional conditions remains. Lack also acknowledged that evolutionary trade-offs between the quality (size) and quantity (number) of offspring could occur.
In 1968, Spencer and Steinhoff explained increasing litter size with latitude or elevation as an evolutionary response in rodents to the decreased length of the breeding season. Increased litter size without increased resources likely reduces female survival thereby curtailing future reproduction. In moderate climates with long breeding seasons, females can balance less current reproduction (smaller litters) with greater survival, which allows for increased future reproduction. But as the length of the breeding season declines, with less prospect of future reproduction, particularly in rodents that only survive for one breeding season, the value of increased current reproduction (increased litter size) outweighs the value of future reproduction (Williams 1967). In their review of life histories of Microtus and Myodes, however, Innes and Millar (1994) pointed out that seven studies in four species at a variety of latitudes and elevations differed only slightly in the average number of litters per breeding season, from 1.6 to 2.2, which they argued left little scope for the influence of length of the breeding season on reproductive output. Still, the maximum in that range is nearly 40 % greater than the minimum, a rather substantial difference.
Another evolutionary hypothesis, based on a fairly elaborate mathematical model, states that greater population fluctuations in general will favor larger litter size, which turns my previous arguments on their head (Stenseth and Framstad 1980). A later paper extended this model and reexamined this hypothesis in the context of two Swedish species of arvicoline rodents that have increasing population fluctuations (likely population cycles in the north) and larger litter sizes as latitude increases (Stenseth et al. 1985). The authors concluded that both population variability and nutrition influence the evolution of litter size. However, even if this evolutionary theory is correct, it begs the question: why are some populations much more variable than others in the first place? Increased litter size in response to increased variability requires a prior gradient in variability.
Of course, some factors could influence the evolution of litter size without regard to latitude. For instance, high variability in mortality and frequent population declines could favor greater litter size, whatever the latitude, because of the offspring of individuals with rapid reproduction could coopt more of the available resources, an argument used by Smith (1988) to explain reproductive patterns in pikas (Ochotona spp.). Similarly, species that inhabit temporary habitats created by disturbance likely would experience selection for high reproductive rate because production of larger numbers of dispersers would increase success in finding new suitable habitat, an explanation for the large litters of taiga voles (Microtus xanthognathus) by Wolf and Lidicker (1980).
Because of the variety of evolutionary possibilities and the lack of empirical information regarding the evolution of life history for specific arvicoline populations, I concentrate on functional relationships. Even so, using the argument that differences among species in the same habitat more likely reflect evolutionary differences than differences within the same species in different habitats, one might try to evaluate the role of at least some of the functional and evolutionary factors.
Variability in reproductive traits. Body size and reproductive characteristics can be linked to one another and may change with shifts in the environment, because of both phenotypic plasticity and natural selection. In his reviews of the adaptive features of mammalian reproduction Millar (1977, 1981) first cited 100, then 250 studies of mammals, including 13 species of arvicoline rodents (three from Europe). He concluded that offspring size and growth rates show relatively constant relationships with adult size, whereas litter size and time to weaning are less tightly linked to adult size and more likely to adapt to environmental conditions. Age at weaning varies only slightly and generally occurs around 15 to 20 days old in the species that we are considering, and mean litter size appears to be more variable and easier to relate to environmental conditions.
Determining a representative litter size for a population presents difficulties because arvicolines generally show an increase in litter size associated with increasing size, age, and parity of the breeding female (Keller 1985; Krebs 2013). That all three of these factors influence litter size in the same way should not be surprising because they are positively correlated; older females generally have greater body size, greater parity, and larger litters. Although, mean litter size may only increase by one in each step from juvenile to subadult to adult, such differences can lead to significantly different population growth with different population structure. Because mean litter sizes of populations are not comparable if their age structure is not similar, comparisons of litter sizes among populations can be misleading.
Different investigators report data summarized in different ways, often lumping data across age categories and seasons, which complicates comparisons among populations and species if sampling is not extensive. For instance, many studies lump a wide range of adult body sizes for a given population or species because they consider any breeding female as adult. Although female arvicolines can breed shortly after weaning, at that age they are normally considered to be juveniles. As young voles continue to grow the likelihood of breeding generally increases, as indicated by the increasing frequency of pregnancy in older females. Arvicolines have several molts as they mature, and three age/size classes can be defined after weaning by molting patterns, viz., juvenile, subadult, and adult. But even females in the adult class continue to grow, and older adult females can weigh three times more than breeding juveniles and over 50% more than young adults. Even defining adult size as the average for the adult age/size class can be misleading because mean/median body size depends on the distribution of ages within the class, and some investigators simply report a range of body sizes for adults.
Seasonal trends present another problem for comparisons of litter size. Litter size often decreases as the breeding season progresses. While this can reflect deteriorating physical or nutritional conditions, it often reflects the age structure of the population. Females breeding early in the season have survived over winter (overwintered females), and, assuming little winter breeding, are relatively mature. However, most of the breeding females late in the season are young females, the progeny of the overwintered females. When the more northern arvicolines breed under the snow, the winter breeding season may be longer than during summer, but the litter sizes are generally smaller, which likely reflects the colder temperatures and less abundant food in winter (Pitelka and Batzli 2018). Figure 2 shows an example of both the age/size and seasonal trends, in this case for the brown lemming (Lemmus trimucronatus) near Barrow, Alaska.
Another important influence on body size and litter size is nutrition. Studies of population dynamics and life history rarely include information on the quality of available forage. However, the diet of arvicolines shifts in different habitats as availability of preferred forage changes, and sympatric arvicoline species favor different plant species because of different abilities to tolerate secondary compounds, high fiber, and low nutrient concentrations (Batzli 1985). Thus, nutrition may often explain differences in fertility among populations of the same species in different habitats and of different species in the same habitat.
At least three studies that indicate a significant effect of nutrition on litter size in populations of the same species, and probably on reproductive potential. First, Cole and Batzli (1979) reported that two populations of prairie voles (Microtus ochrogaster) residing in adjacent fields, one in an old alfalfa field with abundant legumes and the other in an old pasture dominated by bluegrass, had different diets, growth rates, body weights, and litter sizes. Those in the alfalfa old field ate mostly legumes (alfalfa and clover) that had high digestible energy, protein, and mineral content, whereas those in the bluegrass old field could not maintain their weight on bluegrass alone and relied on less abundant, non-legume forbs to complete their diet. Mean litter sizes equaled 5.1 in the alfalfa oldfield and 3.7 in the bluegrass oldfield (P < 0.001). The litter size in bluegrass oldfield resembled estimates of mean litter size for prairie voles in oldfield grasslands at similar latitudes from Indiana (Keller and Krebs 1970) to Kansas (Fitch 1957), which varied from 3.1 to 3.6.
In California, Krohne (1980, 1982) studied two populations of Microtus californicus in two different habitats, one at a site dominated by perennial grasses and the other at a site dominated by annual grasses. Voles in annual grassland, where the preferred grass dried and became unpalatable from May to October, only had litters over five months during which mean litter size varied from 4.2 to 5.5. At a site dominated by less preferred perennial grasses that remained green all year round, the voles had significantly smaller litters (monthly mean litter sizes between 2.0 and 3.4 during all months except April when the mean was 5.5). When brought to the laboratory and fed the same diets mean litter sizes for voles from the two populations did not differ.

Figure 2 Mean litter size ± 1 SE for brown lemmings (Lemmus trimucronatus) at Barrow, Alaska in three age categories during the summer and winter breeding seasons (Batzli et al. 1980).
A similar pattern occurred for two populations of two brown lemming (Lemmus trimucronatus). In wet tundra near Barrow, Alaska the lemmings had larger mean litter size during summer than they did in drier tundra near Atquasuk, 100 km to the south. Litter sizes averaged 5.4, 6.5, and 8.0 for juveniles, subadults, and adults, respectively, at Barrow (Figure 2) and 4.3, 5.5, and 7.1, respectively, at Atquasuk (Batzli et al. 1980; Batzli and Jung 1980). The drier tundra at Atquasuk had little of the favorite food of lemmings at Barrow, and the lemmings primarily foraged on less-preferred plants.
Nearly all aspects of life history show variability within a population from season to season and year to year, often associated with changes in age of a cohort or changes in the density of the population (Krebs 2013). Given all this variability, how can one reliably choose the appropriate values to represent any particular population? Most previous authors seem to have chosen mean values for species or populations based upon the largest number of relevant studies that they could find, often using results based on rather small sample sizes (as low as 6). I shall set rather more stringent criteria. I required substantially larger samples (n > 20, most much larger, some by over an order of magnitude) taken across ages, seasons, and years with the hope that such values are more representative of the average reproducing female.
Estimation of a representative length of the breeding season can also be problematical. The breeding season can start and end quickly, but often a few females continue breeding when others have stopped. As a result a criterion such as half or more of the population in breeding condition is often used to delimit the breeding season, but determining breeding condition has its pitfalls. Live trapping studies present several lines of evidence for breeding based on the condition of females or the presence of juveniles in traps. Unless they are born in the traps, the latter requires back calculating to the birth date depending on size, and presumably age, of the young. Condition of the female also presents uncertainties. Those with a perforate vagina can breed, but do not necessarily do so successfully. The occurrence of a pregnant female provides clear evidence of breeding, but pregnancy is not always obvious from external examination. Separation of the pubic symphysis and enlargement of the teats for lactation begin shortly before the birth, but they take varying amounts of time to regress after birth. In the late stages of pregnancy the embryos can be palpated, but necropsy can detect much earlier pregnancy based upon swellings in the uterus. Even with necropsied females, however, early in pregnancy the tiny embryos cause no swelling in the uterus. As a result pregnancies can be missed during the first four to five days (about 20 to 25 % of the gestation period). Relying on the expertise of the authors, I used the occurrence of at least 35 to 40 % of females with signs of pregnancy to determine when the breeding season began or ended.
Even with the problem of determining the actual rate of breeding by females, obvious differences occur between years, usually associated with weather patterns or density of the populations (Krebs 2013). When different years showed different beginnings and ends of breeding seasons, I used mean values for the length of the breeding season.
Of course, the best set of data for calculation of reproductive potential would include the proportion of breeding females and litter size throughout the breeding season, including the differences associated with the age of the females and the age structure of the population. However, few long-term studies give such data, and I have settled for a simplified version of reproductive potential.
Population variability and geography. Most of the geographical analyses of life history have centered on two aspects of reproduction, viz, litter size and length of the breeding season. Lord (1960) reviewed the relationship of litter size to latitude in North American mammals and reported an increase of litter size in vole (Microtus) populations associated with increased latitude. Although he separated the analyses of different taxonomic groups, he sometimes lumped the results for multiple populations of individual species with single populations for other species, thereby introducing taxonomic bias. For instance, for meadow voles (Microtus spp.), three of the ten species had data for more than one population. He did find that latitude accounted for 48 % of the variability in litter size of meadow voles, but his results appeared to depend largely on very low litters sizes for two subtropical montane species (20 to 25° N) and a very high litter size for one high-latitude population (60° N) of M. pennsylvanicus. The rest of the data referred to populations between 35-50° N and appeared scattered. Apparently Lord had no particular criteria for accepting data on litter size other than it being based on embryo counts.
Innes (1978) examined the relationships between mean litter size (embryo counts or live births with a sample size of six or greater), latitude, and elevation in the genera Microtus and Clethrionomys (now Myodes) in North America. Using data for 42 populations of Microtus distributed across 10 species (up to 18 populations in one species) and 16 populations across two species of Myodes. He found fairly strong positive correlations between latitude and litter size (r = 0.66 for Microtus and r = 0.73 for Myodes). Addition of elevation as an independent variable produced a bit larger correlations of 0.77 and 0.81, respectively. Using just the populations within a species produced no significant correlations within any of the four species of Microtus with multiple populations, but there was little variation in latitude and few replicates within a species except for M. pennsylvanicus. Myodes gapperi, which had 12 populations, did maintain a significant correlation (r = 0.65) of litter size with latitude. However, Innes discussed some deficiencies of the data set, like those I have pointed out above, and he noted inconsistencies in litter size for different species at similar latitudes. This led him to suspect the latitudinal patterns. Instead, he suggested that habitat differences (particularly resource availability) and predation regime (balanced mortality hypothesis?) more likely influenced litter size.
In 1994 Innes and Millar reviewed life history information for five species of Myodes and 28 species of Microtus using mean values for species with data for more than one population (up to 45 populations for Myodes glareolus and 47 for Microtus pennsylvanicus). Among the several correlations among traits, was one of particular interest; length of the breeding season had a significant, negative correlation with litter size even after the removal of any effect of female body weight (r = -0.46, P < 0.01). Since increased latitude and elevation tend to shorten breeding seasons, this could help explain any relationships of geography with litter size, although the authors again point out that because of low survival of mature females, the mean number of litters per season may not differ much.
Hansson and Henttonen (1985b) examined the relationship of litter size to variability in abundance of four widespread species of European Myodes (then Clethrionomys). They found no relationship and argued that reproductive output depended more on age at maturation, proportion of reproductive females, and length of the breeding season, all of which differ between the growth and peak phases of cyclic populations and with density in non-cyclic populations. Furthermore, the pattern of increasing variability in abundance moving along a south-to-north transect in Fennoscandia did not occur elsewhere. Later, Boonstra and Krebs (2012) reviewed long-term studies of Myodes in North America and found no relationship between latitude and variability in abundance. I conclude that there appears to be no consistent relationship between geography or litter size and population variability, and it seems likely that if reproductive output influences population variability, at least the length of breeding season also needs to be considered. More sophisticated estimates of reproductive potential, including age at reproductive maturation and proportion of breeding females at different times, require more data than generally available for populations with long-term estimates of relative abundance. So, I calculated the reproductive potential of a typical female based on litter size and length of the breeding season as shown below.
Calculating reproductive potential. Reproductive potential (RP) for a population can be defined as the average number of offspring that can be produced per breeding female over a year (usually one breeding season) assuming that it survives. Therefore, RP is a function of the frequency of reproduction, mean litter size, and the length of the breeding season. Because arvicolines generally have post-partum estrous and induced ovulation, I assume that females can continuously produce litters during the breeding season (a potential, even if unlikely, output). My simplifying assumption means that only two measured parameters are needed to calculate RP, viz. mean litter size (m) and length of the breeding season in weeks (b). Because the minimum time between litters is about three weeks, the maximum number of litters produced in a breeding season is b/3. As a result, RP = m(b/3). Of course, females rarely achieve this rate of reproduction in the field, but even if I assumed some standard length of time between litters, it would not change the relative difference in the number of offspring produced under different combinations of m and b.
A few more northern populations may regularly breed during winter, with hiatuses as the seasons shift before and after summer, and for those populations we need to add potential reproduction in winter to that for summer. For these populations RP = ms(bs/3) + mw(bw/3).
The data set. My data set consists of information on the variability and reproductive potential (litter size and length of breeding season) for particular populations. If the reproductive potential hypothesis is correct, there should be a positive relationship between the two. For the measure of variability I use Heath’s (2006) measure (H) because it does not respond as dramatically to non-normal distributions as do the two more frequently used measures, coefficient of variation and standard deviation of the log of abundance. H = (S(xi-xj/xi))/n where xi is the larger and xj the smaller value for all possible pairs of estimates of abundance, and n is the number of different pairs. Thus, H is the mean of relative differences in abundance across all possible pairs.
I only used data for populations for which there were consistent annual estimates of relative abundance (number captured per unit effort) or absolute density (number per hectare) during the same season and which had been followed at the same site for at least 10 years so that more representative expressions of variability occurred. For populations that were sampled repeatedly during each year, I used a single estimate for the season with the highest densities (sometimes spring and sometimes fall). In addition, I needed estimates of litter size and length of breeding season for that population, or one in a similar habitat at a similar latitude, to calculate RP. Because these life history data vary from year to year and with other factors as discussed above, I used mean values across years, seasons, and demographic categories. Not surprisingly, nearly all data were for the two genera of voles that are most widespread in North America (Myodes and Microtus).
Results and Discussion
Overall pattern. Using the data in Table 1 with one entry for a site where a species has two populations (that with more typical habitat), the relationships between litter size, breeding season, and latitude produced mixed results. Litter size tended to increase with latitude (r = 0.706, n = 17, P = 0.002), length of breeding season tended to decrease with latitude (r = - 0.661, n = 14, P = 0.010), and litter size tended to increase with decreased length of breeding season (r = - 0.796, n = 13, P = 0.001). Thus, my data supported a positive relationship between latitude and litter size, contrary to some earlier studies, but agreed with earlier studies that supported a negative relationship between litter size and latitude. I do not claim that my results for latitude and litter size are definitive, however, because I only looked at populations that had at least 10 years of data on relative abundance. Consistent with previous studies, I found no relationship between litter size and variability in abundance (r = 0.079, n = 16, P = 0.771).
The variability in abundance of arvicoline populations in this study ranged from a low of H = 0.327 for Microtus breweri to a high of H = 0.744 for Lemmus trimucronatus, a greater than two-fold difference (Table 1). These populations also had reproductive potentials at the top (RP = 58 for L. t.) and bottom of the scale (RP = 27 for M. b.), again over a two-fold difference. I was unable to complete the table for all of the populations for which I found data that met my criteria for calculation of variability because of missing data required for the calculation of reproductive potential (mostly on length of the breeding season). Nevertheless, the data for the 16 populations indicated substantial differences among populations within the same species. For instance, the variability of four populations of Myodes gapperi that occurred in coniferous forest at latitudes from 48 to 61° N had H = 0.409-0.524, the largest almost 30 % greater than the smallest, and the four populations at latitudes from 40 to 45° N in mixed hardwood/conifer or hardwood forests had H = 0.447-0.726, the largest over 60 % greater than the smallest. The population of M. gapperi studied by Fryxell et al. (1998) occurred in a variety of forests from all hardwoods to a mixed forest to all conifers, and so was not comparable. For Microtus ochrogaster, a population in grassy oldfield in Illinois had a variability (H = 0.726) over 30 % greater than a population in grassy oldfield in Kansas (H = 0.548).
Given the lack of consistency within and among species, it comes as little surprise that only a small positive correlation between H and RP occurred among all 16 populations (r = 0.291, P = 0.274). This provided little support for the RP hypothesis, which predicts increasing variability with increasing reproductive potential.
Intraspecific comparisons. The study of Cole and Batzli (1979) on the influence of nutrition on local populations of the prairie vole (M. ochrogaster) in central Illinois provided the data necessary to calculate reproductive potential and population variability for local populations in alfalfa old field (higher quality diet) and bluegrass old field (lower quality diet). Over the five years of their study, the voles in alfalfa had a 38 % larger mean litter size than those in bluegrass (5.1 and 3.7, respectively) and 43 % greater reproductive potential (RP = 60 and 42, respectively). The populations had synchronous populations cycles, but, as mentioned above, the population in alfalfa reached peak densities that were twice those in bluegrass. We did not evaluate the population in tallgrass prairie, which had much lower densities. Meadow voles (M. pennsylvanicus) invaded the bluegrass habitat in 1975 and the alfalfa habitat in 1976. After that the population dynamics of the prairie vole became somewhat different, populations appeared to have double peaks that occurred over two successive growing seasons. Nevertheless, over a 25-year span both populations of prairie voles had H = 0.726, a remarkable coincidence (Table 1). These results did not support the RP hypothesis.
Getz et al. (2001) also reported on long-term data the meadow vole (M. pennsylvanicus) at the same sites as for prairie voles. Meadow voles generally occurred in much lower densities in alfalfa, so I only compare populations in bluegrass oldfield and tallgrass prairie. Over the years the trapping sites in tallgrass shifted among locations that were separated by a road and about 500 meters of oldfield and second-growth forest, and I only analyzed the data for the 10 successive years during which trapping in tallgrass occurred at the same location. Meadow voles showed a greater preference for monocots than did prairie voles (DeJaco and Batzli 2013), and the quality of the meadow vole diet probably did not differ much between the two habitat types. I therefore assumed that the litter sizes did not differ either, in which case their reproductive potentials would be equal. Given this assumption, the very similar variability of populations in the two habitats (H = 0.495 for tallgrass and H = 0.468 for bluegrass, the former only 6 % higher) supported the RP hypothesis. Although the meadow vole populations did not appear to cycle, densities in the tallgrass averaged about twice those in the bluegrass, in this case apparently reflecting greater cover and survival rather than higher quality food and reproduction (Getz et al. 2001).
Mihok et al. (1985b) monitored the meadow vole in old-field grasslands by live trapping and snap trapping in Manitoba, Canada. Although the authors do not present separate data on litter size for the two populations, they occurred in similar habitats (grassy old fields) at the same site, and it seems reasonable to assume that their reproductive potential would be similar. Nevertheless the populations had rather different variability; snap trapping (H = 0.733) produced 20 % higher variability than did live trapping (H = 0.610). Again, these results do not support the RP hypothesis, and they raise questions about how differences in local populations in similar habitats and differences in technique influence measurements of variability.
Although separated by hundreds of miles, the populations of M. ochrogaster in grassy oldfields in Illinois and Kansas occured in similar habitats at similar latitudes (Table 1). Reproductive potential was higher in Illinois (RP = 43) than in Kansas (RP = 33), and in agreement with the RP hypothesis, population variability followed the same pattern (H = 0.726 in Illinois and H = 0.548 in Kansas). A similar long-distance comparison of M. gapperi populations in coniferous forests, again separated by hundreds of miles but at different latitudes (50° N and 61° N) produced the opposite result, higher reproductive potential but lower variability at 50° N (Table 1). So three of five intraspecific comparisons did not support for the RP hypothesis.
Interspecific comparisons. Comparison of two species of Microtus in the same habitat over the same time period, bluegrass old fields in central Illinois (Table 1), showed that the species with greater reproductive potential (RP = 52 for M. pennsylvanicus and RP = 43 for M. ochrogaster) had less population variability (H = 0.468 for M. pennsylvanicus and H = 0.726 for M. ochrogaster). A second comparison of two species at the same site but different habitats (M. pennsylvanicus in grassy old fields and Myodes gapperi in coniferous forest in southern Manitoba) produced a similar pattern. Although M. pennsylvanicus (RP = 29) had a lower reproductive potential than M. gapperi (RP = 44), it had much higher variability (H = 0.610-0.733 and H = 0.409, respectively). Fuller (1969, 1985) compared two parapatric species of Myodes at the same latitude in taiga, and reported very similar reproductive parameters (RP = 28 for both species) but about 20 % greater variability in M. rutilus (H = 0.519) than in M. gapperi (H = 0.437). Thus, none of these three interspecific comparisons support the RP hypothesis.
Maximum abundance and reproductive potential. Earlier I cited three cases that suggested an impact of local food availability on litter sizes of arvicoline rodents by comparing populations of the same species in different habitats. Lemmus trimucronatus at Atquasuk had a mean litter size of 6.3 in summer about 85 % of the 7.4 for Barrow, and assuming similar winter and summer breeding seasons at the two sites, RP = 49 at Atquasuk compared to RP = 58 at Barrow. Maximum densities at Barrow were two to three-fold greater than those at Atquasuk (Pitelka and Batzli 1993).
In Illinois the reproductive potential for Microtus ochrogaster in an alfalfa oldfield (RP = 59 was 37 % greater than in a grassy oldfield (RP = 43), and maximum densities in alfalfa were about two-fold greater (Getz et al. 2001). Krohne (1980, 1982) also found greater densities in the habitat with greater reproductive potential. In this case Microtus californicus in annual grassland (RP = 45), with a mean litter size of 5.2 and a breeding season of 26 weeks, had greater reproductive potential than in perennial grassland (RP = 37) where it had a mean litter size of 2.9 and a breeding season of 38 weeks. Surveys of runway densities, which were loosely correlated with live trapping results, indicated five-fold greater maximum densities in annual grassland. Thus, although increased reproductive potential alone may not cause increased population variability, it may influence the maximum densities of populations, which opens up a new line of inquiry.
Table 1 Location, variability in abundance, litter size, length of breeding season, and reproductive potential for North American arvicoline rodents with long-term data on variability in abundance.
| Species | Location | Latitude | No. of Variability Mean Litter Breeding Reproductive | References | ||||
|---|---|---|---|---|---|---|---|---|
| (state or province) | (ON) | Years1 | (H2) | Size | (wks.) | Potential3 | ||
| Lemmus trimucronatus | Alaska | 71 | 22 | 0.744 | 7.4/3.0* | 13/26 | 58 | Pitelka 1973, Pitelka and Batzli 2018 |
| Microtus breweri | Massachusetts | 41 | 15 | 0.327 | 3.4 | 24 | 27 | Tamarin et al. 1987, Tamarin 1977 a, b |
| M. californicus | California | 40 | 11 | 0.434 | 5 | 26 | 43 | Lidicker 1973 |
| M. ochrogaster | Illinois - alfalfa | 40 | 25 | 0.726 | 5.1 | 35 | 59 | Getz et al. 2001, Cole and Batzli 1979 |
| Illinois - bluegrass | 40 | 25 | 0.726 | 3.7 | 35 | 43 | Getz et. al. 2001, Cole and Batzli 1979 | |
| Kansas | 39 | 22 | 0.548 | 3.4 | 29 | 33 | Brady and Slade 2004, Fitch 1957, Fitch et al. 1984 | |
| M. montanus | B. Columbia | 51 | 15 | 0.647 | ? | 24 | ? | Sullivan et al. 2021 |
| Wyoming | 44 | 16 | 0.626 | 6.3 | 18 | 38 | Pinter 1986, Negus et al. 1977 | |
| M. pennsylvanicus | Illinois - tallgrass | 40 | 10 | 0.495 | 4.5 | 35 | 52 | Getz et al. 2001, Keller and Krebs 1970 |
| Illinois - bluegrass | 40 | 10 | 0.468 | 4.5 | 35 | 52 | Getz et al. 2001, Keller and Krebs 1970 | |
| Manitoba - live | 50 | 11 | 0.61 | 3.8 | 23 | 29 | Mihok 1984, Iverson and Turner 1976 | |
| Manitoba - snap | 50 | 14 | 0.733 | 3.8 | 23 | 29 | Mihok et al. 1985, Iverson and Turner | |
| Myodes californicus | Oregon | 44 | 12 | 0.655 | 2.6 | 34 | 29 | Gashwiler 1970, 1977 |
| M. gapperi | NWT | 61 | 11 | 0.437 | 5.6 | 15 | 28 | Fuller 1969, 1985 |
| B. Columbia | 50 | 21 | 0.498 | ? | ? | ? | Sullivan et al. 2017 | |
| Manitoba | 50 | 14 | 0.409 | 6 | 22 | 44 | Mihok et al. 1985a, 1985b; Perrin 1979 | |
| Ontario | 48 | 43 | 0.529 | ? | ? | ? | Fryxell et al. 1998 | |
| Minnesota | 48 | 13 | 0.524 | 6.1 | ? | ? | Krefting and Ahlgren 1974, Beer et al. 1957 | |
| Quebec | 45 | 11 | 0.726 | 4.6 | ? | ? | Grant 1976, Wrigley 1969 | |
| Maine | 44 | 22 | 0.447 | 4.3 | ? | ? | Elias et al. 2006, Patric 1962 | |
| Vermont | 44 | 16 | 0.694 | 4.3 | ? | ? | Brooks et al. 1998, Patric 1962 | |
| Pennsylvania | 40 | 21 | 0.494 | 4.3 | ? | ? | Merritt et al. 2001, Gifford and | |
| M. rutilus | Northwest Territories | 61 | 11 | 0.519 | 5.7 | 15 | 28 | Fuller 1969, Fuller 1985, Martell and Fuller 1979 |
| Yukon | 61 | 23 | 0.582 | 6.2 | 18 | 37 | Boonstra and Krebs 2006, Gilbert and Krebs 1991, Krebs and Wingate 1985 |
1Number of successive annual estimates of relative abundance.
2Heath’s measure of variability of abundance (see text).
3Estimated length of breeding season.
My review of literature and analysis of the data in Table 1 appears to refute the RP hypothesis, and I conclude that no simple relationship exists between variability in abundance of arvicoline rodents and either litter size or reproductive potential. Clearly, other factors must be involved in producing the observed patterns, either those influencing reproductive success (such as variability in the proportion of breeding females, the age at first reproduction, or in the length of the breeding season in response to physical conditions, food supply, and/or population density) or those influencing survival/dispersal (such as changes in physical conditions, food supply, density of the arvicolines, and/or density of their enemies). Indeed some might argue that in light of complex temporal variation in the population dynamics of arvicolines, it’s rather naive to expect simple causal relationships.
Of course, my results might differ if all the studies had been based on simultaneous monitoring of abundance and reproduction done at the same season and over the same time interval, but even then the idiosyncrasies of population fluctuations can make the characterization of their variability difficult. Most populations seem to go through sustained periods of unusual densities, either high or low, so measurement of variability for any given population depends in part on the span of years the investigator chooses to document. For instance, in the longest record of abundance in Table 1, the 43 years of observations on M. gapperi reported by Fryxell et al. (1998), four of the five highest abundances in the whole series came in the last four years of observation. With little difference in minimum abundances, this resulted in H = 0.435 for the first 22 years, and almost a 40 % increase to H = 0.605 for the last 21 years.Still, one possible generalization comes out of this analysis and deserves further study, viz., populations with greater reproductive potential tend to reach higher maximum densities. This generalization, based upon data from natural populations, agrees with experimental results, which show that the reproductive output and density of vole populations increase with improved availability of nutrients (Cole and Batzli 1978; Desy and Batzli 1989; Forbes et al. 2014).

