SciELO - Scientific Electronic Library Online

 
vol.11 número3Woody plant encroachment drives habitat loss for a relict population of a large mammalian herbivore in South AmericaA new bat species of the genus Myotis with comments on the phylogenetic placement of M. keaysi and M. pilosatibialis índice de autoresíndice de materiabúsqueda de artículos
Home Pagelista alfabética de revistas  

Servicios Personalizados

Revista

Articulo

Indicadores

Links relacionados

  • No hay artículos similaresSimilares en SciELO

Compartir


Therya

versión On-line ISSN 2007-3364

Therya vol.11 no.3 La Paz sep. 2020  Epub 30-Abr-2021

https://doi.org/10.12933/therya-20-995 

Special contributions

Distributional patterns of the Brazilian free-tailed bat Tadarida brasiliensis in the Peruvian territory

Orlando Zegarra1  * 

Jaime Pacheco1  2 

Víctor Pacheco1 

1 Museo de Historia Natural, Universidad Nacional Mayor de San Marcos. Av. Arenales 1256, Lima 15072, Perú. Email: orzegarra@gmail.com (OZ), vpachecot@unmsm.edu.pe (VP).

2 Centro de Investigación Biodiversidad Sostenible (BioS), Francisco de Zela 1556, Lima 14. Lima, Perú. Email: biojpacheco@gmail.com (JP).


Abstract:

The molossid bat Tadarida brasiliensis has a wide and apparently continuous distribution in South America. Although it has been reported in several localities of both versants of the Peruvian Andes, the potential distribution for this species has not been formally analyzed. Therefore, we describe its distributional pattern in the territory and provide comments about the possible influence of the Andes in its distribution. We gathered occurrence records from museums, acoustic surveys, literature, GBIF and Vertnet sources, and we selected localities to minimize spatial correlation. After defining a minimum-convex polygon of Peruvian records as background area, we use Maxent software with bioclimatic variables to construct species distribution models. Several models were evaluated using different metrics, and the model with the lowest AICc was selected. Then, the model was projected for Peruvian territory. Tadarida brasiliensis is reported for the first time in Cajamarca, Piura and Ica departments. The potential distribution model showed two disjunct suitable areas, one for the Pacific versant and other for the Amazonian versant of the Andes, but connected with moderate suitable conditions in the Huancabamba Depression region in northern Perú. Mean diurnal range and annual mean temperature were identified as the main limiting factors for the potential distribution of this species in this territory. Tadarida brasiliensis exhibits a discontinuous distribution in the Peruvian territory. In northern part, the Huancabamba depression zone has climatic conditions that may allow the east-west dispersal for this species. In central and southern parts, the higher crest of the Andes (> 4,500 m) has low suitable conditions due to the extreme climate. In the eastern, the lowland Amazonian forests has low suitability for this species, probably due to high temperatures. We suggest that the Andes could be acting a biogeographical barrier that limits the dispersal for this species, but population-genetic studies are needed to confirm this hypothesis. We identified that temperature is the main climatic factor that limit the dispersal of this bat. In conclusion, T. brasiliensis is mainly associated with desert and Andean slopes ecosystems in Perú, and we highlight the importance of incorporating acoustic records in the analysis of its distribution patterns.

Keywords: Andes; geographic barrier; maxent; potential distribution; suitability

Resumen:

El murciélago molósido Tadarida brasiliensis tiene una distribución amplia y aparentemente continua en América del Sur. Si bien se ha reportado en varias localidades de ambas vertientes de los Andes peruanos, la distribución potencial de esta especie no ha sido analizada formalmente. Por lo tanto, describimos el patrón de distribución de T. brasiliensis en el territorio peruano y brindamos comentarios sobre la posible influencia de los Andes en su distribución. Recopilamos registros de ocurrencia de museos, estudios acústicos, literatura, GBIF y Vertnet, y seleccionamos localidades para minimizar la correlación espacial. Después de definir un polígono mínimo convexo en base a los registros peruanos como área de calibración, usamos el software Maxent con variables bioclimáticas para construir modelos de distribución de especies. Se evaluaron varios modelos utilizando diferentes métricas y se seleccionó el modelo con el AICc más bajo. Luego, se proyectó este modelo en el territorio peruano .Tadarida brasiliensis es reportada por primera vez en los departamentos de Cajamarca, Piura e Ica. El modelo de distribución potencial mostró dos áreas adecuadas disjuntas, una para la vertiente del Pacífico y otra para la vertiente amazónica de los Andes, pero conectadas por las condiciones idóneas de la región de la Depresión de Huancabamba en el norte de Perú. El intervalo medio de temperatura diurna y la temperatura media anual fueron identificadas como los principales factores limitantes para la distribución potencial de esta especie en este territorio. Tadarida brasiliensis exhibe una distribución discontinua en el territorio peruano. En la parte norte, la zona de depresión de Huancabamba tiene condiciones climáticas que pueden permitir la dispersión este-oeste de esta especie. En las parte central y sur, los picos más altos de los Andes (> 4,500 m) tiene bajas condiciones adecuadas debido al clima extremo. En el este, los bosques amazónicos de las tierras bajas tienen baja idoneidad para esta especie, probablemente debido a las altas temperaturas. Sugerimos que los Andes podrían estar actuando como una barrera biogeográfica que limita la dispersión de esta especie, pero se necesitan estudios genéticos-poblacionales para confirmar esta hipótesis. Identificamos que la temperatura es el principal factor climático que limita la dispersión de este murciélago. En conclusión, T. brasiliensis se asocia principalmente con ecosistemas desérticos y de laderas andinas en el Perú, y destacamos la importancia de incorporar registros acústicos en el análisis de sus patrones de distribució n.

Introduction

The Brazilian free-tailed bat Tadarida brasiliensis is a small-size insectivorous bat with one of the widest distributions in the western hemisphere (Wilkins 1989). It occurs in an extensive variety of habitats, ranging from deserts to montane humid forest (Eger 2007), with the ability to forage from the ground up to 3,000 m (McCracken et al. 2008). In South America, only the subspecies T. b. brasiliensis is recognized (Schwartz 1955). Based on individuals from the east versant of the Andes and the subantarctic sub-region, Morales et al. (2018) suggest it apparently conforms to one genetic group. The potential distribution of the species showed it is strongly associated to the Andes (Escobar et al. 2015; Romero 2018), with few records in much of Amazonia (Eger 2007), and presumably absent in lowland forest ecosystems (Wilkins 1989).

In the Peru, this species has been reported in the Equatorial dry forest, the coastal desert, the steppe, the Yungas and the lowland forests ecoregions (Pachecoet al.2009). Due to the variety of occurrence records (Acha and Zapatel 1957; Solari et al. 2001; Zeballos et al. 2001; Mena and Williams 2002; Zelada et al. 2014; Aragón and Aguirre 2014), it is believed that this species presents a continuous distribution in this country (Eger 2007; Barquez 2018). However, the Andean Cordillera, is recognized as a great biogeographical barrier that limits the dispersal of many mammalian species, particularly in bats, between the Pacific and Amazonian versants and could drastically affect T.brasiliensis perceived distribution in the country (Koopman 1978; Patterson et al.2012). To date, no analysis of the influence of the Andes, or how environmental conditions, influence the distribution patterns of T. brasiliensis in Perú has been conducted.

Species distribution models (SDMs) are frequently used for assessing the potential distribution of species (Razgour et al. 2016), based on occurrence records and the environmental characteristics of these localities (Franklin 2010). The main assumption of the models is that the climate of these localities represents part of the environmental component of the species’ niche (Peterson and Soberón 2012), and therefore, it is possible to predict suitable areas for species presence. Determining most suitable areas could help us better understand possible geographical and environmental barriers for the species’ distributions, and also provide information on its likely dispersal limitations (Barve et al. 2011).

The aim of this study is to describe the distribution patterns of T. brasiliensis in Perú using species distribution models and explore the possible influence of the Andes. Here, we test the hypothesis that T. brasiliensis has a continuous distribution in Perú, including the Andes mountain chain. Additionally, we report novel records in the territory and highlight priority research locations for this species.

Materials and Methods

Occurrence data. Occurrence data were selected from 139 records gathered from the following sources: the collection of mammals, Museo de Historia Natural de San Marcos (MUSM; n = 51) in Lima, bat acoustic surveys (this work, n= 26), literature (Acha and Zapatel 1957; Zeballos et al. 2001; Pari et al. 2015; Morales et al. 2018; Portugal 2018; n = 30), the Global Biodiversity Information Facility (GBIF 2019; download on July 8, 2019; n = 11), and Vertnet (Constable et al. 2010; download on August 7, 2019; n = 22). In order to avoid sampling bias caused by spatial correlation (Razgour et al. 2016), localities used as occurrence data were manually chosen such that no two localities were separated less than 25 km, which is the approximate mean displacement of T. brasiliensis for foraging flights from their roost (Allen et al. 2009). For GBIF and Vertnet sources, only records from scientific collections were considered to avoid spatial bias in the distribution (Beck et al. 2014). The majority of the occurrence records (74 %) were dated after 1960. All records covered a temporal range from 1900 to 2019. See selected locality details in Appendix 1.

The acoustic surveys were performed in 23 localities distributed across eight departments of Perú: Ayacucho, Cajamarca, Ica, La Libertad, Lima, Piura, Puno and Tacna, from 2014 to 2019. Recordings were obtained by performing active monitoring in acoustic transects, using Pettersson ultrasonic detectors D240x and M500-384 plugged into digital recorders or mobile phone devices. Recording sessions were performed between 18:00 and 23:00 hrs, in rainless conditions, for one night per site (Kingston 2016). We selected pulses in which the search phase consists of a downward quasi-constant frequency component ranging from 30 kHz to 26 kHz, described as characteristic for this species (Gillam and McCracken 2007; Arias-Aguilar et al. 2018). The sound files are stored in the MUSM for further studies involving the development of an acoustic library for Perú.

Novel localities are reported using the political departments of Perú. For the biogeographical analyzes, we used the terrestrial ecoregions of the world (Olson et al. 2001) and the biogeographic regionalization of the Neotropical region (Morrone 2014).

Study area. Two types of geographical spaces were delimited: the background and the projection areas. The background area must offer a good coverage of the conditions within the species environmental tolerance (Anderson 2013), and at regional scales, using a specific area to model partial-niche produce more sensitive models (Razgour et al. 2016). Thus, we calculated a minimum-convex polygon based on our occurrence data (Brown 2014) and applied a buffer of 50 km. As projection area, we used the layer of the Peruvian territory obtained from Instituto Geográfico Nacional (IGN, www.idep.gob.pe), assuming that it represents an accessible area for this species (Barveet al.2011) and considering that climatic conditions within this area were well represented by the background area (Anderson and Raza 2010). All the geospatial operations were done using ArcMap 10.5.1 (Esri 2016).

Environmental data. Bioclimatic data from the global interpolated climate database WorldClim 1.4 were used (Hijmans et al. 2005) with a grid resolution of 30 arc-seconds (~1 km). We downloaded 15 variables representing current climate, but removed Bio 8, Bio 9, Bio 18 and Bio 19 because they can have spatial abnormalities (Escobaret al.2014). We masked these climatic rasters to the extent of the background area to generate background point. To avoid multicollinearity (Elith et al. 2011), a Spearman’s correlation test between variables were performed using the R package fuzzySim 3.0, to select variables with correlation values lower than 0.85 (Syfert et al. 2013). Also, we selected variables considering their relevance to the representative Peruvian climate (Schwarb et al. 2011), as well as their relationships with the occurrence of T. brasiliensis (Duff and Morrell 2007; Hristov et al. 2010).

Distribution model. We constructed an SDM using the maximum entropy algorithm Maxent 3.4.1 (Phillips et al. 2018). The background area was used to calibrate the model, and then projected to the Peruvian territory. For calibration, different models were built with 10,000 random background points and evaluated with spatial cross validation. We explored different complexity settings for Maxent: regularization multipliers in intervals of 0.5, ranging from 1.0 to 5.0, and feature class combinations L, Q, H, LQ, LH, QH, LQH, LQHP, and LQHPT, where “L” is linear, “P” is product, “Q” is quadratic, “H” is hinge and “T” stands for threshold (Radosavljevic and Anderson 2014). We performed the evaluation process with the spatial cross validation procedure “checkerboard2” (aggregation factor = 4) using the R package ENMeval 0.3.0 (Muscarella et al. 2014) with R 3.5.3 (R Core Team 2019). We evaluated variable importance with Maxent´s variable jackknife test (Phillips et al. 2006). Following Warren and Seifert (2011), the model selection was made based on the Akaike information criteria corrected for small samples (AICc) that provide a comparison of the most informative and parsimonious model (Razgouret al.2016). We use the metrics of the model with lowest AICc value and projected it using the Maxent cloglog transformation. Model evaluation details can be found in Appendix 2 and model response curves in Appendix 3.

Results

We found that T. brasiliensis is found from sea level (MUSM 4,793, 5,368; Lima department) to 4105 m (ROM 93863, 93868; Junín department) in Perú. In the Pacific versant, the species was found up to 3,149 m (via ultrasonic record), whereas on the Amazonian versant most records are in the Andean piedmont (>1047 m), and only two records are reported in the lowland eastern humid forest of Perú at 360 m (MUSM 6045 194441; San Martín department). With acoustic surveys, we reported for the first time its presence in Cajamarca, Piura and Ica departments. We recognized the occurrence of T. brasiliensis in the Desert and the Puna provinces of the South America transition zone, in the Ecuadorian province of the Pacific Dominion, and in the Yungas, the Ucayali and the Rondônia provinces of the South Brazilian dominion.

We selected five variables as most ecologically relevant and not highly correlated (Table 1). Then, from 81 computed models using these variables, we chose the model with the lowest AICc obtained with following parameters: LQ as features class combination and 1 as regularization multiplier (AUCtrain: 0.7836, AUCtest: 0.7211, OR10: 0.0912, AICc: 1073.82, ΔAICc: 0). Based on the evaluation results (Appendix 2 and 4), we observed that in models with more parameters, the average AUCtest increase, which means that these models are stricter than the others. But we also observed that AUCdiff and the OR10 increase with more complexity, what is typically related to overfitting in these more complex models. Our selected model presents less complexity but also the less overfitting in comparison with other models.

Table 1 Selected variables contribution. Selected bioclimatic variables and their contribution in the selected model. 

Variables Contribution
Potential Distribution Model Percent contribution Permutation importance
Mean Diurnal Range (Bio 2) 57.4731 64.8406
Annual Mean Temperature (Bio 1) 18.4447 28.2832
Temperature Annual Range (Bio 7) 6.6362 6.8761
Precipitation Seasonality (Bio 15) 3.3811 0.000
Annual Precipitation (Bio 12) 14. 0648 0.000

Bioclimatic variables with the greatest influence in the distribution of T. brasiliensis were mean diurnal range of temperature (Bio 02) and annual mean temperature (Bio 01), which contribute to 64.8 % and 28.3 % to the model, respectively. Response curves of each variable (Appendix 3) showed that annual temperatures between 15 to 20°C present predicted values over 0.5, while temperatures over 10°C in mean diurnal ranges reduce significantly the predicted values of occurrence. The jackknife test showed that the variable with the highest gain when used in isolation was annual mean temperature, while the one which decreased the gain the most when omitted was mean diurnal temperature.

The SDM showed a slightly disjunct distribution for T. brasiliensis in Perú, where two different core areas with high suitability values (> 0.5) were obtained (Figure 1). The first area corresponded to the coastline ecosystems in the Pacific versant of the Andes, included in the Desert and Xeric Shrublands biome, where higher predictive values seem to be restricted to the Sechura desert and Tumbes-Piura dry forest ecoregions. The other area corresponded to Andean slopes ecosystems in the Amazonian versant, where higher predictive values were detected above 1000 m, in the Yungas and wet Puna ecoregions. In northern Perú, a moderately suitable area in the Huancabamba Depression region, connects the western and eastern suitable areas. The higher part of the Andes (above 4500 m elevation) exhibited low environmental suitability (< 0.2) for this species. Similarly, the lower Amazonian forest had low environmental suitability (< 0.4).

Discussion

It was previously reported that T. brasiliensis has a broad and continuous distribution in Perú (Wilkins 1989; Eger 2007; Barquez et al. 2015); however, based on our model, we reject that hypothesis. Our correlative model predicted that this species has a largely discontinuous distribution in the country, where two disjunct areas with high suitability values could be identified: the Pacific and Amazonian versants, separated by the Andes. Contrary to the model presented by Escobar et al. (2015), we identified highly suitable environmental conditions in the coastal and Andean slopes ecosystems. Furthermore, supporting Wilkins (1989), we found this species is mostly absent in lowland forest of the Amazonia.

Based on the localities of occurrence and the predictions of the model, we identified two areas in the Peruvian territory that have not been sampled enough or remain unassessed for this species: the Huancabamba depression zone and the eastern slopes of the central Peruvian Andes. In the Huancabamba depression zone, although the SDM showed moderate suitability (0.4 to 0.6), no specimens are known to occur in this zone or in the vicinity (less than 25 km). Thus, we consider that the Huancabamba depression zone remains poorly studied and requires increased focus on bat research priorities. On the other hand, the eastern slopes of the central Peruvian Andes -specially the zone between Junín and Pasco departments- where our model indicated moderate suitability (~ 0.6) is one the better surveyed areas in the country (Mena 2010; Arias et al. 2016). We believe that T. brasiliensis has yet to be detected in this geographic area, because most surveys have only used mist nests, a methodology with only moderate efficiency when in collecting insectivorous bats (Rydell et al. 2002).

Despite the information gaps, we consider that our model efficiently represents the environmental niche of this species in Perú, in great part because our occurrence data covered a great part of the territory. We accomplished this, by incorporating ultrasonic records which increased data occurrence in about 41 % (Appendix 1); therefore, we support recent suggestions that acoustic surveys contribute and complement traditional methodologies in studying insectivorous bat species (Hintze et al. 2019).

Our model estimated only a moderate suitability index (~ 0.6) in the dry forests of the Huancabamba depression. Although this zone was proposed as an important biogeographical barrier for montane species (Weigend 2004), this region was also suggested as an east-west corridor that allow gene flow in Sturnira erythromos and likely other species (Pacheco and Patterson 1992). We currently lack occurrence data for T. brasiliensis in this region, but considering the low elevation of the Andean in this area (Pacheco 2002), we propose that the species likely uses the depression to connect populations on the eastern versant with those of the western versant of the Andes. Future biological inventories in the area will test this hypothesis.

On the other hand, in central and southern Perú, our model revealed broad separation in the suitable environmental conditions for the potential distribution of the species. Due to the topographic characteristics and the extreme climate conditions in the higher elevations (Garreaud 2009), the Andes are considered as important biogeographical barrier for several groups of mammals (Patterson et al. 2012). However, the role of the Andes as a biogeographic barrier for bats has seen little debate since the pioneering works of Koopman (1978) and Pacheco and Patterson (1992), but it has been argued that only few bat species are capable of inhabiting high elevations (Patterson et al. 1998). Although T. brasiliensis has the ability to fly up to 3,000 m above the ground to forage (McCracken et al. 2008), our model suggest that this species is limited by extreme climatic conditions on the highest parts of the central and southern Andes, likely due to cold weather and permanent snow (Garreaud 2009). Additionally, we believe that biological factors could also influence its distribution in the higher elevations of the Andes (Krauel et al. 2018). For example, the diet of T. brasiliensis includes coleopterans, lepidopterans, hemipterans and dipterans (Lee and McCracken 2002; Alurralde and Díaz 2018), but the diversity and abundance of these insects declines with increasing elevation (Hodkinson 2005). Therefore, reduced prey availability could make it difficult for this species to inhabit the higher Andes.

Furthermore, our model also revealed high suitable conditions restricted to the deserts and Lomas ecosystems of the Pacific versant (Figure 1). As in other western bat species in Perú, such as Artibeus fraterculus (Patterson et al.1992) and Glossophaga soricina (Webster 1993), the homogeneous climatic conditions of this ecoregion (Rundel et al.1991) could have allowed the latitudinal dispersal of T. brasiliensis close to the coastline (Wiens and Donoghue 2004). However, the biogeographical processes by which this species arrived to these ecoregions are still unknown (Lim 2009). We believe that the Huancabamba depression is closely related to the distributional patterns in South America, but population-level phylogenetic studies of the individuals from the central Andean mountains and Pacific versant are needed to test dispersal hypothesis.

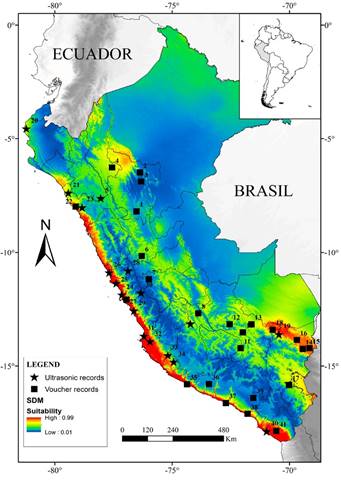
Figure 1 Selected localities and the potential distribution model (SDM) of T. brasiliensis in the Peruvian territory. 

Based on our model, it could be expected that individuals from the eastern and western versant have accumulated some degree of genetic variation. Genetic differentiation between individuals from different versants has been reported for other Neotropical bats, resulting in some cases in the validation or description of new species, such as Lophostoma occidentalis (Velazco and Cadenillas 2011), Sturnira bakeri (Velazco and Patterson 2014), and Artibeus aequatorialis (Larsen et al. 2010). In North America, studies on intraspecific genetic variation for T. brasiliensis suggested that genetic structure is correlated with niche differentiation (Morales et al. 2016) and not with the currently recognized subspecies boundaries (Russell and McCracken 2005; Morales et al. 2016). Morales et al. (2018) found that individuals of T. brasiliensis from South America formed a unique population group based on the combined analysis of molecular and morphometric data; however, their study did not include representative data for populations from the Pacific versant of Perú or Ecuador. Thus, we highlight that a genetic survey for T. brasiliensis considering samples from both versants is badly needed.

In the Amazonian versant, our model reveals that lowland humid forests ecosystems present few suitable areas for the species (Figure 1). Although the distribution map of Wilkins (1989) seems to include a small part of Amazonia with this ecosystem, and Pacheco et al. (2009; 2015) stated the species was present in the lowland forest ecoregion (sensuBrack-Egg 1986), we found only two records in lowland forests (San Martin Department). In the apparent absence of east geographical barriers for bats in Perú (Proches 2006) and considering the ability of this bat to fly long distances (McCracken et al. 2008), the limitation of dispersal for T. brasiliensis in this ecosystem is probably related with climate conditions and/or biotic interactions (Peterson and Soberón 2012). The climate in lowland Amazonian forests is characterized by high precipitation and temperature (Vieira et al. 2004), with remarkable seasonal variation in the southeast (Jenkins 2009). Since our models revealed that the potential distribution of T. brasiliensis is highly influenced by mean diurnal range and annual mean temperature, and considering that ambient temperatures affect metabolic rates in bats (Reichard et al. 2010), it is likely that high temperatures in this ecosystem are one of the most important limiting factors for the species. Although it was documented that T. brasiliensis prefers temperatures between 22 to 32 °C to develop optimally (Herreid 1967), response curves of our model showed that suitable values of temperature vary between 15 to 20 °C in the Perú; higher temperatures may generate hyperthermia in this bat, limiting its dispersal and supporting what we stated.

Additionally, in the Amazonian forests, there are other possible limiting factors. The high plant diversity (Cardoso et al. 2017) and dense coverage that characterize the lowland tropical forest (Nogueira et al. 2005; Nabe-Nielsen 2001) could limit the open-space flight of insectivorous bats such as T. brasiliensis (Fenton 1990; Kalko 1997). In addition, it is reported that this species usually roosts in caves or human dwellings (Allen et al. 2009), which are scarce in this type of forest (García-Rosell 1965; Kvist and Nebel 2000); thus, potential roosting sites may represent another factor that restricts the niche of T. brasiliensis in this territory.

In general, our model suggests T. brasiliensis is mainly associated with deserts and Andean slopes ecosystems (Figure 1). Further, a great number of locality records in South America and previous work on potential distributions support this pattern (Escobar et al. 2015). However, due to the difficulties in capturing T. brasiliensis with conventional methods (Rydell et al. 2002), we highlight the importance of incorporating acoustic records proceeding from reliable sources to increase the number of records and therefore to improve modelling precision, especially when certain Andean and Amazonian regions remain poorly studied. Notably, the ecological mechanisms associated with geographical dispersal in South America and potential speciation in widespread species, such as T. brasiliensis, has yet to be completely investigated (Pyron and Burbrink 2009).

Acknowledgment

We thank to A. Morales for sharing her data. Also, to P. Sánchez-Vendizú for her recommendations in preliminary drafts. We are grateful to A. Almeyda and S. Grillo for their support in acoustic sampling and analysis. We thank to N. Henning for his recommendations and opinions in the model construction. To P. Chang for her personal support. We specially thank to reviewers who greatly contributed to improve the manuscript, with emphasis to J. Kaas. We are glad to dedicate this work in honor to Dr. Sydney Anderson, a great friend and colleague, for his outstanding contribution to the Neotropical mammalogy, particularly México and Bolivia. Many of his publications had a great impact on the development of the mammalogy of Perú and other Neotropical countries. VP during his stay at the AMNH personally saw Syd´s effort and dedication to gather and organize the huge amount of data about the mammals from Bolivia, which was openly available. Syd and his wife Justine were very friendly and hosted VP a couple of times at his house, which I learn they used to do with many Latino students.

Literature cited

Acha, P. N., and J. Zapatel. 1957. Estudio en quirópteros de la Región de San Martin (Perú) como probables reservorios de rabia. Boletín de la Oficina Sanitaria Panamá 42:211-222. [ Links ]

Allen, L., A. Turmelle, M. Mendonca, K. Navara, T. Kunz, and G. McCracken. 2009. Roosting ecology and variation in adaptive and innate immune system function in the Brazilian free-tailed bat (Tadarida brasiliensis). Journal of Comparative Physiology 179:315-323. [ Links ]

Alurralde, S. G., and M. M. Díaz. 2018. Diet of Tadarida brasiliensis (Mammalia: Chiroptera) in Northwestern Argentina. Acta Chiropterológica 20:221-228. [ Links ]

Anderson, R. P. 2013. A framework for using niche models to estimate impacts of climate change on species distributions. Annals of the New York Academy of Sciences 1297:8-28. [ Links ]

Anderson, R. P., and A. Raza. 2010. The effect of the extent of the study region on GIS models of species geographic distributions and estimates of niche evolution: preliminary tests with montane rodents (genus Nephelomys) in Venezuela. Journal of Biogeography 37:1378-1393. [ Links ]

Aragón, G., and M. Aguirre. 2014. Distribución de murciélagos (Chiroptera) de la región Tacna, Perú. Idesia (Arica) 32:119-127. [ Links ]

Arias-Aguilar, A., F. Hintze, L. M. S. Aguiar, V. Rufray, E. Bernard, and M. J. R. Pereira. 2018. Who’s calling? Acoustic identification of Brazilian bats. Mammal Research 63:231-253. [ Links ]

Arias, E., V. Pacheco, K. Cervantes, A. Aguilar, and J. Álvarez. 2016. Diversidad y composición de murciélagos en los bosques montanos del Santuario Nacional Pampa Hermosa, Junín, Perú. Revista Peruana de Biología 23:103-116. [ Links ]

Barquez, R., M. Diaz, E. Gonzalez, A. Rodriguez, S. Incháustegui, and J. Arroyo-Cabrales. 2015. Tadarida brasiliensis. In IUCN 2018. The IUCN Red List of Threatened Species. Version 2018.1. https://www.iucnredlist.org . Consulted on 4 June 2018. [ Links ]

Barve, N., V. Barve, A. Jiménez-Valverde, A. Lira-Noriega, S. P. Maher, A. T. Peterson, J. Soberón, and F. Villalobos. 2011. The crucial role of the accessible area in ecological niche modeling and species distribution modeling. Ecological Modelling 222:1810-1819. [ Links ]

Beck, J., M. Böller, A. Erhardt, and W. Schwanghart. 2014. Spatial bias in the GBIF database and its effect on modeling species’ geographic distributions. Ecological Informatics 19:10-15. [ Links ]

Brack-Egg, E. 1986. Las Ecorregiones del Perú. Boletín de Lima 44:57-70. [ Links ]

Brown, J. L. 2014. SDM toolbox: a python‐based GIS toolkit for landscape genetic, biogeographic and species distribution model analyses. Methods in Ecology and Evolution 5:694-700. [ Links ]

Cardoso, D., T. Särkinen, S. Alexander, A. M. Amorim, V. Bittrich, M. Celis , D. C. Daly, P. Fiaschi, V. A. Funk, L. L. Giacomin, R. Goldenberg, G. Heiden, J. Iganci, C. L. Kelloff, S. Knapp, H. Cavalcante de Lima, A. F. P. Machado, R. M. dos Santos, R. Mello-Silva, F. A. Michelangeli, J. Mitchell, P. Moonlight, P. L. Rodrigues de Moraes, S. A. Mori, T. Sacramento, T. D. Pennington, J. R. Pirani, G. T. Prance, L. Paganucci de Queiroz, A. Rapini, R. Riina, C. A. Vargas, N. Roque, G. Shimizu, M. Sobral, J. R. Stehmann, W. D. Stevens, C. M. Taylor, M. Trovó, C. van den Berg, H. van der Werff, P. L. Viana, C. E. Zartman, and R. C. Forzza. 2017. Amazon plant diversity revealed by a taxonomically verified species list. Proceedings of the National Academy of Sciences 114:10695-10700. [ Links ]

Constable, H., R. Guralnick, J. Wieczorek, C. Spencer, A. T. Peterson, and VertNet Steering Committee. 2010. VertNet: a new model for biodiversity data sharing. Plos Biology 8:e1000309. [ Links ]

Duff, A. A., and T. E. Morrell. 2007. Predictive occurrence models for bat species in California. The Journal of wildlife management 71:693-700. [ Links ]

Eger, J. L. 2007. Family Molossidae. Pp: 399-439 in Mammals of South America (Gardner, A. L. ed.). Volume 1. Marsupials, Xenarthrans, Shrews, and Bats. The University of Chicago Press. Chicago, U.S.A. [ Links ]

Elith, J., S. J. Phillips, T. Hastie, M. Dudík, Y. E. Chee, and C. J. Yates. 2011. A statistical explanation of Maxent for ecologists. Diversity and distributions 17:43-57. [ Links ]

Escobar, L. E., C. Juarez, G. Medina-Vogel, and C. M. Gonzalez. 2015. First report on bat mortalities on wind farms in Chile. Gayana 79:11-17. [ Links ]

Escobar, L. E. , A. Lira-Noriega, G. Medina-Vogel, and A. T. Peterson. 2014. Potential for spread of the white-nose fungus (Pseudogymnoascus destructans) in the Americas: use of Maxent and NicheA to assure strict model transference. Geospatial health 9:221-229. [ Links ]

Esri. 2016. ArcMap 10.5.1. Redlands, CA: Environmental Systems Research Institute. [ Links ]

Fenton, M. B. 1990. The foraging behaviour and ecology of animal-eating bats. Canadian Journal of Zoology 68:411-422. [ Links ]

Franklin, J. 2010. Mapping species distributions: spatial inference and prediction. Cambridge University Press. Cambridge, U.K. [ Links ]

García-Rosell, C. 1965. Cavernas, grutas y cuevas del Perú. Geographic Society of Lima, Perú. [ Links ]

Garreaud, R. D. 2009. The Andes climate and weather. Advances in Geosciences 22:3-11. [ Links ]

Gillam, E. H., and G. F. McCracken. 2007. Variability in the echolocation of Tadarida brasiliensis: effects of geography and local acoustic environment. Animal Behaviour 74:277-286. [ Links ]

Global biodiversity information facility (GBIF). 2019. Occurrence Occurrence https://doi.org/10.15468/dl.im0esx . Download on 08 July 2019. [ Links ]

Herreid, C. F. 1967. Temperature regulation, temperature preference and tolerance, and metabolism of young and adult free-tailed bats. Physiological Zoology 40:1-22. [ Links ]

Hijmans, R. J., S. E. Cameron, J. L. Parra, P. G. Jones, and A. Jarvis. 2005. Very high resolution interpolated climate surfaces for global land areas. International Journal of Climatology: A Journal of the Royal Meteorological Society 25:1965-1978. [ Links ]

Hintze, F., A. Arias-Aguilar, L. Dias-Silva, M. Delgado-Jaramillo, C. R. Silva, T. Jucá, F. L. Mischiatti, M. Almeida, B. Bezerra, L. Aguiar, M. J. Ramos, and M. J. Pereira. 2019. Molossid unlimited: extraordinary extension of range and unusual vocalization patterns of the bat, Promops centralis. Journal of Mammalogy 101:417-432. [ Links ]

Hodkinson, I. D. 2005. Terrestrial insects along elevation gradients: species and community responses to altitude. Biological reviews 80:489-513. [ Links ]

Hristov, N. I., M. Betke, D. E. Theriault, A. Bagchi, and T. H. Kunz. 2010. Seasonal variation in colony size of Brazilian free-tailed bats at Carlsbad Cavern based on thermal imaging. Journal of Mammalogy 91:183-192. [ Links ]

Jenkins, H. S. 2009. Amazon climate reconstruction using growth rates and stable isotopes of tree ring cellulose from the Madre De Dios Basin, Perú (Doctoral dissertation). Duke University. [ Links ]

Kalko, E. K. 1997. Diversity in tropical bats. Pp: 13-43 in Tropical biodiversity and systematics (Ulrich, H. ed.). Bonn, Germany, Proceedings of the international symposium on biodiversity and systematic in tropical ecosystems. [ Links ]

Kingston, T. 2016. Bats. Pp. 60-82 in Core standardized methods for rapid biological field assessment (Larsen, T. H. ed.). Conservation International, Arlington. [ Links ]

Koopman, K. F. 1978. Zoogeography of Peruvian bats with special emphasis on the role of the Andes. American Museum Novitates 2651:1-33. [ Links ]

Krauel, J. J., J. M. Ratcliffe, J. K. Westbrook, and G. F. McCracken. 2018. Brazilian free-tailed bats (Tadarida brasiliensis) adjust foraging behaviour in response to migratory moths. Canadian Journal of Zoology 96:513-520. [ Links ]

Kvist, L. P., and G. Nebel. 2000. Bosque de la llanura aluvial del Perú: Ecosistemas, habitantes y uso de los recursos. Folia Amazónica 10:5-55. [ Links ]

Larsen, P. A., M. R. Marchan-Rivadeneir, and R. J. Baker. 2010. Taxonomic status of Andersen’s fruit-eating bat (Artibeus jamaicensis aequatorialis) and revised classification of Artibeus (Chiroptera: Phyllostomidae). Zootaxa 2648:45-60. [ Links ]

Lee, Y. F., and G. F. McCracken. 2002. Foraging activity and food resource use of Brazilian free-tailed bats, Tadarida brasiliensis (Molossidae). Ecoscience 9:306-313. [ Links ]

Lim, B. K. 2009. Review of the origins and biogeography of bats in South America. Chiroptera Neotropical 15:391-410. [ Links ]

McCracken, G. F., E. H. Gillam, J. K. Westbrook, Y. F. Lee, M. L. Jensen and , B. B. Balsley. 2008. Brazilian free-tailed bats (Tadarida brasiliensis: Molossidae, Chiroptera) at high altitude: links to migratory insect populations. Integrative and Comparative Biology 48:107-118. [ Links ]

Mena, J. L. 2010. Respuestas de los murciélagos a la fragmentación del bosque en Pozuzo, Perú. Revista Peruana de Biología 17:277-284. [ Links ]

Mena, J. L., and M. Williams de Castro. 2002. Diversidad y patrones reproductivos de quirópteros en un área urbana de Lima, Perú. Ecología Aplicada 1:1-8. [ Links ]

Morales, A. E., M. De la Mora, and D. Piñero. 2018. Spatial and environmental factors predict skull variation and genetic structure in the cosmopolitan bat Tadarida brasiliensis. Journal of biogeography 45:1529-1540. [ Links ]

Morales, A., F. Villalobos, P. M. Velazco, N. B. Simmons, and D. Piñero. 2016. Environmental niche drives genetic and morphometric structure in a widespread bat. Journal of Biogeography 43:1057-1068. [ Links ]

Morrone, J. J. 2014. Biogeographical regionalisation of the Neotropical region. Zootaxa 3782:1-110. [ Links ]

Muscarella, R., P. J. Galante, M. Soley‐Guardia, R. A. Boria, J. M. Kass, M. Uriarte, and R. P. Anderson. 2014. ENM eval: An R package for conducting spatially independent evaluations and estimating optimal model complexity for Maxent ecological niche models. Methods in ecology and evolution 5:1198-1205. [ Links ]

Nabe-Nielsen, J. 2001. Diversity and distribution of lianas in a neotropical rain forest, Yasuní National Park, Ecuador. Journal of Tropical Ecology 17:1-19. [ Links ]

Nogueira, E. M., B. W. Nelson, and P. M. Fearnside. 2005. Wood density in dense forest in central Amazonia, Brazil. Forest Ecology and Management 208:261-286. [ Links ]

Olson, D. M., E. Dinerstein, E. D. Wikramanayake, N. D. Burgess, G. V. N. Powell, E. C. Underwood, J. A. D’amico, I. Itoua, H. E. Strand, J. C. Morrison, C. J. Loucks, T. F. Allnutt, T. H. Ricketts, Y. Kura, J. F. Lamoreux, W. W. Wettengel, P. Hedao, and K. R. Kassem. 2001. Terrestrial Ecoregions of the World: A New Map of Life on Earth. A new global map of terrestrial ecoregions provides an innovative tool for conserving biodiversity. BioScience 51:933-938. [ Links ]

Pacheco, V. 2002. Mamíferos del Perú. Pp: 503-550 in Diversidad y conservación de los mamíferos neotropicales (Ceballos, G., and J. Simonetti eds.). Conabio-UNAM. México. [ Links ]

Pacheco, V., A. Zevallos, K. Cervantes, J. Pacheco, and J. Salvador. 2015. Mamíferos del Refugio de Vida Silvestre Pantanos de Villa, Lima-Perú. Científica 12:26-41. [ Links ]

Pacheco, V. , and B. D. Patterson. 1992. Systematics and biogeographic analyses of four species of Sturnira (Chiroptera: Phyllostomidae), with emphasis on Peruvian forms. Memorias del Museo de Historia Natural 21:5-81. [ Links ]

Pacheco, V. , R. Cadenillas, E. Salas, C. Tello, and H. Zeballos. 2009. Diversidad y endemismo de los mamíferos del Perú. Revista Peruana de Biología 16:5-32. [ Links ]

Pari, A., K. Pino, C. Medina, E. López, and H. Zeballos. 2015. Murciélagos de Arequipa, historia natural y conservación. Colección Científica, Museo de Historia Natural de la Universidad Nacional de San Agustín (MUSA). Perú. [ Links ]

Patterson, B. D., D. F. Stotz, S. Solari, J. W. Fitzpatrick, and V. Pacheco. 1998. Contrasting patterns of elevational zonation for birds and mammals in the Andes of southeastern Peru. Journal of Biogeography 25:593-607. [ Links ]

Patterson, B. D., S. Solari, and P. M. Velazco. 2012. The Role of the Andes in Diversification and Biogeography of Neotropical Mammals. Pp: 351-378 in Bones, Clones, and Biomes: The history and geography of Recent Neotropical mammals (Patterson, B. D. , and L. P. Costa eds.). University of Chicago Press. Chicago, U.S.A. [ Links ]

Patterson, B. D. , V. Pacheco, and M. V. Ashley. 1992. On the origins of the western slope region of endemism: systematics of fig-eating bats, genus Artibeus. Memorias del Museo de Historia Natural, Universidad Nacional Mayor de San Marcos (Lima) 21:189-205. [ Links ]

Peterson, A. T., and J. Soberón. 2012. Species distribution modeling and ecological niche modeling: getting the concepts right. Natureza and Conservação 10:102-107. [ Links ]

Phillips, S. J., M. Dudík, R. E. Schapire. 2018. Maxent software for modeling species niches and distributions 3.4.1. Program distributed by the author. American Museum of Natural History. [ Links ]

Phillips, S. J., R. P. Anderson, and R. E. Schapire. 2006. Maximum entropy modeling of species geographic distributions. Ecological modelling 190:231-259. [ Links ]

Portugal, G. 2018. Diversidad y distribución del orden Chiroptera en el valle de Sama, Tacna. Universidad Nacional Jorge Basadre Grohmann. [ Links ]

Proches, Ş. 2006. Latitudinal and longitudinal barriers in global biogeography. Biology letters 2:69-72. [ Links ]

Pyron, R. A., and F. T. Burbrink. 2009. Lineage diversification in a widespread species: roles for niche divergence and conservatism in the common kingsnake, Lampropeltis getula. Molecular Ecology 18:3443-3457. [ Links ]

R Core Team. 2019. R: A language and environment for statistical computing. R Foundation for Statistical Computing, Vienna, Austria. URL https://www.R-project.org/. [ Links ]

Radosavljevic, A., and R. P. Anderson. 2014. Making better Maxent models of species distributions: complexity, overfitting and evaluation. Journal of biogeography 41:629-643. [ Links ]

Razgour, O., H. Rebelo, M. Di Febbraro, and D. Russo. 2016. Painting maps with bats: species distribution modelling in bat research and conservation. Hystrix 27:1-8. [ Links ]

Reichard, J. D., S. R. Fellows, A. J. Frank, and T. H. Kunz. 2010. Thermoregulation during flight: body temperature and sensible heat transfer in free-ranging Brazilian free-tailed bats (Tadarida brasiliensis). Physiological and Biochemical Zoology 83:885-897. [ Links ]

Romero, V. 2018. Tadarida brasiliensis. In Mamíferos del Ecuador (Brito, J., M. A. Camacho, V. Romero, and A. F. Vallejo, eds.). Version 2018.0. Museo de Zoología, Pontificia Universidad Católica del Ecuador. https://bioweb.bio/faunaweb/mammaliaweb/FichaEspecie/Tadarida%20brasiliensis Consulted on December 17, 2019. [ Links ]

Rundel, P. W., M. O. Dillon, B. Palma, H. A. Mooney, S. L. Gulmon, and J. R. Ehleringer. 1991. The phytogeography and ecology of the coastal Atacama and Peruvian deserts. Aliso: A Journal of Systematic and Evolutionary Botany 13:1-49. [ Links ]

Russell, A. L., and G. F. McCracken. 2005. Population genetic structuring of very large populations: The Brazilian free-tailed bat Tadarida brasiliensis. Pp: 227-247, in Functional and evolutionary ecology of bats (Akbar, Z., G. F. McCracken, and T. H. Kunz, eds.). Oxford University Press. Oxford, U.K. [ Links ]

Rydell, J., H. T. Arita, M. Santos, and J. Granados. 2002. Acoustic identification of insectivorous bats (order Chiroptera) of Yucatan, Mexico. Journal of Zoology 257:27-36. [ Links ]

Schwarb, M., D. Acuña, T. Konzelmann, M. Rohrer, N. Salzmann, B. Serpa Lopez, and E. Silvestre. 2011. A data portal for regional climatic trend analysis in a Peruvian High Andes region. Advances in Science and Research 6:219-226. [ Links ]

Schwartz, A. 1955. The status of the species of the brasiliensis group of the genus Tadarida. Journal of Mammalogy 36:106-109. [ Links ]

Solari, S., E. Vivar, P. M. Velazco, and J. J. Rodríguez. 2001. Small mammals of the southern Vilcabamba region, Peru. Biological and social assessments of the Cordillera de Vilcabamba, Perú. RAP Working Papers 12:110-116. [ Links ]

Syfert, M. M., M. J. Smith, and D. A. Coomes. 2013. The effects of sampling bias and model complexity on the predictive performance of Maxent species distribution models. Plos One 8:e55158. [ Links ]

Velazco, P. M., and B. D. Patterson. 2014. Two new species of yellow-shouldered bats, genus Sturnira Gray, 1842 (Chiroptera, Phyllostomidae) from Costa Rica, Panama and western Ecuador. ZooKeys 402:43-66. [ Links ]

Velazco, P. M. , and R. Cadenillas. 2011. On the identity of Lophostoma silvicolum occidentalis (Davis and Carter, 1978) (Chiroptera: Phyllostomidae). Zootaxa 2962:1-20. [ Links ]

Vieira, S., P. B. de Camargo, D. Selhorst, R. Da Silva, L. Hutyra, J. Q. Chambers, I. Foster, N. Higuchi, J. Dos Santos, S. C. Wofsy, S. E. Trumbore, and L. A. Martinelli. 2004. Forest structure and carbon dynamics in Amazonian tropical rain forests. Oecologia 140:468-479. [ Links ]

Warren, D. L., and S. N. Seifert. 2011. Ecological niche modeling in Maxent: the importance of model complexity and the performance of model selection criteria. Ecological applications 21:335-342. [ Links ]

Webster, W. D. 1993. Systematics and evolution of bats of the genus Glossophaga (Doctoral dissertation). Texas Tech University. [ Links ]

Weigend, M. 2004. Additional observations on the biogeography of the Amotape-Huancabamba zone in Northern Perú: Defining the South-Eastern limits. Revista peruana de biología 11:127-134. [ Links ]

Wiens, J. J., and M. J. Donoghue. 2004. Historical biogeography, ecology and species richness. Trends in ecology and evolution 19:639-644. [ Links ]

Wilkins, K. 1989. Tadarida brasiliensis. Mammalian Species 331:1-10. [ Links ]

Zeballos, H., V. Pacheco, and L. Baraybar. 2001. Diversidad y conservación de los mamíferos de Arequipa, Perú. Revista peruana de biología 8:94-104. [ Links ]

Zelada Estraver, W., L. Polláck Velásquez, C. Medina Tafur, and H. Castillo Benítez. 2014. Vertebrates of the Cerro Campana Lomal system Trujillo La Libertad- Perú. Arnaldoa 21:221-240. [ Links ]

1Associated editor: Jorge Salazar Bravo

Appendix 1

Selected localities used for the SDM of T. brasiliensis in the Peruvian territory. Occurrence records were taken from the following institutions: Museo de Historia Natural de San Marcos (MUSM); Field Museum of Natural History (FMNH); Royal Ontario Museum (ROM); National Museum of Natural History (NMNH); American Museum of Natural History (AMNH). Records with an asterisk (*) are specimens examined by Morales et al. (2018). Acoustic records were obtained between 2014 to 2019 and remain stored in MUSM.

Departament Locality Terestial ecoregions BIiogeographics Provinces Coordinates Year Type of record
1 San Martín Tocache, Qa San Francisco Ucayali Moist Forest Ucayali province -08° 11’ 21.3” S -76° 30’ 51.4” W 1948 MUSM 6045
2 San Martín Tarapoto Ucayali Moist Forest Ucayali province -06° 28’ 59.9” S -76° 22’ 00.0” W 1954 Acha and Zapatel (1957)
3 San Martín Río Ponasa Ucayali Moist Forest Ucayali province -06° 53’ 06.0” S -76° 19’ 00.9” W 1954 Acha and Zapatel (1957)
4 Amazonas Molinopampa Peruvian Yungas Ucayali province -06° 15’ 34.7” S -77° 33’ 30.9” W 2011 MUSM 37049
5 Cajamarca Cajabamba Peruvian Yungas Puna province -07° 37’ 20.6” S -78° 02’ 49.5” W 2019 Ultrasonic call
6 Huánuco Huacar Peruvian Yungas Yunga province -10° 09’ 24.9” S -76° 17’ 34.6” W 1982 MUSM 5114-5119
7 Junín Junín city Central Andean Wet Puna Puna province -11° 10’ 39.5” S -75° 59’ 21.6” W NA ROM 93863, 93868*
8 Ayacucho La Mar Peruvian Yungas Yunga province -12° 41’ 00.0” S -73° 52’ 59.9” W 1941 GBIF (FMNH 52909)
9 Ayacucho San Cristobal de Huamanga Peruvian Yungas Yunga province -13° 08’ 54.0” S -74° 13’ 18.3” W 2019 Ultrasonic call
10 Cuzco Santa Ana Central Andean Wet Puna Yunga province -13° 30’ 41.2” S -71° 58’ 59.5” W NA NMNH 194443*
11 Cuzco Chumbivilcas Peruvian Yungas Yunga province -14° 12’ 42.4” S -72° 04’ 48.8” W 2009 MUSM 25965
12 Cuzco Machu Picchu Peruvian Yungas Yunga province -13° 09’ 47.0” S -72° 32’ 44.0” W NA NMNH 194440*
13 Cuzco Paucartambo Peruvian Yungas Rondônia province -13° 09’ 43.9” S -71° 37’ 10.9” W 2001 MUSM 19421, 19422
14 Puno Sandia Peruvian Yungas Rondônia province -14° 14’ 41.9” S -69° 25’ 51.9” W 1900 AMNH 16074*
15 Puno Sandia Bolivian Yungas Rondônia province -14° 12’ 34.9” S -69° 08’ 56.0” W 2009 MUSM 26758
16 Puno Carabaya Peruvian Yungas Rondônia province -13° 51’ 00.0” S -69° 41’ 00.0” W 1941 GBIF (FMNH 52968)
17 Puno Carabaya Central Andean Wet Puna Yunga province -15° 50’ 21.6” S -70° 01’ 09.8” W 1941 FMNH 52675*
18 Puno Carabaya Peruvian Yungas Rondônia province -13° 23’ 59.9” S -70° 43’ 00.0” W 1950 Vertnet (FMNH 68548)
19 Puno Interoceánica Peruvian Yungas Rondônia province -13° 36’ 11.8” S -70° 27’ 10.5” W 2018 Ultrasonic call
20 Piura Talara Tumbes-Piura Dry Forest Ecuadorian province -04° 33’ 27.9” S -81° 12’ 39.3” W 2017 Ultrasonic call
21 La Libertad Cañoncillo Sechura Desert Desert province -07° 23’ 24.1” S -79° 25’ 24.8” W 2018 Ultrasonic call
22 La Libertad Loma Cerro Campana Sechura Desert Desert province -07° 58’ 30.0” S -79° 06’ 30.0” W 2013 Zelada et al. (2014)
23 La Libertad Menochuco Sechura Desert Desert province -08° 01’ 25.5” S -78° 50’ 16.4” W 2018 Ultrasonic call
24 Lima Humedales Ventanilla Sechura Desert Desert province -11° 52’ 37.5” S -77° 08’ 41.4” W 2017 Ultrasonic call
25 Lima Lomas de Lachay Sechura Desert Desert province -11° 21’ 27.9” S -77° 23’ 00.5” W 2017 Ultrasonic call
26 Lima Albuferas Medio Mundo Sechura Desert Desert province -10° 53’ 51.6” S -77° 41’ 12.1” W 2014 Ultrasonic call
27 Lima La Molina Sechura Desert Puna province -12° 04’ 50.1” S -76° 56’ 52.0” W 2017 MUSM 47378
28 Lima Churín Sechura Desert Desert province -10° 48’ 53.3” S -76° 52’ 35.8” W 2019 Ultrasonic call
29 Lima Azpitia Sechura Desert Desert province -12° 35’ 11.7” S -76° 37’ 57.4” W 2017 Ultrasonic call
30 Lima San Mateo Central Andean Wet Puna Desert province -11° 47’ 11.3” S -76° 19’ 39.0” W 2019 Ultrasonic call
31 Ica Humedales de Caucato Sechura Desert Desert province -13° 40’ 32.9” S -76° 12’ 16.7” W 2019 Ultrasonic call
32 Ica Villacuri Sechura Desert Desert province -13° 55’ 48.5” S -75° 56’ 44.4” W 2019 Ultrasonic call
33 Ica Plaza Palpa Sechura Desert Desert province -14° 32’ 01.1” S -75° 11’ 06.5” W 2019 Ultrasonic call
34 Ica Plaza Nazca Sechura Desert Desert province -14° 49’ 39.7” S -74° 56’ 13.4” W 2019 Ultrasonic call
35 Arequipa Atiquipa Sechura Desert Desert province -15° 48’ 30.0” S -74° 21’ 46.0” W NA Zeballos et al. (2001)
36 Arequipa Caravelí Sechura Desert Desert province -15° 47’ 50.3” S -73° 25’ 42.8” W NA Pari et al. (2015)
37 Arequipa Cueva Camaná Sechura Desert Desert province -16° 37’ 25.0” S -72° 42’ 33.0” W NA Pari et al. (2015)
38 Arequipa Valle de Tambo Sechura Desert Desert province -17° 06’ 09.9” S -71° 46’ 55.8” W NA Zeballos et al. (2001)
39 Arequipa Arequipa city Sechura Desert Desert province -16° 23’ 55.9” S -71° 32’ 13.1” W NA Pari et al. (2015)
40 Tacna Humedales de Ite Sechura Desert Desert province -17° 53’ 13.8” S -70° 58’ 43.7” W 2014 Ultrasonic call
41 Tacna Valle de Sama Sechura Desert Desert province -17° 51’ 54.0” S -70° 33’ 43.0” W 2015 Portugal (2018)

Appendix 2

Model evaluation details. The selection of the model was made using: delta AICc, average AUCdiff, omission rate at 10th percentile presence threshold, and average AUCtest. Evaluations were made with the “checkerboard2” spatial partition schema. The feature class combinations were: L: linear, P: product, Q: quadratic, H: hinge and T: threshold. The evaluation process was performed using ENMeval package version 0.3.0 (Muscarella et al. 2014).

Appendix 3

Response curves. Response curves obtained by the selected model for each selected variable are reported.

Received: April 15, 2020; Revised: May 15, 2020; Accepted: September 21, 2020

*Corresponding author: orzegarra@gmail.com

Creative Commons License This is an open-access article distributed under the terms of the Creative Commons Attribution License