nueva página del texto (beta)
 Inglés (pdf)
 Artículo en XML
 Referencias del artículo
 Enviar artículo por email
 Citado por SciELO
  Similares en
SciELO
Similares en
SciELO 
 Permalink
Introduction
It is estimated that between 70 and 90 % of tropical rain forest tree species produce fleshy, nutritious fruits which can be exploited by vertebrates (Jordano 2000). Importance of this resource for animals is evidenced by the fact that when marked drops in fruit availability occur, as those associated with climate fluctuations such as El Niño, mortality among the fauna can drastically increase due to famine (Wright et al. 1999). A large proportion of fruits are consumed in situ (in the tree canopy) or taken by animals to be consumed elsewhere (Bonaccorso et al. 1980; Jayasekara et al. 2007; Sampaio et al. 2019). As a consequence of this or by mere gravity, a significant amount of fruits falls and accumulate at the base of trees. These fruits attract a wide variety of mammals who are constantly seeking for food in the forest floor (Camargo-Sanabria et al. 2015). The study of the activity patterns of this fauna can help to further understand fundamental ecological issues such as the mechanisms of vertebrate coexistence (MacArthur and Levins 1967; Sridhara et al. 2016). Thus, information on how ecologically similar or sympatric species coexist is of great importance in understanding community diversity (HilleRisLambers et al. 2012). The most commonly used dimensions to explore patterns of animal activity are those corresponding to food types, spatial and temporal activity (Stewart et al. 2003).
Most of our current knowledge of frugivory interactions concentrates on primates, bats and birds foraging in the canopy (Sridhara et al. 2016). In comparison, much less is known about the patterns of activity of medium and large body-sized mammals consuming fruits on the floor of tropical forest (but see Miura 1997; Camargo-Sanabria and Mendoza 2016; Sampaio et al. 2019). Yet, mammals in this group can have a significant impact on seedling recruitment and diversity (Camargo-Sanabria et al. 2015) and are amongst the most threatened by human activity (Ripple et al. 2015).
At least partially, this lack of information relates to the difficulty of recording the activity of secretive species such as those included in the mammalian frugivore guild. Fortunately, camera trapping has emerged as a very effective tool to tackle this type of issues (Cruz et al. 2014; Edwards et al. 2015). The characteristics of camera-traps greatly increase the chances of recording interactions between fruits and secretive terrestrial mammals (Camargo-Sanabria and Mendoza 2016).
In this study, we analyze spatial and temporal activity patterns of terrestrial frugivorous mammals consuming the fruits of two tropical trees: Licania platypus and Pouteria sapota. Fruits of these tree species are highly attractive to terrestrial mammals (Camargo-Sanabria and Mendoza 2016). Yet, these tree species have dissimilar abundances (common vs. rare) and fruit composition (protein-rich vs. sugar-rich), thus providing the opportunity to analyze mammal frugivory activity in two contrasting settings. We calculated two descriptors of mammal activity. First, we characterized patterns of daily activity of mammals consuming fruits deposited at the base of focal trees. Second, we combined information about the day and the focal tree in which mammal species were active to assess their level of co-occurrence. We used these data to estimate the degree of overlap in daily and spatial activity among mammals consuming fruits of focal trees. We expected to find larger overlap in mammal activity in the case of the less abundant and sugar-rich tree species (P. sapota) than in the more abundant and protein-rich (L. platypus). Moreover, we expected to find greater activity overlap among primarily frugivorous mammalian species (e. g., Baird’s tapir, collared peccary, agouti and spotted paca) than among those with more generalist feeding habits (e. g., white-nosed coati).
Materials and methods
Study area. The Montes Azules Biosphere Reserve (MABR) protects the largest and most diverse remnant of tropical rainforest in southern México. The MABR has an extent of 3,312 km2 and is located between 19° 05’ to 20° 07’ N and -90° 45’ to -91° 30’ W (Appendix 1). Average temperature ranges between 24 °C and 26 °C and average annual precipitation is 2,200 mm (Guacamayas Weather Station). Fieldwork for this study was conducted in the southern portion of the MABR, which is part of the Chajul Field Station (CFS). The MABR supports a rich mammalian fauna including large body-sized species such as: puma (Puma concolor), jaguar (Panthera onca), Baird´s tapir (Tapirella bairdii), white tailed-deer (Odocoileus virginianus), Central American brocket deer (Mazama temama), collared peccary (Dicotyles crassus), and white-lipped peccary (Tayassu pecari). Moreover, it includes some medium-sized species such as: nine-banded armadillo (Dasypus novemcinctus), agouti (Dasyprocta punctata), spotted paca (Cuniculus paca), tayra (Eira barbara), striped hog-nosed skunk (Conepatus semistriatus) and white-nosed coati (Nasua narica; Medellin 1994).
Focal tree species. Licania platypus (sonzapote; Hemsl.) Fritsch (Chrysobalanaceae) is a canopy tree (10 to 30 m tall) distributed from México to Colombia (Pennington and Sarukhán 2005). Its fruits are drupes (14 cm in length and 12 cm in width) containing a sweet fleshy yellow mesocarp surrounded by a fibrous and stony endocarp that encloses a single seed averaging 10 cm in length and 6 cm in width (Pennington and Sarukhán 2005). In the MABR, fruits fall from May to August (Camargo-Sanabria and Mendoza 2016). Dried L. platypus (hereafter Licania) fruit pulp has the following macronutrient composition: 25.8 % protein, 0.75% lipids, 56.5 % non-structural carbohydrates, 3.3 % minerals, 13.4 % fiber and moisture content equal to 65 % (Camargo-Sanabria and Mendoza 2016).
Pouteria sapota (mamey; Jacq.) H. E. Moore and Stearn (Sapotaceae) is a tree up to 40 m tall, occurring from México to northern South America (Pennington and Sarukhán 2005). Fruits are 20 cm long and 8 cm wide and present a very fleshy and red mesocarp covering one brown seed up to 10 cm long (Pennington and Sarukhán 2005). In the MABR fruits ripen from December to March and fall from April to August or September (Camargo-Sanabria and Mendoza 2016). Composition of macronutrients in dried P. sapota (hereafter Pouteria) fruit pulp is as follows: 8.8 % protein, 0.11 % lipids, 89.6 % non-structural carbohydrates, 0.8 % minerals, 0.6 % fiber and moisture percentage is 61 % (Camargo-Sanabria and Mendoza 2016).
Both, Pouteria and Licania occur primarily on alluvial terraces of our study area (Martínez-Ramos 2006). Surveys of trees with a diameter at breast height (DBH) > 10 cm show that density of Licania is much higher than Pouteria´s (14.7 individuals/ha versus < 1 individual/ha; Martínez-Ramos 2006).
In a previous paper we report the most common terrestrial mammalian fauna consuming fruits of Licania and Pouteria trees in our study area (Camargo-Sanabria and Mendoza 2016). The mammals with the highest capture frequencies (number of events / sampling effort * 100 camera-days) were: Baird’s tapir, collared peccary, agouti, spotted paca and white-nosed coati (Table 1). For this study we focus on these species. The Baird’s tapir, collared peccary, agouti and paca are species whose diet relies heavily on fruits, although they also consume other plant parts such as leaves, seeds and even bark (Beck-King et al. 1999; Naranjo and Cruz 1998; Dubost and Henry 2006; Pérez-Cortez and Reyna-Hurtado 2008). Fruits are also an important element in the diet of coatis, but this mammal also includes in its diet a wide variety of items ranging from invertebrates to small vertebrates (Valenzuela 1998). All these mammal species spend most of their time in the forest floor, but the coati has a great ability to climb to reach the forest canopy (Emmons and Feer 1997). There is a ten-fold variation in the body weight of this fauna being the extremes the Baird’s tapir (ca. 293.8 kg) and agouti (ca. 2.3 kg; Jones et al. 2009).
Table 1 Capture frequency (number of events / sampling effort * 100 camera-days) of five focal mammals species recorded, by camera-traps, eating fallen fruits at focal trees species at the Montes Azules Biosphere Reserve, Chiapas. Modified from Camargo-Sanabria and Mendoza (2016).
| Species | Licania platypus | Pouteria sapota |
| Cuniculus paca (Paca) | 13.5 | 23.9 |
| Dasyprocta punctata (Agouti) | 16.7 | 35 |
| Nasua narica (White-nosed coati) | 22.4 | 9.2 |
| Dycotiles crassus (Collared peccary) | 8.4 | 22.9 |
| Tapirella bairdii (Baird´s tapir) | 16.5 | 25.5 |
Recording of mammal visitation to focal fruiting trees. We conducted a several days search of fruiting Licania and Pouteria trees in alluvial terraces in the vicinity of the CFS. We located a total of 10 trees (six of Licania and four of Pouteria) with abundant fruits accumulated at their bases. We found other Licania and Pouteria trees but they had immature or no fruits or were too close to focal trees. Each tree was georeferenced with a handheld GPS unit (Garmin, 62sc, UTM coordinate system, region 15). We did not directly measure fruit production but there were no clear contrasts in fruit abundance among trees. Mean distance between focal trees, measured using ArcMap 10 (ESRI 2011) were 1,472 m and 4,325 m for Licania and Pouteria, respectively. DBH of focal trees were 102.7 cm ± 28 (mean ± SD) in Licania and 78.5 cm ± 23 in Pouteria. Tree crown dimensions averaged 21 x 18 m and 20 x 17 m for Licania and Pouteria, respectively.
We conducted a camera-trapping survey during the fruiting season of May to July 2014. We set up one camera-trap (Ltl Acorn 5210A) to monitor each focal tree. These camera-traps were attached to the trunk of trees in the vicinity of focal trees at a height between 0.6 and 1.5 m, aimed at fallen fruits. Distances from the cameras to the fruits ranged between 4 and 6 m. Each camera was protected against the rain using a small plastic sheet. Cameras were programmed to be active throughout the day and night and to take three pictures each time they were activated. Time between activations was set to its minimum (1 s) and motion sensors were set to normal sensitivity. Monitoring of focal trees ranged from 10 to 30 days and stopped once fruits on the floor were absent.
Data analyses. Mammal pictures were uploaded (with their metadata: date, time, etc.) and tagged with the corresponding species scientific name in a database built using the free software CameraBase v1.5.1 (Tobler 2010).
Description of frugivore daily activity patterns and calculation of activity overlap. We used the R package Overlap (Meredith and Ridout 2014) to construct kernel density plots, based on information of time of recording of each mammal picture. These density plots constituted the basis for describing species daily activity patterns and conducting paired measurements of their overlap. Prior to analysis in Overlap, we converted the timestamp of photos from hours and minutes to radians. We calculated nonparametric estimators of the overlapping coefficients based on the size of the smaller of the two samples; we used delta1 when the smaller sample was less than 50 photos and delta4 when it was greater than 75 (Meredith and Ridout 2014). This coefficient takes values from 0 to 1, where 1 indicates total overlap. To estimate their confidence intervals, we generated 1000 smoothed bootstrap samples for each comparison and selected the option “basic0” in the bootCI output.
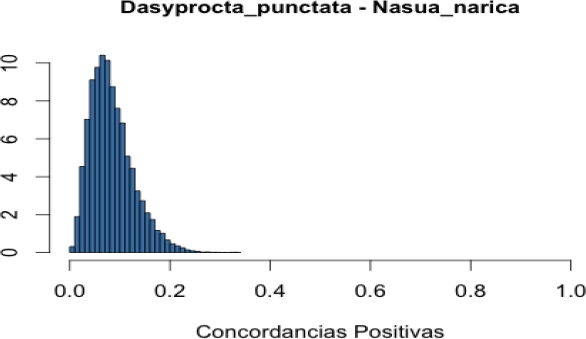
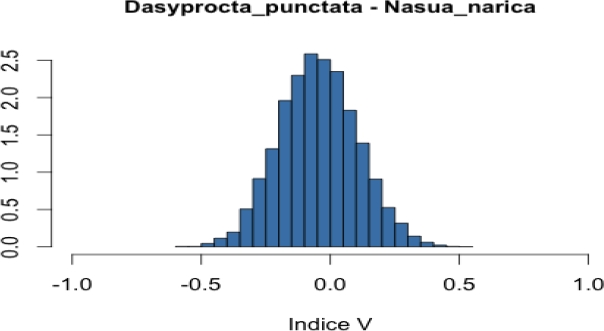
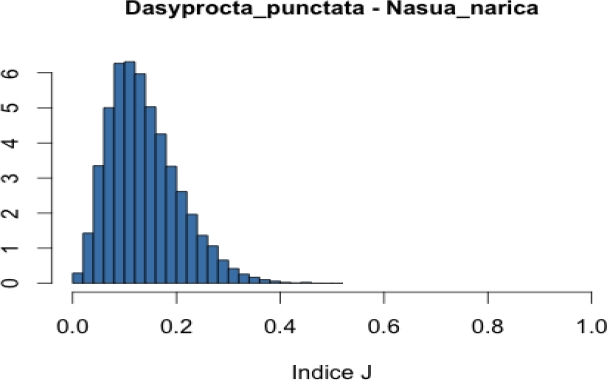
Co-occurrence of frugivore in focal trees. To assess the level of co-occurrence of frugivorous species in both tree species, we combined two data sources: i) records of presence of each mammalian species in each focal tree and ii) dates in which each mammal species was recorded in each of these focal trees. Based on these data we created a binary presence-absence matrix to indicate occurrence of mammal species on a particular date and tree (one matrix per tree species). We used these matrices to calculate Jaccard, Ochiai and V ratio indices (Jackson et al. 1989; Zhang 2013). Calculation of these indices for a pair of species (A and B) is based on the frequencies of the following cases: a) both species are present, b) both species are absent, c) species A is present but species B is missing, and d) species A is missing but species B is present (see Appendix 2). These frequencies (fa, fb, fc and fd) define a 2 x 2 contingency table and when divided by the total number of cases (N) are the usual estimates of the true probabilities of the four cases. Each index makes use of the frequencies in such a way that it can be interpreted as an estimate of a function of these four probabilities. Thus, the Jaccard index, defined as fa / (fa + fc + fd), can be interpreted as an estimate of the probability of case (a) given that at least one of the species is present. Similarly, the V ratio index is an estimate of the difference of the probability of cases (a) + (b) minus the probability of cases (c) + (d). Finally, if q1 is the probability of case (a) given that species A is present, and q2 is the probability of case (a) given that species B is present, the Ochiai index estimates the geometric mean of q1 and q2. The Ochiai and Jaccard indices have their lowest value (0) when both species are absent and their maximum (1) when both species are present (Janson and Vegelius 1981; Ludwig and Reynolds 1988). In comparison, the V ratio index takes a positive value if the number of concordant pairs (both species present or both species absent) is larger than the number of discordant pairs (one species present and the other absent). Otherwise, it takes a negative value.
We applied a Bayesian approach in which we used the observed frequencies, in combination with a non-informative prior distribution, to obtain a posterior distribution for the probabilities of the four cases in the contingency table. On this basis, we obtained a posterior distribution for each of the functions estimated by the indices (see Appendix 2). These posterior distributions are informative about the function each index is estimating. For example, in the case of the Jaccard index (JI), in addition to the estimate JI = fa / (fa + fc + fd), the corresponding posterior distribution allows us to describe what we know with respect to JI* = Pa / (Pa + Pc +Pd) where Pj is the true probability being estimated by fj / N. From the posteriors, we computed a 0.95 posterior probability interval for each function (see Appendix 2).
Our statistical analysis of activity patterns between pairs of mammal species was based on the comparison of estimated overlap coefficients and association indices and their corresponding confidence intervals.
Results
Throughout 194 camera-trap days (130 and 64 for Licania and Pouteria, respectively) we recorded a total of 1591 pictures of our five focal mammal species (Figure 1, Table 1). In one Licania focal tree we did not record any mammal species; therefore, we excluded this tree from the analyses.
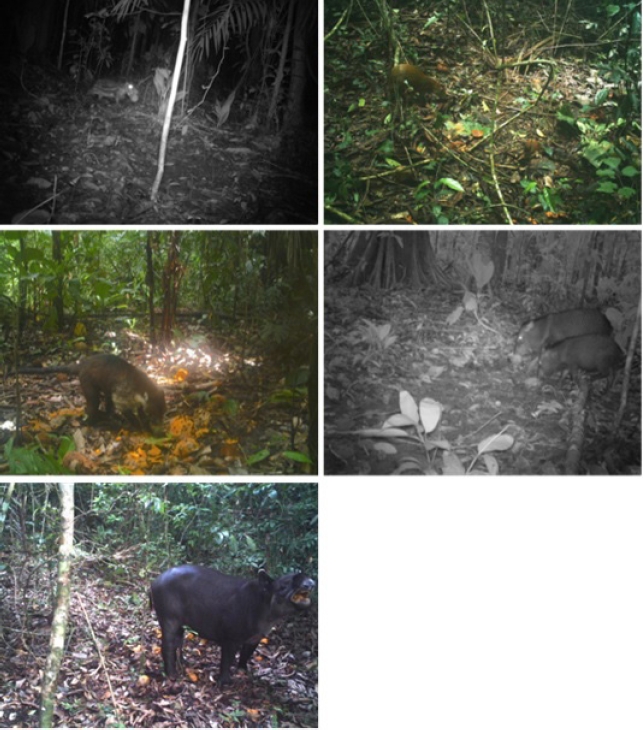
Figure 1 Ensemble of mammalian frugivores recorded eating fruits of Licania platypus and Pouteria sapota in the tropical rainforest of the Montes Azules Biosphere Reserve. From left to right: spotted paca, agouti (first row); white-nosed coati, collared peccary (second row); Baird’s tapir (third row).
Patterns of daily activity and overlap among frugivorous mammals. There was a clear variation in daily activity among frugivorous mammals and between tree species. Most mammal species were more active during the day and close to dawn or dusk, with the only exception of the paca whose activity was completely nocturnal (Figures 2 and 3). Most frugivores showed between one or two main peaks of activity with the exception of the coati which had three peaks of activity, in Pouteria focal trees, although one of them was comparatively minor (Figure 3). Activity patterns of tapir and paca were very similar between tree species both in the number and timing of their main peaks (Figures 2 and 3). In comparison, activity patterns of the agouti, collared peccary and coati were more contrasting between tree species (Figures 2 and 3).
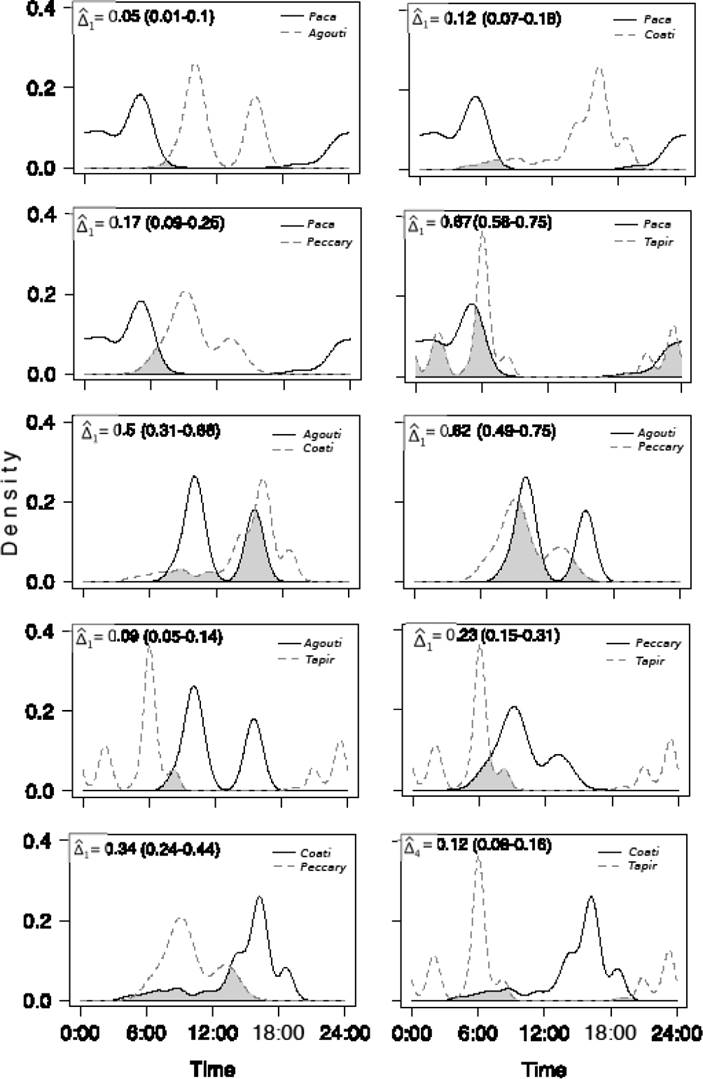
Figure 2 Overlap in the patterns of daily activity of mammalian species interacting with Licania platypus fruits.
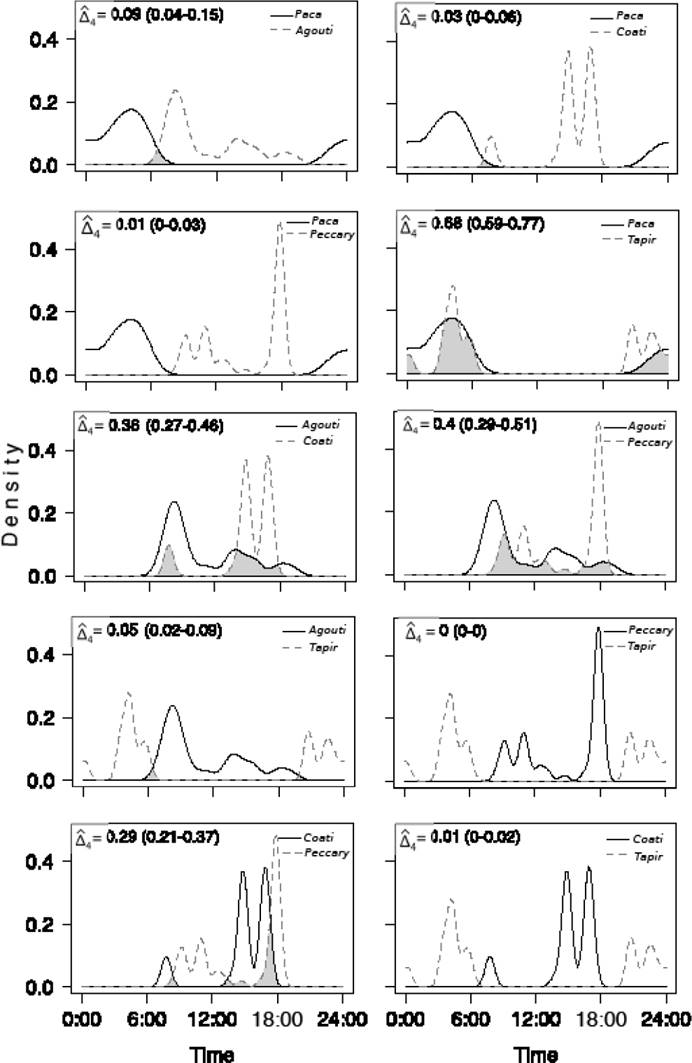
Figure 3 Overlap in the patterns of daily activity of mammalian species interacting with Pouteria sapota fruits.
As a consequence of the observed contrasts in mammal daily activity patterns there was a wide variation in their degree of overlap. Overlap in Licania trees ranged between 0.05 and 0.67 (Figure 2). Lowest levels of overlap occurred in the pairs paca-agouti (delta1 = 0.05) and agouti-tapir (delta1 = 0.09). In contrast, the greatest overlap occurred in the pairs paca-tapir (delta1 = 0.67) and agouti-peccary (delta1 = 0.62). The remaining species pairs had intermediate levels of overlap (Figure 2).
There was also wide variation in activity overlap among mammalian species consuming fruits of Pouteria (range = 0-0.68; figure 3). In fact, there were two cases in which there was essentially no overlap (peccary vs. tapir and coati vs. tapir; Figure 3). In contrast, greatest overlap occurred between the pairs paca-tapir (delta4 = 0.68) and agouti-peccary (delta4 = 0.4; Figure 3). Overall, overlap was greater in Licania than in Pouteria (average coefficients: 0.29 vs. 0.19, respectively).
Patterns of frugivorous co-occurrence in focal trees. The paca was recorded at the five focal Licania trees, whereas, the collared peccary, coati and tapir were recorded at four and the agouti was recorded at only one. In comparison, the tapir and agouti were recorded at the four focal Pouteria trees, the coati and paca at three of them and the collared peccary at only two. The paca showed the greatest variation in the proportion of days it was recorded at focal Licania trees (0.03 to 0.33), whereas the collared peccary showed the lowest variation (0.07 to 0.12). At Pouteria the agouti showed the greatest variation in the proportion of days it visited focal trees (0.08 to 0.58), while the coati showed the lowest variation (0.06 to 0.12).
In general, we found low co-occurrence between pairs of mammalian frugivores in both tree species. In Licania, the paca-tapir pair had the greatest estimated probability of positive concordances (i. e., presence of both species; 0.10). In comparison, in Pouteria, the agouti-paca pair had the greatest estimated probability of positive concordances (0.12). Values of the Jaccard index for species using Licania fruits were on average lower than those of mammals associated with Pouteria (0.06 vs. 0.12; Table 2). Likewise, values of the Ochiai index were on average lower for Licania than for Pouteria (0.11 vs. 0.21; Appendix 3). Largest values of both the Jaccard and Ochiai indices for Licania corresponded to the paca-tapir pair (Table 2 and Appendix 3). In comparison, largest values of the both indices in Pouteria corresponded to the collared peccary-paca pair (Table 2 and Appendix 3).
Table 2 Median values of Jaccard species association index and corresponding 95% probability intervals, within parentheses, for species recorded in Licania platypus (above diagonal) and Pouteria sapota (below diagonal).
| Paca | Agouti | Coati | Peccary | Tapir | |
| Paca | ---- | 0.02 (0, 0.11) |
0.08 (0.01, 0.19) |
0.06 (0, 0.19) |
0.15 (0.05, 0.30) |
| Agouti | 0.18 (0.07, 0.33) |
---- | 0.07 (0, 0.21) |
0.04 (0, 0.19) |
0.02 (0, 0.11) |
| Coati | 0.03 (0, 0.13) |
0.14 (0.04, 0.29) |
---- | 0.06 (0, 0.18) |
0.08 (0.01, 0.19) |
| Peccary | 0.20 (0.06, 0.41) |
0.13 (0.03, 0.27) |
0.04 (0, 0.18) |
---- | 0.06 (0, 0.19) |
| Tapir | 0.15 (0.04, 0.32) |
0.10 (0.03, 0.23) |
0.08 (0.01, 0.24) |
0.13 (0.02, 0.31) |
---- |
On the other hand, the largest values of the V ratio index in Licania corresponded to the pair agouti-peccary (positive association), coati-paca (negative association) and coati-tapir (negative association; Appendix 4). In Pouteria the highest values of the V ratio index corresponded to agouti-tapir (negative association), coati-peccary (positive association) and paca-peccary (positive association; Appendix 4).
When we plotted both co-occurrence data and overlap in daily activity we found that most of the pairs of mammals were located in the lower left-hand quadrant of the graph with relatively minor exceptions such as those corresponding to the paca-tapir and agouti-peccary pairs (Figure 4).
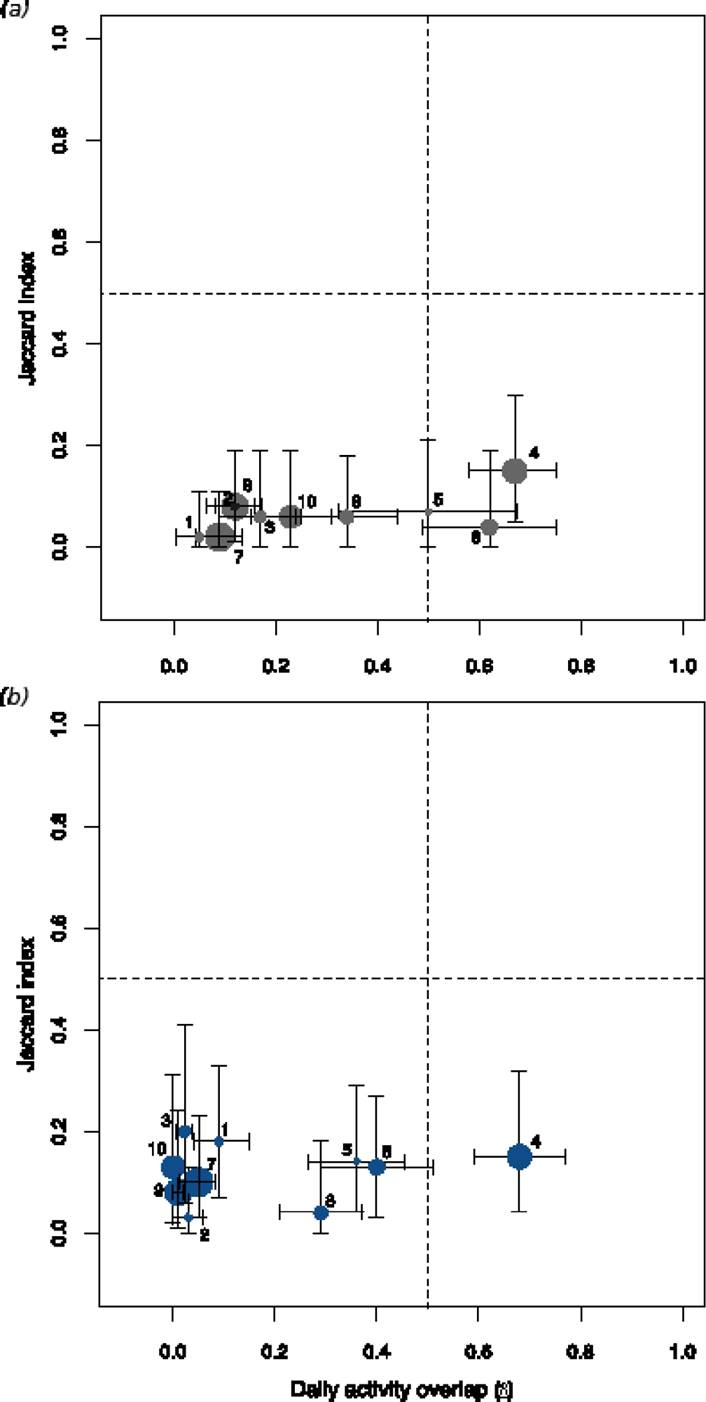
Figure 4 Diagram combining spatial (Jaccard) and daily activity patterns. a) Licania platypus and b) Pouteria sapota. Key: 1 = paca-agouti, 2 = paca-coati, 3 = paca-peccary, 4 = paca-tapir, 5 = agouti-coati, 6 = agouti-peccary, 7 = agouti-tapir, 8 = coati-peccary, 9 = coati-tapir, 10 = peccary-tapir. Horizontal and vertical lines indicate 95 % confidence intervals and different circle sizes indicate contrasts in body size between pair of species.
Discussion and conclusions
We found just partial support for our predictions. Regarding our first expectation of finding a greater level of mammal activity overlap in the case of the less abundant and sugar-rich tree species (P. sapota) than in the more abundant and protein-rich tree species (L. platypus). We found that overlap in mammal activity in both tree species was overall low yet, in average, mammal species visited more often the same trees in the same days in the case of P. sapota than in the case of L. platypus. However, when comparing daily activity, the result was the other way around, with greater average overlap occurring in the case of L. platypus than in the case of P sapota. In relation with our second prediction, in which we were expecting to find greater activity overlap in species pairs including primarily frugivorous mammalian species than in those including the species with more generalist feeding habits (i. e., white-nosed coati), we found that the pair of species having the greatest overlap (delta1 ≥ 0.67) in their daily activity patterns, in both tree species, was indeed constituted by the highly frugivore mammals paca and tapir (Naranjo 2009; Martínez-Ceceñas et al. 2018). Moreover, we found that coatis (the species with the more generalist feeding habits) had in most of the cases a low degree of overlap in their daily activity with the other mammal species feeding on the fruits of the focal tree species but, in 3 out 8 paired comparison this overlap was relatively high (delta1 ≥ 0.29).
There are several factors, not mutually exclusive, whose examination might help to gain a better understanding of the underlying causes behind the observed low levels of activity overlap among the focal frugivorous mammals. A first possibility is that these patterns are reflecting the effect of earlier strong competitive interactions established among mammalian frugivorous species (“the ghost of past competition”) occurring in our study area (Connell 1980). This possibility would include the effect of species currently present but also of those formerly occurring in our study area but currently extinct (Ceballos et al. 2010). A potential counterargument of this possibility is that mammalian frugivores usually are able to use a variety of food sources; for example, tapirs in addition to consuming a variety of fruits consume plant leaves, stems, and even tree bark (Naranjo 2009). Thus, one of the main requirements for competition to emerge (i. e, exploiting of a shared highly demanded resource which occur in a limited supply) might not apply due to the possibility that mammals rely on different feeding sources. Yet, on the other hand, it is important to take into consideration that fruits and seeds can have an energetic and nutritive content (e.g., carbohydrates, proteins and lipids) hard to find in other plant material (e. g., leaves; Smythe 1986). Moreover, despite the fact that in the forest there are a wide variety of fruit species that can be exploited by mammals, plant phenology causes that at a given time, only a few of them are available (Van Schaik et al. 1993). It would be interesting to compare mammal activity in forests with different degrees of defaunation to assess if in the absence of some frugivorous mammalian species, others increase their range of activity; certainly this issue warrants further research.
A second possibility to explain low activity overlap is that focal animal species occur at low densities within the local mammal community. However, previous studies conducted in the Montes Azules Biosphere Reserve give little support to this possibility. For example, Azuara (2005) found, in a camera-trap survey of the local mammalian community, that Cuniculus paca and Tapirella bairdii were two of the most recorded species (no. of records/100 camera-trap days) closely followed by peccaries. Likewise, Towns (2013) found that tapirs and pacas were the first and third most recorded species in a camera-trap study conducted in our same study area. Finally, a more recent camera-trap study conducted in parallel, but independently, to our frugivory study, indicates that pacas, tapirs, peccaries, and in less degree agouties and coatis, are common members of the local mammalian community (A. Dueñas Navarro, com. pers.).
A third possible explanation of the observed patterns of mammal activity is related to our methodological approach. Our results contrast with some previous studies which have suggested the existence of high levels of niche overlap in tropical terrestrial frugivorous mammals. For example, Desbiez et al. (2009) measured food and habitat selection in sympatric white-lipped and collared peccaries in the Brazilian Pantanal, finding high levels of overlap in both cases (Pianka’s index values were > 0.664 and > 0.864, respectively). Assessment of dietary and habitat use overlap in that study was based on the detection of the focal species along transects and fecal sample analysis. Likewise, Steinmetz et al. (2013) analyzed foraging signs and scats as a way to explore if food selection helped to explain extensive geographic coexistence of ecologically similar Asiatic black bear (Ursus thibetanus) and sun bears (Helarctos malayanus). They found diet overlap was similarly high during periods of diminished and high fruit availability. In contrast to these studies we analyzed activity overlap at a finer scale, by focusing on mammal visitation to the same trees in the same days (co-occurrence). Previous studies have pinpointed the need to take into consideration species microhabitat use differences, to explain coexistence of species that seemingly overlap in diet and activity (Noor et al. 2017).
In addition to the above mentioned factors, there are other aspects that likely have some influence over the mammal activity patterns we documented. For example, it is known that the adequate performance of animals in a specific environment (e. g., night habit) requires acquiring particular capabilities (such as night vision) which involve physiological and anatomical adaptations. Thus, there might be evolutionary constraints that can limit the possibility for some animal species to greatly alter their daily activity patterns in response to interspecific interactions (Bennie et al. 2014). For example, pacas and agouties share some characteristics such as being large frugivorous rodent species but, on the other hand, they contrast in terms of their daily activity patterns with agouties having most of its activity during the day and paca being active mostly during the night. Clearly, these contrasting activity patterns greatly reduce the likelihood of the species to affect the other behavior. Finally, in some instances presence of frugivore mammals with gregarious and potentially aggressive behavior (such as peccaries) could negatively affect the presence of other frugivores (Smythe 1986).
The combination of an approach like the one we applied in this study, together with the use of other technological tools such as dietary isotope and molecular analyses (Phillips 2012; Pompanon et al. 2012) and fine-scale radio tracking of frugivorous (Kays et al. 2011), appears as a promissory path to fill the gap regarding our knowledge of terrestrial mammal frugivorous ecology. A better knowledge of frugivorous species’ niche differentiation can help managers to understand the capacity of species to coexist under different conservation scenarios (HilleRisLambers et al. 2012). Moreover, a clearer understanding of the way mammalian frugivorous interact, among themselves and with plants, will help to appreciate in its full extent the consequences of mammal defaunation (Dirzo et al. 2014; Camargo-Sanabria et al. 2015).