


 nueva página del texto (beta)
 Inglés (pdf)
 Artículo en XML
 Referencias del artículo
 Enviar artículo por email
 Citado por SciELO
  Similares en
SciELO
Similares en
SciELO 
 Permalink
Introduction
Emerging infectious diseases represent a major threat derived from accelerating climate change. We need to take proactive measures with respect to coping with the emerging disease crisis. One impediment in that task is a lack of proper documentation of the underlying biological factors influencing geographic distributions of pathogens and their hosts and vectors (Brooks et al. 2014; Sehgal et al. 2011; Escobar and Craft 2016). This is because the geographic distributions of pathogens, actual and potential hosts or vectors, and of active foci of disease associated with a given pathogen are often complex. Ecological niche modeling is a powerful tool for summarizing data about species biotic and abiotic requirements and their expression on geographical distributions, mapping known sites of occurrence and anticipating potential sites or areas of successful invasion. Accumulating and then monitoring these data provides information about changes in current distributions and interactions of parasites with their hosts that may aid in projecting suitable future pathogen distributions and potential disease outbreaks (Pickles et al. 2013; Ostfeld and Brunner 2015; Nylin et al. 2018). In a complementary manner, combining information about actual and projected environmental changes may allow us to prioritize monitoring activities to maximize the possibility of anticipating the arrival of pathogens, especially agents of endemic, emergent, and re-emergent zoonotic diseases, in novel areas. Knowing the transmission dynamics and potential hosts and vectors of any given pathogen in an anticipated site of invasion allows us to mitigate that pathogen’s impact on wildlife communities and possible cascading zoonotic impacts on humans and domestic animals (Brooks and Boeger 2019; Brooks et al. 2014; Estrada-Peña et al. 2014). The cestode Echinococcus multilocularis Leuckart 1863, the etiological agent of alveolar echinococcosis in humans, is an excellent model system for applying these principles.
Echinococcus multilocularis is a small tapeworm with an adult form that occurs naturally in the small intestines of wild canids and less frequently in other carnivores throughout the northern regions of the Holarctic (Leiby and Kritsky 1972). The normal life-cycle includes a metastatic-proliferative larval stage in the visceral organs of muroid rodents (Rausch and Richards 1971). Alveolar echinococcosis occurs when humans accidentally ingest the tapeworm eggs through direct contact with the feces of infected dogs or wild canids or through environmental contamination (Rausch and Schiller 1954; Lass et al. 2015), and the larval cyst proliferates in the liver, lungs, or other tissues. In humans, this cyst slowly develops, eventually causing a disease that clinically show tumor- like symptoms with infiltrative growth and the potential for metastasis (Kern et al. 2017). Alveolar echinococcosis has been noted as an important neglected zoonotic disease (Da Silva 2010; Budke et al. 2017) and when the human infection data are combined and summarized with the cases of cystic echinococcosis, produced by infection with E. granulosus, around 18,000 new human cases of echinococcosis per year appear globally (Torgerson et al. 2010). If left untreated, 90 % of alveolar echinococcosis cases are fatal with echinococcosis, in general, having an impact of 666,433 human disability-adjusted years per annum worldwide (Romig et al. 2006; Torgerson et al. 2010).
As noted, E. multilocularis has a Holarctic distribution (Davidson et al. 2016) and recent studies have shown that the extent of the geographic distribution of this parasite in Asia and Europe is increasing, and is increasing in prevalence while infecting both normal sylvatic hosts as well as humans (Schweiger et al. 2007; Takumi et al. 2008; Staubach et al. 2011; Torgerson 2013).
Echinococcus multilocularis was first detected in the Nearctic region in the 1950’s in people living on St. Lawrence Island, Alaska and in the 1960’s from foxes and other mammals in the northern great-plains (Rausch and Schiller 1954; Leiby and Olsen 1964). Since then, the species has been reported from 14 of the United States and four provinces in Canada, with records from new areas being reported constantly (Massolo et al. 2014). Nonetheless, this trend of expanding geographic distribution is difficult to interpret given the lack of systematic sampling and poor representation of sampled specimens in georeferenced collections in recognized museums. This lack of data results in uncertainty as to whether the geographic range of E. multilocularis is expanding, or detection of the parasite by parasitologists is improving because of more intense sampling efforts. However, despite the paucity of verified museum-based georeferenced records of this species, it appears that E. multilocularis does have a more extensive distribution than initially thought and new records are recorded herein. Lack of extensive and systematic specimen-based and georeferenced museum collections of E. multilocularis in the Nearctic can partly be offset using correlative ecological niche models (ENM’s) which provide information covering factors influencing its distribution in ecological (environmental) space and the resulting geographical distribution of suitable areas for the species (Estrada-Peña et al. 2014). The aim of this paper is to provide a robust estimate of both the current and predicted future distributions of this extreme human pathogen in the Nearctic.
ENM’s provide robust tools that can improve the understanding of the potential and actual distribution of species in question, as well as the way in which environmental factors may influence a species under study over space and time (Phillips et al. 2006; Searcy and Shaffer 2016). ENM’s use occurrence records and Geographic Information Systems (GIS) layers of environmental information, to infer multifarious relationships between occurrence and the environment (i. e., the environmental niche) and then project this relation over the study area. These models have been widely used in evolutionary, ecological, public health and conservation applications (Chetan et al. 2014; Ostfeld and Brunner 2015; Almasieh et al. 2016; Haverkost et al. 2010). Recent studies have shown the potential of this tool to model the distribution of suitable conditions for pathogenic parasites, their vectors and potential reservoirs (Samy et al. 2014; Raghavan et al. 2016). Furthermore, these models can be used to predict the effect of drivers of global environmental change such as climatic or landcover alterations on the distribution of parasites or pathogens (Stensgaard et al. 2013). Despite their potential and widespread availability, ENM’s have many caveats that researchers using these tools should take into account to produce robust inferences (Kramer-Schadt et al. 2013; Radosavljevic and Anderson 2014).
Traditionally, ENM’s have employed abiotic variables as predictors of distribution of species with the assumption that biotic interactions influence species distributions at much finer spatial scales than the coarse-level geographic distributions evaluated and predicted with ENMs (Soberon 2007). Nonetheless, other authors have proposed and successfully used ways to include biotic interactions in niche and distribution models (Giannini et al. 2013; Anderson 2017). Given the dependence of parasites on their hosts, biotic information is expected to be particularly relevant for modeling the niche and resulting distribution of this group. The successful inclusion of biotic data might help clarify the realized niche of the species, providing more precision in the projected distribution over environmental and geographical space. For this reason, some authors have included information on host distributions for parasite ENM (Pickles et al. 2013; Stensgaard et al. 2013; Kuhn et al. 2016). As E. multilocularis depends entirely on direct trophic interactions among carnivores and rodents and can infect a range of species, we assume that host community-level variables might influence the distribution of this parasite. By including these kinds of variables in our models we will increase the multivariate nature of the ENM and this will result in a model that includes both abiotic and biotic dimensions, probably providing a more accurate representation of the species realized niche.
Our goal in this study is to contribute to the understanding of the environmental space occupied by E. multilocularis in the Nearctic and project the derived geographical distribution of suitable conditions for the species, especially in the central part of the continent. Here we review and georeference all records of the species in North America available to us to accomplish the following objectives: i) create a robust ENM with a best estimate of the current spatial distribution of suitable conditions. ii) Evaluate the abiotic and biotic factors influencing the species niche space and their relative importance. iii) Assess the potential impact of climatic change on the distribution of suitable conditions for E. multilocularis in the future (2070). As part of our first objective, we include two unpublished records of the parasite for the USA.
Materials and Methods
Parasite data. To create a database on the E. multilocularis sampling and detection localities, we conducted a systematic search in the Web of Science using the search terms “Echinococcus multilocularis” and “North America”, “Canada” and “USA” or other variations of the country names. We complemented these sources with other references cited in the recovered papers. We further filtered out the publications that did not include new records (i. e., reviews) and the ones without enough information to positively georeference the sampling locality with a precision of less than 20 km. This threshold was selected as a compromise between precision and quantity of occurrence records. From each article, we collected the sampling localities (including those where the species was not detected), geo-coordinates, georeferencing precision, host species, infection status, number of sampled individuals, number of infected individuals, parasite prevalence and year of collection. We also included in our database, the records from the parasite collection in the Harold W. Manter Laboratory of Parasitology (HWML), data from the former US National Parasite Collection, the Museum of Southwestern Biology collection and sampling localities from the notes and records of R. L. Rausch’s work on E. multilocularis in Alaska. Because most literature sources documenting E. multilocularis did not include study-site or collection locality geo-coordinates, we used gazetteers and Google Earth to georeference the sampling sites and estimated the assigned coordinate precision following the protocol of Chapman and Wieczorek (2006). When the paper presented a map (i. e.,Rausch and Richards 1971), the map was georeferenced using the best matching coordinate system, and the coordinates were extracted using point size and georeferencing mismatch as precision.
New records. To increase the robustness of the current work, we included two previously unpublished records that were provided by HWML collaborators. The first record came from Maryland and represents a specimen of larval E. multilocularis that was collected by Gregory E. Glass who is now in the Department of Geography and the Emerging Pathogens Institute at the University of Florida. This specimen was determined to be definitely E. multilocularis and was identified to the level of the species by one of the experts in the field at the time, Everett L. Schiller (unfortunately the specimens were lost when Schiller died). The second specimen was collected by John E. Ubelaker, identified by John E. Ubelaker and Scott L. Gardner and deposited in the HWML Parasite Collection. To identify this specimen, protoscolexes recovered from the abdominal cavity of a single individual of Peromyscus maniculatus were prepared following the methods of Gardner et al. (2013). Both large and small hooks of the parasite recovered from stained protoscolexes were digitally imaged and measured. The species was identified based on hook morphology (shape and structure of the hooks: compare Figure 1, A to C). We also include a multivariate discriminant analysis of morphometric data to explore the affinities of the collected parasites to other populations of E. multilocularis. To do this, measurements of both large and small hooks were taken from specimens of E. multilocularis extracted from the alveolar cysts recovered from the liver of Microtus oeconomus collected in 1958 from St. Lawrence Island (HWML14934) and from Microtus limnophilus collected from near Har Us Lake in western Mongolia (HWML68052; Gardner et al. 2013). Canonical discriminant function analysis was performed using SAS 9.4 following the general methods of Gardner and Schmidt (1988) and Gardner et al. (2013).
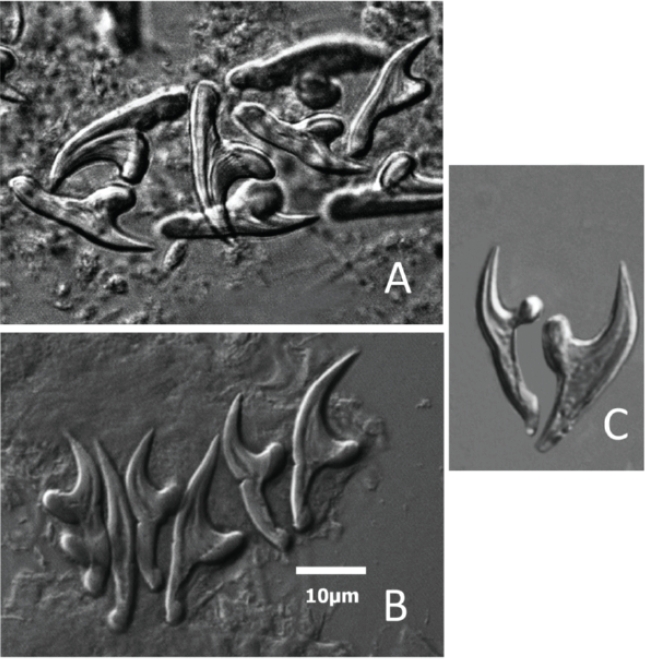
Figure 1 Images of rostellar hooks taken from alveolar cysts removed from the liver of rodents from three separate collection localities in Mongolia and North America. A) Large and small hooks from protoscolexes taken from Peromysus maniculatus collected near Taos, New Mexico, USA in 2009. B) Hooks taken from Microtus limnophilus collected near Har Us Lake, Khovd, Mongolia, 2012. C) Hooks from Microtus oeconomus from St. Lawrence Island Alaska, USA in 1950. All images and measurements made with a Zeiss Axiophot microscope and Zeiss Axiovision Software (SE64 v. 4.8). All hooks given at same ten micrometer scale as shown in Figure 1B.
Environmental and biotic variables. We used two sets of predictor variables to model the niche of the parasite and project habitat suitability over North America. The first set (abiotic variables) includes average daily solar radiation and 15 bioclimatic variables which summarize several aspects of temperature and precipitation intra annual tendencies and variability acquired from the WorldClim V.2. dataset (Fick et al. 2017; bios 8, 9, 18 and 19 were excluded as they might show artefacts resulting from their dependence on both precipitation and temperature - Campbell et al. 2015). The second set consists of four variables related to host species assemblage, including definitive and intermediate host species richness and the proportion of carnivore assemblage represented by potential definitive host-species as well as the proportion of rodent assemblage represented by the potential intermediate hosts. The hosts were selected based on the species with more than two records of E. multilocularis infection in our database (definitive hosts: Canis latrans, Canis lupus, Vulpes vulpes, and V. lagopus; intermediate hosts: Lemmus trimucronatus, Microtus oeconomus, M. pennsylvanicus, Mus musculus, Myodes gapperi, Ondatra zibethicus, and Peromyscus maniculatus). Rasters displaying these variables were created by counting the number of species from each group whose range overlap at each pixel using the IUCN distribution maps (IUCN 2016).
To reduce both the number of variables and complexity of the model, we performed a Pearson product moment correlation test among all pairs of variables extracted using 10,000 random points from the study area (Warren et al. 2014). To attempt to decrease the effect of correlated variables on the analysis, one variable from each pair with correlation coefficients higher than 0.8 was removed. Variables that have been shown to be more biologically important or meaningful were retained in the analysis. This approach resulted in six climate-related, and four host-related variables (Table 3). These variables were masked using the presumed accessible area for the parasite. The selection of the modeling area is a key part of the EN modeling process as it should represent the sites accessible to the species of interest over relevant time periods (Barve et al. 2011). In this study, given the high dispersal potential of definitive hosts of E. multilocularis (Trewhella et al. 1988; Harrison 1992). We defined this area as all regions encompassing the geographic range of at least one definitive and intermediate host, resulting in an inclusive area of North America from above the arctic circle to the northern portion of Mexico. All variables were resampled to a 2.5´ resolution.
Table 1 Character loadings and variation in canonical structure for 3 populations of E. multilocularis from Peromyscus maniculatus from Taos, New Mexico, USA; Microtus oeconomus from St. Lawrence Island, Alaska, USA; and Microtus limnophilus from Har Us Lake, Mongolia. Numbers in bold represent loading coefficients with greatest discriminatory power in the canonical analysis. For example, the character “Guard width” for the large hooks is most important with a loading on CAN I of 0.91.
| Total Canonical Structure | |||
|---|---|---|---|
| Variable | CAN I | CAN II | |
| Large Hooks | Total length | 0.438 | 0.802 |
| Handle length | 0.196 | 0.693 | |
| Guard width | 0.914 | 0.049 | |
| Blade length | 0.382 | 0.402 | |
| Total length | 0.036 | 0.619 | |
| Small Hooks | Handel length | -0.262 | 0.486 |
| Guard width | 0.762 | 0.270 | |
| Blade length | 0.341 | 0.355 | |
| Percentage of variation of each canonical axis | 70.52 % | 29.48 % | |
| Canonical Correlation | 87.36 % | 75.76 % | |
Table 2 Summary of performance metrics for models including both biotic and abiotic variables versus a model including only abiotic variables. Mean omission test rate is under a 10 % training omission threshold.
| Model | AICc | pROC AUC Ratio** | Mean Omission Test Rate |
|---|---|---|---|
| Abiotic Only | 4,808 | 1.81 | 10.46 % |
| Abiotic + Host variables | 4,689 | 1.94 | 12.05 % |
** indicates significant differences among the two models.
Table 3 Importance metrics for each of the variables included in the biotic+abiotic model. Jackknife values are reported in performance decrease percentage assessed using test data. The three most important variables according to each metric appear in bold.
| Variable | Permutation importance | Jackknife without variable (test gain) | Jackknife with only variable (test gain) |
|---|---|---|---|
| Average daily solar radiation (kJ m-2 day-1) | 7.2 | 1.70 | 1.310 |
| Precipitation of Wettest Month | 0.6 | 1.73 | 0.430 |
| Precipitation of Driest Month | 0.2 | 1.74 | 0.256 |
| Max Temperature of Warmest Month | 9.4 | 1.67 | 0.876 |
| Temperature Annual Range | 1.0 | 1.70 | 0.360 |
| Precipitation Seasonality | 3.7 | 1.72 | 0.153 |
| Proportion definitive host in carnivore community | 22.0 | 1.57 | 0.797 |
| Definitive host species richness | 34.3 | 1.61 | 0.678 |
| Intermediate host species richness | 17.4 | 1.69 | 0.298 |
| Proportion intermediate host in rodent community | 4.3 | 1.69 | 0.467 |
Distribution modeling. We used the Maximum Entropy algorithm as implemented in the software Maxent (Version 3.4.1; Phillips et al. 2017) to model the niche of E. multilocularis, assess the effect of abiotic and biotic variables over its distribution and project habitat suitability over current and future environmental conditions. We selected Maxent as it has been shown repeatedly to perform well when only presence data is available (Elith et al. 2006; Phillips and Dudík 2008). Maxent compares environmental values at species presence sites against a background sample of the environment and estimates the species distributions by finding the distribution of maximum entropy subject to the constraint that the expected value for each environmental variable under this estimated distribution matches its empirical average (Elith et al. 2011).
Despite the good performance of Maxent, several aspects should be taken in to account for maximizing model reliance and robustness. Probably, the most important is the fact that presence records usually do not come from a random sampling of the study area and sometimes might be spatially clumped which might result in biased models, which in the worst cases are predicting the sampling conditions rather than suitability for the species that is being studied (Fourcade et al. 2014). To tackle this issue and given the fact that the data were not evenly distributed through geographic space, we took the following two steps: i) We created a sampling bias raster from which Maxent would extract the background points in the proportion of sample intensity. For this, we pulled all the georeferenced records for E. multilocularis sampling (positive and negatives) as well as georeferenced records of other parasite species collected from potential hosts and available in the parasite collections accessible through the Arctos biodiversity data repository. With these records, we created a kernel density raster using a sigma = 0.8 representing parasite sampling intensity. ii) We further proceed to randomly remove one record from the pairs that were closer than 30 km (distance based on the data precision and visual inspection of occurrence clusters) to reduce the clustering of the data points. We did this using the R package SPTHIN (Aiello-Lammens et al. 2015) to maximize the number of usable points of occurrence. Another issue with Maxent models is the probability of overfitting due to exceedingly complex models. To alleviate this issue, we used the R package ENMeval (Muscarella et al. 2014) to assess the performance of several combinations of regularization parameters (RP; 1, 2, 3, 5, and 6) and feature classes (linear, quadratic, product and hinge - threshold was not included to avoid overly complex models; Phillips et al. 2017), both factors related to the complexity included in model fitting. From these, we selected the best combination based on the partial ROC significance (see below), difference between training and test omission threshold (a measure of overfitting) and best AICc.
To assess the effect of including biotic variables on model performance, we created two separate niche models, one using the dataset of all variables described above and another model employing only the abiotic variables. For each dataset, we created 50 bootstrapped models using a randomly chosen 20 % of the records for its assessment in each replicate. The models were fitted using the regularization parameter and features selected in the abovementioned step. We compared both models employing three criteria: AICc; partial ROC AUC ratio and the average tests data omission rate of the 50 replicates using the 10 % training omission threshold. The AICc was estimated for each model using the ENMeval package. The partial ROC AUC ratio is proposed as a superior way of comparing models and calculates the ratio among the null expectation and observed area under the Receiving Operator Curve starting from a defined omission threshold, which in this case given the time span of the records was set to 5 % (Peterson et al. 2008). The significance of the ratios was assessed with 500 bootstrapped replicates using 50 % of the records employing the NicheToolBox (http://shiny.conabio.gob.mx:3838/nichetoolb2/). The mean tests data omission rate is considered a measure of model overfitting. The differences in pAUC and omission test between the two models were evaluated using a t-test.
We used two methods to assess the importance of each variable in determining environmental suitability for E. multilocularis. First, we used the average percent premutation importance of each variable from each replicate. This metric assesses the decrease or increase in model performance when each variable is permuted. Second, we used the Jackknife test in which the model is run without each variable and with only each variable, and the differences in performance are calculated as the percentage decrease in AUC. This jackknife analysis indicates the variables that contain the most influential and the most unique information respectively. To describe the relationship between the important variables and the parasite distribution, we employ response curves that show how suitability change when the variable of interest is varied while keeping all other environmental variables at their average sample value. All of these analyses were carried on the MaxEnt software (Phillips et al. 2017).
Maxent main output is a continuous raster of the estimated suitability. For predicting the potential distribution of a species, it is desirable to find a threshold of suitability above which the species is predicted to persist given the species can disperse, which would produce binary maps. Nonetheless, there are several ways of defining the threshold, and overall predictions are highly dependent on them (Norris 2014). In this paper, we report predicted distribution using two thresholds over the median suitability of the 50 model replicas, the first is the one resulting in a 5 % omission rate of all records, a threshold that has been commonly used for models at this spatial/temporal scale and coming from diverse sources (Raes et al. 2009; Campbell et al. 2015; Sage et al. 2017), and which can be interpreted as including the most suitable habitat. The second predicted distribution is more inclusive and represents the threshold that equates entropy of distributions at the threshold and original areas. This threshold has been proposed for organisms with high dispersal potential as they can reach distant areas in a relatively short time period (Filz and Schmitt 2015: Hill et al. 2016). We interpret the resulting model as describing the subset of the realized niche represented in the study area (Peterson and Soberón 2012). In turn, this model relates the environmental and biotic variables to suitability for the species occurrence. When this suitability value is projected over geographic space and reclassified, we get an estimation of the suitable area.
Finally, given the small difference in performance and prediction ability (see results), we used the abiotic variables model to project the distribution of suitable conditions for E. multilocularis in the year 2070. For this, we used the climatic projections from the 17 general circulation models (GCM) available at the WorldClim database under the contrasting 4.5 and 8.5 emission scenarios (RCPs) from the 5th IPCC. The first scenario corresponds with a peak in emissions around 2040 and further emissions decline with stabilization around 2100; the second, more pessimistic scenario presents emissions rising throughout the 21st century (http://www.ipcc.ch/). We estimated suitability for each GCM RCP combination and predicted gain and loss of suitable habitat for the median suitability using thresholds that maintain the predicted suitable area found by the best model. As a way of assessing uncertainty arising from different GCM, we report the amount of consensus over suitable habitat gain and loss for each scenario.
Results
New records of Echinococcus multilocularis in the Nearctic. We include here a new record of a specimen of E. multilocularis found in the liver of an individual of M. ochrogaster collected by Gregory E. Glass in a grassy area in Mount Pleasant Park, Baltimore, Maryland in August, 1985. The parasite cyst in the liver was identified as E. multilocularis by Everett L. Schiller (see Methods, above). This represents the first record of E. multilocularis for Maryland and the most eastern record for the species in North America.
Our second unpublished record included herein was from a georeferenced, museum specimen of E. multilocularis recently deposited in the Manter Laboratory Parasite Collection (Catalog no. HWML68737). The host, an individual of P. maniculatus, was collected by John E. Ubelaker 10 km SW of Taos, New Mexico on 28 June, 2009 in willows along Pot Creek. The parasite was identified by J. E. Ubelaker and Scott L. Gardner.
To help confirm the identification of the sample from New Mexico, we examined the extent of morphological variation among three populations of E. multilocularis. For this, we measured seven characters of the larval/rostellar hooks including (large hooks) total-length, handle- length, guard-width, and blade-length and the same characters for the small hooks. We ran the analysis using both the CANDISC and STEPDISC commands in SAS 9.4. The analysis showed that the characters in order of importance for discrimination among the three populations of E. multilocularis were: large hook guard width, large hook total length, small hook guard width, large hook handle length, and small hook total length (see Table 1). All eight characters served to assist in discrimination among the three populations of these cestodes but those mentioned above were more important. Finally, in this analysis, the canonical ordination in Figure 2 shows that CANI separates the Alaskan form of E. multilocularis from the other two populations (Taos, New Mexico and Har Us Lake) fairly well while CANII shows a fairly good separation of E. multilocularis from the specimens collected from near Taos and Har Us Lake, Mongolia (Figures 1, 2; Table 1).
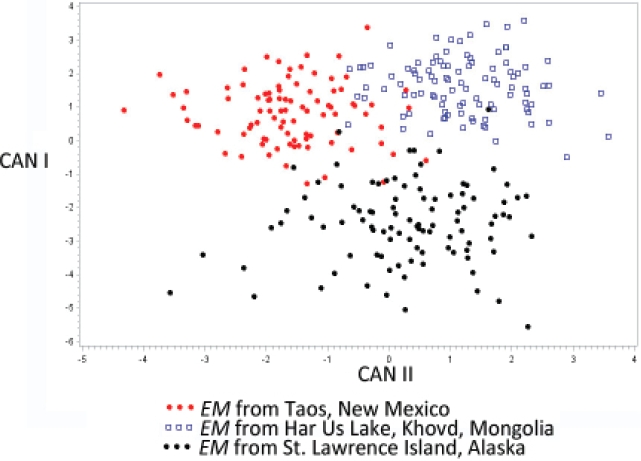
Figure 2 Plot of discriminant scores derived from measurements of rostellar hooks taken from specimens of Echinococcus multilocularis collected from three different collecting localities. The solid red dots represent the specimens of E. multilocularis collected from Peromyscus maniculatus near Taos New Mexico, USA. The Blue boxes represent specimens of E. multilocularis collected from Microtus limnophilus near Har Us Lake, Khovd, Mongolia, and the solid black dots represent specimens measured of E. multilocularis collected from Microtus oeconomus from St. Lawrence Island, Alaska, USA.
Performance and comparisons of the Models. For the final models, 178 presence records of E. multilocularis, collected through the last 60 years were used (Figure 3). An RP = 5 and all assessed features were selected for the biotic model, while a RP = 2 and the linear, quadratic and product features were used for the only abiotic variables model. The models performed very well, with average pROC AUC above 0.9. The model including the biotic data showed the lower AICc and the higher ROC AUC ratio (p-value = 2.2-16), while there was no statistically significant difference in omission rate between the two models (Table 2). This suggests that the model including host community information is significantly more robust than the one including only abiotic variables. As the omission did not show differences between the models, the gain in performance of the biotic models appears to come from more restricted predictions, thus reducing overprediction error.
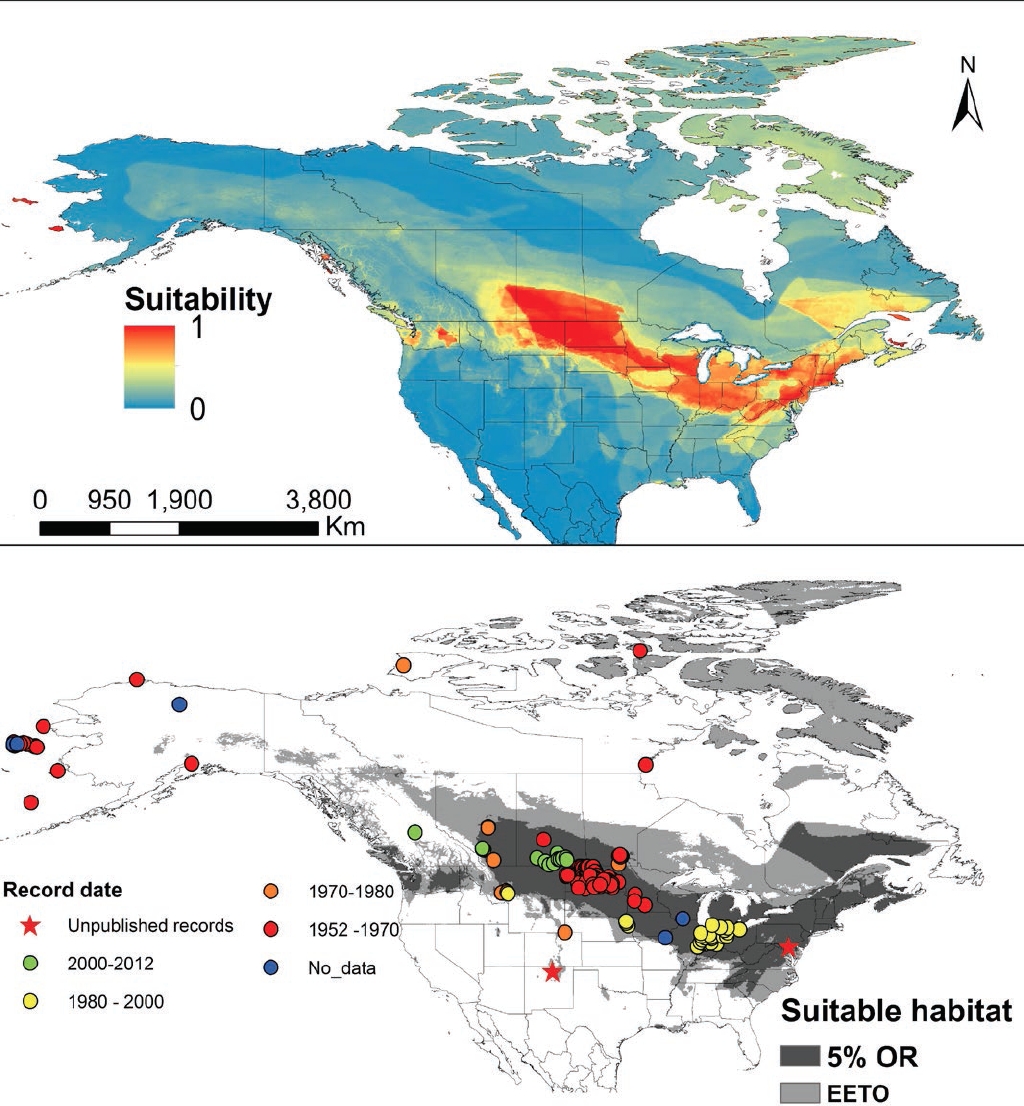
Figure 3 Results of the Maxent distribution model of Echinococcus multilocularis. A) Median continuous environmental suitability index on a log scale resulting from the 50 replicas; warmer colors indicating higher suitability. B) Binary prediction of suitable environmental conditions using two different reclassification thresholds. The dark gray distribution represents the threshold that keeps 95 % of the records, while the light gray area represents the suitable area using a threshold that equates entropy of threshold and original distributions. Occurrence location data used in the model are displayed by date of collection.
Distribution model. For the current distribution, we present the results from the abiotic+biotic model. Applying the more stringent threshold of a 5 % omission, we find that approximately 12 % of North American land mass appears as highly suitable for E. multilocularis. This results in a predicted suitable area of 2.6 million km2 distributed mainly in a band from the east coast of North America to the east of the Rocky Mountains (Figure 3). The predicted suitable area encompasses the great lakes, the central great-plains from Minnesota to Alberta, the Appalachian range and a large portion of Quebec in Canada. Besides this continuous area, some smaller suitable sites are predicted through the continent, including St. Lawrence and St. George islands in Alaska as well as large areas of the state of Washington and isolated patches in British Columbia (Figure 3).
With the lower threshold, 36 % (7.4 million km2) of the study area is predicted as suitable for the parasite. This includes a large portion of NA, including the east coast from South Carolina to Newfoundland and Labrador and towards the west including Alberta, and a large area of the great plains as well as eastern and boreal forest and isolated areas of the Rocky Mountains south to New Mexico (Figure 3). Also, with this threshold, a strip of patches of suitable habitat is predicted to the northwest of Alberta up to Alaska. Some other disjunct areas in the north also appear suitable, with the largest being Baffin and Southampton islands in the Arctic. Under this threshold, the model also predicts two smaller isolated, suitable areas in Louisiana and the border between Texas and Oklahoma.
Variable importance. According to the permutation importance test, definitive host species richness is the most significant variable (34 % importance), followed by proportion of potential hosts in carnivore community (22 %) and intermediate host species richness (17 %). The jackknife test, using model gain on test data shows that the most influential variables are average daily solar radiation, maximum temperature of the warmest month, and proportion of potential hosts in carnivore community. This analysis also indicates that the variables containing unique information include again definitive host species richness, followed by proportion definitive host in carnivore community and maximum temperature of the warmest month (Table 2). When individual response curves are analyzed leaving the other variables at their average, definitive host species richness and proportion of potential intermediate hosts in rodent assemblages show a negative relationship with suitability, while intermediate host richness, proportion of potential hosts in carnivore communities, and maximum temperature of the warmest month show a positive relationship. This contrasts to solar radiation that shows an intermediate peak in suitability. In line with the permutation importance and jackknife results, the other variables don’t show very strong effects on suitability (Figure 4).
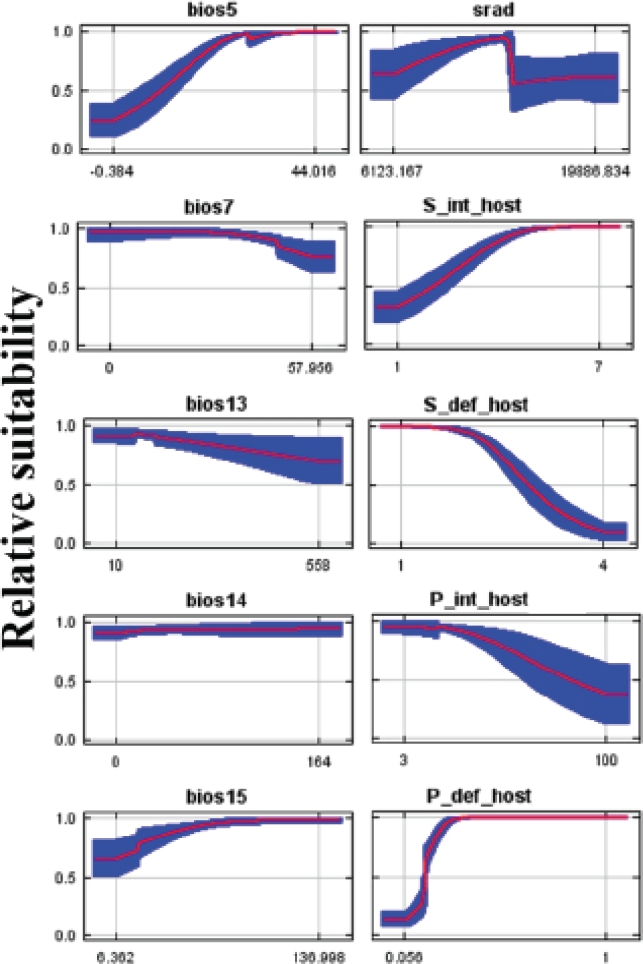
Figure 4 Response curves of Echinococcus multilocularis suitability relative to most influential variables used in this study. Curves show how predicted suitability changes as each variable is changed, keeping all other environmental variables at their average sample value. BIO5 = Max Temperature of Warmest Month; BIO7 = Temperature Annual Range; BIO13 = Precipitation of Wettest Month; BIO14 = Precipitation of Driest Month; BIO15 = Precipitation Seasonality (Coefficient of Variation); SRAD= average daily solar radiation; S_int_host = Intermediate host species richness; S_def_host = Definitive host species richness; P_int_host = Proportion of rodent species that are potential intermediate hosts; P_def_host = Proportion of carnivore species that are potential definitive hosts.
Projected distribution. Projected change in median suitability values for all GCMs up to the year 2070 under 4.5 and 8.5 scenarios show a large expected increase in suitable habitat area. Using the lower threshold, the areas of predicted distribution are shown to increase by 56 % and 76 % under 4.5 and 8.5 scenarios respectively (Figure 5). Using this threshold, the distribution shift pattern is very similar for both scenarios with suitable area predicted to increase mainly north of the current suitable area in North America. Some areas are predicted to become unsuitable for the species in northwestern Canada and Alaska (accounting for less than 5 % of the original area in both scenarios). The uncertainty analysis shows that projections under different climate circulation models agree to a large extent in that suitable conditions for the parasite presence will appear up to Hudson Bay, Labrador as well as west of the Rocky Mountains and in Alaska (Figure 5). The models show less consensus about the expected change in suitability for the taiga ecosystem in the north of the continent.
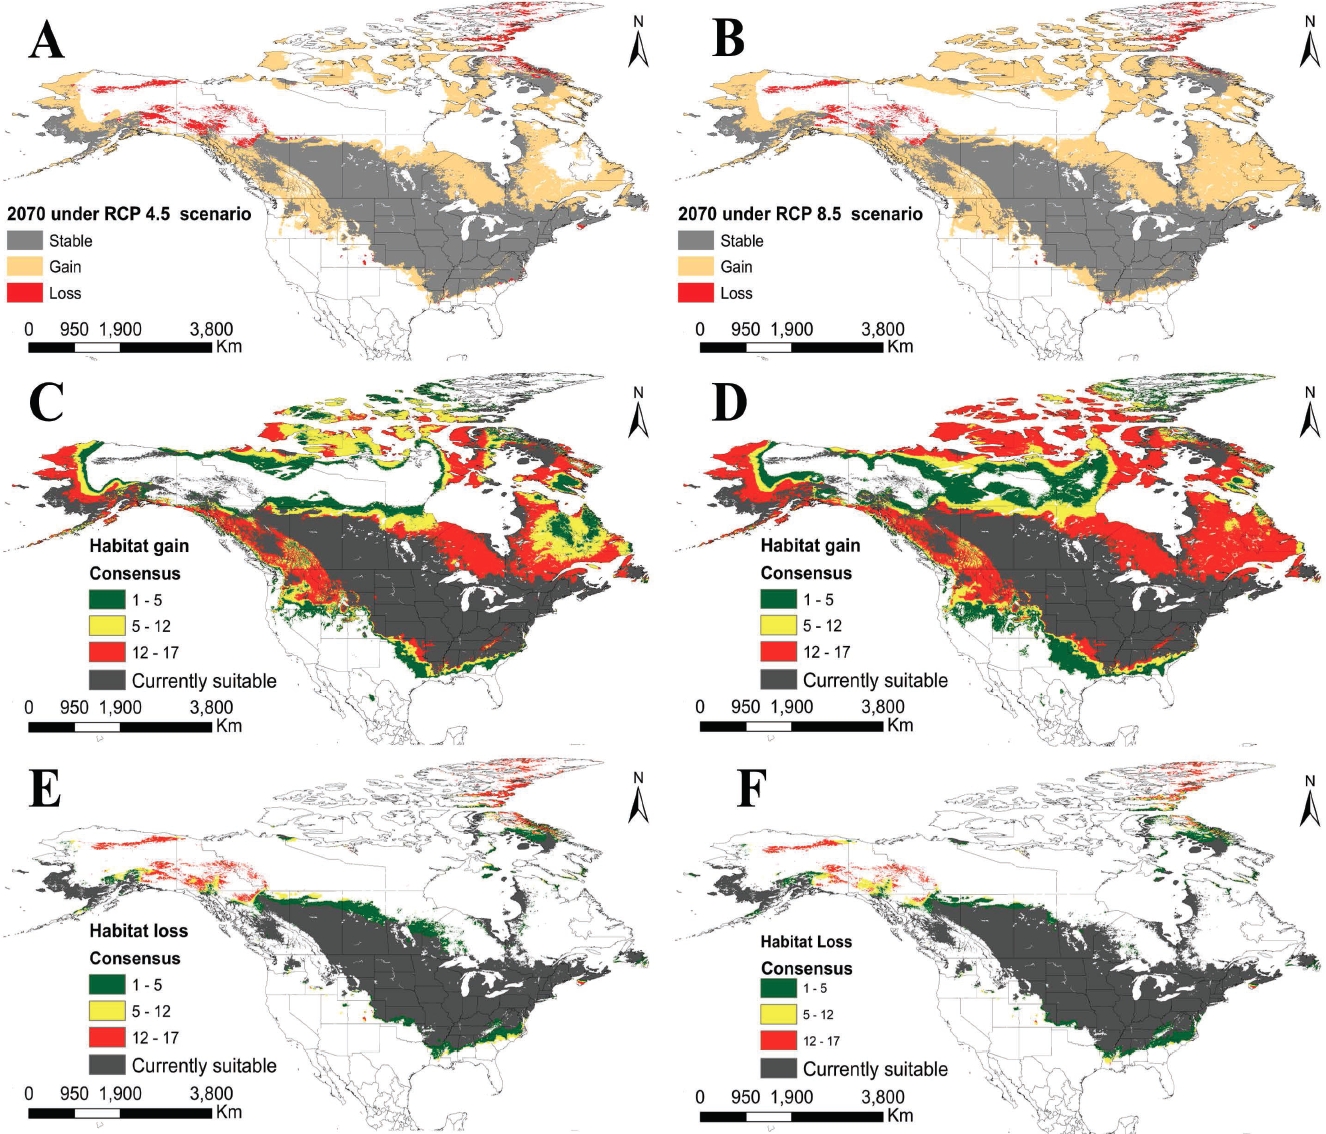
Figure 5 Projected changes in geographic distribution of suitable environmental conditions for Echinococcus multilocularis under the 4.5 (left column) and 8.5 (right column) global emission scenarios (RCP) for 2070. A) Changes in suitable habitat under the lower threshold for the median suitability of all GCM predictions under the 4.5 RCP. B) Changes in suitable habitat under the lower threshold for the median suitability of all GCM predictions under the 8.5 RCP. C) Consensus of predicted suitable habitat gain under the 4.5 RCP for all 17 GCM. Colors indicate the number of models that predict gain in each pixel. D) The same as C for the 8.5 RCP scenario. E) Consensus of predicted loss in suitable habitat under the 4.5 RCP for all 17 GCM. F) The same as E for the 8.5 RCP scenario.
Discussion
To our knowledge, this is the first ecological niche model exercise that has been fully developed and implemented for E. multilocularis in the Nearctic region. The model presented here can be instrumental in efforts to both predict and to monitor the parasite as it continues to expand and perhaps make the jump into humans, domestic animals, and wildlife as it shows geographic areas of both suitable and highly suitable habitats for the species. The partial AUC as well as the average test omission rate indicates the model appears to have very good performance. This model also highlights areas where the parasite is predicted to be present, but so far there is no known record of it. These include eastern North America, especially the northern Appalachians, where highly suitable conditions are expected to occur. Labrador and Anticosti Island also appear as highly suitable for the parasite as well as the isolated patches in the state of Washington. Under the smaller threshold, an important area of North America appears as suitable, which deserves further investigation including a portion of Texas, and Louisiana, areas at this time that are far from the known distribution of the parasite.
This work also provides insights into the variables influencing E. multilocularis distribution, with a novel approach that included biotic variables from host community macroecological data. We found that by including host species richness and proportion of rodent and carnivore communities composed by potential host results in a significantly better model with reduced over-prediction at the time that average omission error does not change. The importance of including biotic variables in these models is further supported by the permutation variable importance analysis as well as the jackknife test that show these variables contribute significant and unique data to the species distribution model. This community data might be a proxy of potential trophic interactions among hosts and might even contain information on dilution effects as host species richness was negatively related to suitability whereas the proportion of host composing the carnivore community was positively related (Civitello et al. 2015). Nonetheless, more field and experimental data should be gathered to fully understand the mechanistic aspects behind this correlative model results.
Besides biotic variables, abiotic factors also had a relatively great impact in predicting the distribution of the parasite over geographic space. The primary variable with the greatest effect on the model was solar radiation, with an intermediate peak in suitability over all replicate models (Figure 4). This might be related to the effect of solar ultraviolet radiation on egg viability of taeniid cestodes (Veit et al. 1995); in addition, maximum temperature of the warmest month also appears as important, probably reflecting the effect of temperature relative to egg viability. Nonetheless, further research is needed to understand the mechanisms behind these correlations.
Despite excellent performance metrics, the model fails at identifying suitable areas in the Arctic where the parasite has been recorded such as Brooks Range, Banks Island, and Point Barrow. However, despite this, St. Lawrence and St. George islands, where the species has been recorded in very high prevalence, are predicted as highly suitable. We speculate that this under-prediction might come from two nonexclusive factors. The first is that as the distribution of the species is negatively influenced by radiation below a certain threshold and positively by maximum temperature, it might be that as suggested by Haverkost et al. (2010) for the tapeworm Paranoplocephala macrocephala, most of the life cycle of the parasite in the Arctic is subnivian and occurs in burrows under the snow were microclimatic conditions are not possible to model at continental scales. The other factor might be the fact that Arctic and central Nearctic populations of E. multilocularis represent at least two different genotypes (Nakao et al. 2009) or as some evidence suggests, the central US forms of E. multilocularis might actually represent another species, as is suggested by the discovery of several more genotypes (Gesy et al. 2014). Some support of this is shown in Figure 2 with a cluster of EM from near Taos, NM, showing distinct separation from other populations in our canonical plots. Thus, it is possible that the Arctic and central North American genotypes of these cestodes possess different niches and given the data quantity differences contrasting both areas, the present model is a representation of the central Nearctic genotypes.
Under the two global carbon emission scenarios evaluated here, the extension of suitable habitat for E. multilocularis is projected to increase. Under the higher threshold, the projected change follows that of other pathogens in gaining suitable areas in the north, a pattern shown by other Nearctic parasites (Brownstein et al. 2005). Nonetheless, this pattern is not general and different parasite species are predicted to show unique responses including range contractions (Sage et al. 2017). For example, in the case of E. multilocularis, some northern areas are predicted to become unsuitable. Although we tried to account for the uncertainties involved in climate model predictions, these projections should be interpreted with care as there are certain untested assumption as well as uncertainties in them. One assumption is that the parasite niche will not evolve, an assumption that is difficult to support, given the potential niche divergence between strains shown here as well as the host-switching potential via ecological fitting of the parasite (Brooks et al. 2014; Brooks and Hoberg 2007). Another potential problem of the projections is that they do not include a deep set of host-community data, which will almost certainly show rearrangements due to climate change (Pandey and Papeş 2018). Despite this, we think these models show the general trend that probably will exhibit some variation resulting from host and evolution complexities.
Here we show that by combining well-documented museum records, morphometric data, and ENM’s we can improve model predictivity and provide extra data that use distribution models for enhancing knowledge on the distribution and ecology of zoonotic diseases. With our approach, we offer a robust hypothesis of the distribution of suitable habitats for E. multilocularis in the Nearctic. This approach to modeling the distribution of zoonotic parasites can be used by biodiversitists, parasitologists, and healthcare practitioners to assess both infections of zoonotic parasites in wildlife as well as in potentially vulnerable human communities in parasite-suitable or highly suitable areas. Besides this, we identified the factors shaping the parasite distribution and suggest a new set of variables coming from host geographic distribution that could be used in modeling of other parasites that have complex life cycles and that can only survive by infecting multiple hosts as Manter (1966) so eloquently stated:
These same parasites also hold promise of telling us something about host and geographical connections of long ago. They are simultaneously the product of an immediate environment and of a long ancestry reflecting associations of millions of years. The messages they carry are thus always bilingual and usually garbled. Today we know only a few selected pieces of the code. As our knowledge grows, studies based on adequate collections, correctly classified and correlated with knowledge of the hosts and life cycles involved should lead to a deciphering of the messages now so obscure. Eventually there may be enough pieces to form a meaningful language which could be called parascript - the language of parasites which tells of themselves and their hosts both of today and yesteryear.
With this contribution, we show that application of both abiotic and biotic variables in ecological niche models (of E. multilocularis) can expand on Manter’s idea of Parascript in historical terms and predict where the parasites might be in the future.

