


 nueva página del texto (beta)
 Inglés (pdf)
 Artículo en XML
 Referencias del artículo
 Enviar artículo por email
 Citado por SciELO
  Similares en
SciELO
Similares en
SciELO 
 Permalink
Introduction
The loss of forest cover leads to population decline and even the disappearance of animal species that depend on these; the viability of populations in fragmented forests is often uncertain and varies widely between species (Irwin 2008). Primates play a key role in seed dispersal in tropical forests, where they contribute to the maintenance of plant diversity (Defler 2010).
An inadequate size of forest fragments disturbs the environmental offer and may result in the local extinction of certain primate species (Lovejoy et al. 1986; Schwarzkopf and Rylands 1989; Estrada and Coates-Estrada 1996; Chiarello 2000). In some relict forests, primate densities can be very high, but these are only the result of the temporary clustering of groups in increasingly smaller fragments (Link et al. 2010). However, the fact that they are not present in all fragments suggests that the fate of these populations is local extinction (Link et al. 2010).
Population density is a core element to understand trends in the populations of primates that have been disturbed by landscape transformations (Crockett and Eisenberg 1987). This makes necessary to assess other aspects such as group size and composition, as both are key elements in the dynamics that influence this demographic parameter (Crockett and Eisenberg 1987). The data on group size, population density, age and sex composition, collected over extended periods of time, can provide essential information to understand the tolerance to the loss and transformation of the habitat of a species (Estrada et al. 1994; Estrada and Coates-Estrada 1996; Crockett 1998; Cuaron 2000). Population density is determined by its carrying capacity, being a dynamic parameter that varies in time and space; therefore, it is important to bear in mind that an assessment derived from a few places at in a specific point in time cannot be conclusive about the trends in certain populations (Coulson et al. 2001; Rudran and Fernández-Duque 2003).
In some cases, due to the reduction and fragmentation of the habitat, some populations are forced to concentrate in a small space to the interior of fragments. This phenomenon, known as crowding, would explain the high densities of primates in landscapes with these characteristics (Defler 1981). This in turn increases competition and inbreeding, makes them vulnerable to predation and parasites, and results in lower reproduction and survival rates (Begon et al. 2006). In addition, the reduction of the habitat leads to increased parasite transmission (animal-animal), associated with the ability of parasites to be transmitted, reproduced and withstand environmental stress and the immune response of the host, thereby affect its birth and mortality rates (Nunn and Altizer 2006; Delahay et al. 2009; Roncancio and Benavides 2013). By modifying the distribution and abundance of individuals in natural landscapes, environmental disruption can affect the patterns of intraspecific competition (Días et al. 2011). Therefore, from the management and conservation perspectives, it is important to know the factors that determine changes in population size and the processes that regulate these changes. This knowledge must begin with an empirical estimate of the number of individuals in populations. However, in terms of knowledge of the ecological relationship of a population with its environment, local density is more revealing than total population size because the former is more directly related to ecological interactions at the local level (Ricklefs 2001). Habitat loss and environmental degradation are, to a large extent, the most important threats to primates in Colombia. Hunting and poaching for the pet market cause a relatively minor impact in areas with habitats that are still intact or where the natural populations of these species are relatively healthy (Defler 2010).
Saguinus leucopus is a primate endemic to Colombia, located in the Departments of Tolima, Caldas, Antioquia and Bolivar, in the central Andean region, at altitudes up to 1,500 meters above sea level (Defler 2010); these regions have undergone a significant amount of habitat as a consequence of human activities (Defler 2010). Saguinus leucopus was originally distributed in an area of approximately 49,000 km2. Due to the reduction and fragmentation of its habitat, it is estimated that this species has lost approximately 60 % of this original distribution (Roncancio et al. 2013). Some studies have estimated the population density of Saguinus leucopus, ranging from 6 individuals/km2 and 2 groups/km2 (Mejía and Gomez 2011), up to 149 individuals/km2 and 27 groups/km2 (Roncancio et al. 2009).
Saguinus leucopus has been listed as an endangered species in Colombia due to its restricted range and the progressive destruction of its habitat, as it inhabits areas subjected to high human colonization (Morales-Jimenez et al. 2008a, b). In addition, many individuals are removed from their natural environment due to illegal trafficking to be marketed as pets (Defler 2010). This species is included in Appendix I of CITES (2017) and is listed as “Endangered” according to the IUCN (Morales-Jimenez et al. 2008b). Furthermore, it is included in the “Vulnerable” category at a national level (MADS 2017). Some researchers consider that this primate is seriously endangered of extinction due to its low genetic variability as a result of the isolation between populations (Leguizamón Hernández et al. 2006).
Saguinus leucopus is a small primate with a body length between 230 and 250 mm, a mean tail length of 380 mm and a weight of about 460 g (Defler 2010). Groups usually include 3 to 9 individuals, although solitary animals or temporary associations of 14 or more individuals have been occassionally observed (Defler 2010). These animals, as well as other species of the genus, consume mainly soft fruits and insects, although their diet includes also lizards, snakes, frogs, birds, spiders, centipedes, millipedes, honey, bark, flowers, leaves, petioles, nectar, exudates and fungi (Cuartas-Calle 2004; Rodríguez-M. et al. 2006). It is a diurnal and arboreal species, moving across the forest using its arms and legs, and is able to jump between tree branches (Leal 2004), often using the lower and middle canopy (Green 1978).
The scarce information about the response of this species to processes such as habitat fragmentation and loss, makes necessary to collect data as part of a monitoring program aimed at determining the true status of the species. Whether mixed landscapes allow it to survive under normal conditions, and whether reserves are effective at maintaining viable populations of the species under the current characteristics and management approaches (Roncancio 2009).
Seeking to contribute to set a baseline to provide relevant information to protect the remaining populations of this primate, as well as reduce the current threats it faces. The objective of this work was to estimate the population density of S. leucopus in the Playas de San Rafael forest, located in eastern Antioquia, Colombia, and, from these results, compare the density obtained here with other localities, determine the association of population density with the local plant structure and diversity, and determine the physical characteristics of the study area.
Materials and Methods
Study area. The fieldwork for this study was carried out between July and September 2011 in the forest known as Playas de San Rafael, located in the vicinity of the Playas Hydroelectric Plant (6º 16’ 48.936” N, -74º 55’ 47.136” W), owned by Empresas Públicas de Medellín, in the municipality of San Rafael, Department of Antioquia (Figure 1). The area is located in the eastern slopes of the Cordillera Central, on the left bank of the Magdalena river, between 900 and 1,200 meters above sea level; the local topography is undulating with moderate slopes (EPM 2011). The mean annual temperature in the area is 23.2 °C, and precipitation is 2,933 mm/year (Hijmans et al. 2005).
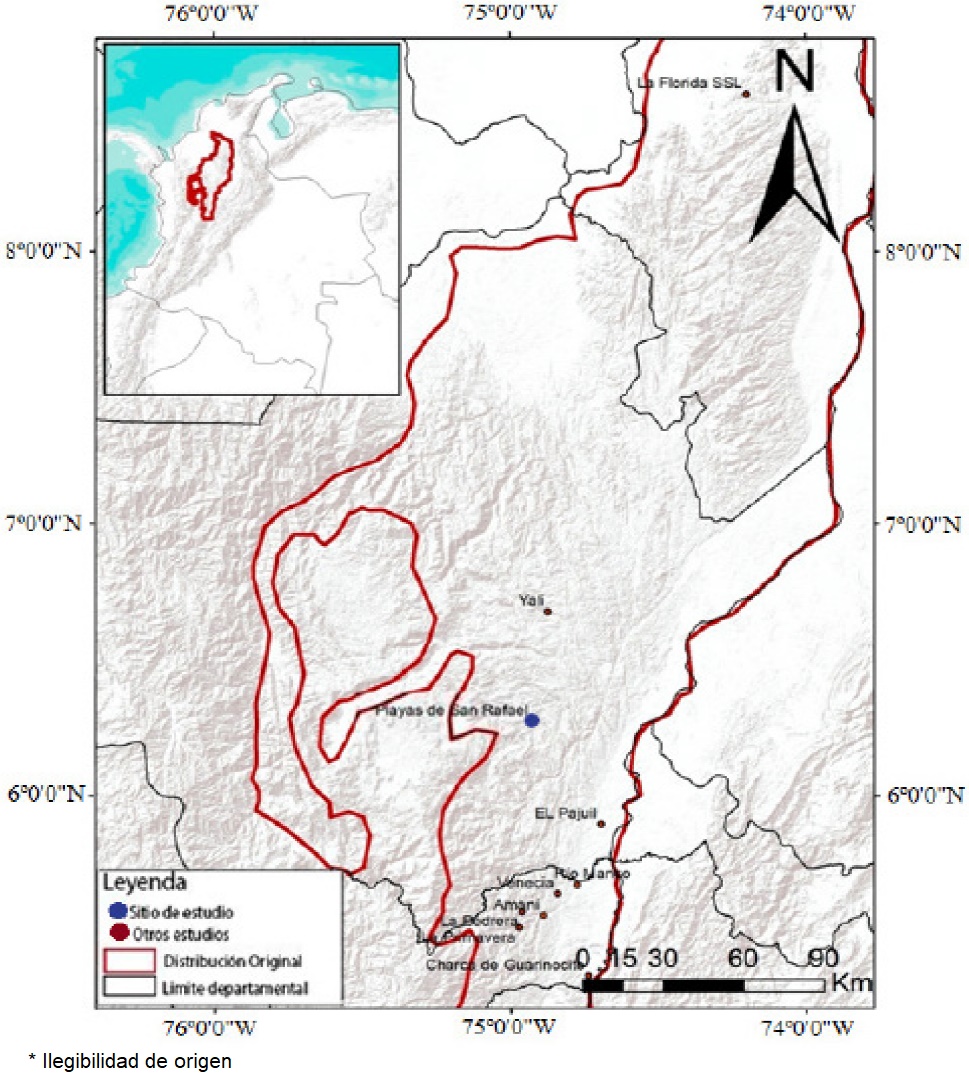
Figure 1 Localities with population density estimation for Saguinus leucopus. Amani (Santamaría et al. 2007), La Primavera (Pyritz et al. 2009), Charca de Guarinocito, El Pajuil, La Pedrera, Río Manso, Venecia (Roncancio et al. 2011), Yali - El Limón (Mejía and Gomez 2011), La Florida (Roncancio et al. In prep.) and Playas de San Rafael (this study).
The forest stretches across approximately 3,875 ha, with 17 ha corresponding to forest plantations of Eucalyptus sp., and Pinus oocarpa, while 3,061 ha are covered by natural forests under a regeneration process during the past 30 years, aimed at preserving natural resources (EPM 2011). The vegetation type is classified as Premontane Wet Forest (bmh-PM; Holdridge 1967). This work was carried out in an area of 400 ha of natural forests.
Physical characteristics of the study area. In order to determine the physical characteristics of the area, a circle shaped local landscape of analysis was defined in the study site that should include, within the smallest perimeter, all the transects used to estimate the population density of S. leucopus. The circle was overlapped with a layer of land coverage in raster format with the Corine Land Cover methodology adapted for Colombia, at 1:100,000 scale (IDEAM 2010) and a digital elevation model. Five characteristics of the study area were measured in this local landscape: vegetation cover; mean shape index (MSI) obtained from the average of the relationship between the perimeter and area of patches. Interpersion juxtaposition index (IJI) on which the estimate of population density for S. leucopus was focused, being a value that measures the spatial combination of different types of fragments and is represented as a percentage of the maximum possible. Mean altitude above sea level, and weighted cover index (WCI). The weighted cover index was developed to incorporate an index to measure the composition and structure of vegetation cover in the local landscape. To estimate the WCI, the types of land cover were scored according to the following scale: dense forest = 8, open forest = 7, fragmented forest = 6, shrubland = 5, herbaceous = 4, crops = 3, pasture = 2, and bare soil, wetlands and urbanized areas = 1. Then, the value of each type of land cover found in the local landscape was multiplied by its relative area; finally, the resulting figures were added up. In this way, if the WCI of a given landscape was about eight, the land cover tended to be dense forest; if, on the contrary, its value ranged between two and three, the local landscape was composed primarily of pastures and crops. All the analyzes were performed using the tool Patch Grid of ArcGis 9.3 (ESRI 2008).
Plant structure and diversity. The plant structure and diversity were assessed according to Roncancio et al. 2011, in six vegetation plots located randomly on some of the transects in the study area; each plot included an area of 50 x 4 m, for a total of 1,200 m2 (0.12 ha). In each plot, trees with a diameter at breast height (DBH) > 10 cm and height > 1.5 m were selected, these values were recorded and plant material was collected as reference for subsequent taxonomic identification by specialists in the Herbarium at the University of Caldas (Manizales, Colombia). The plant diversity analysis was conducted using the inverse Simpson index calculated with the program EstimateS 9.1 (Colwell et al. 2012).
Estimated population density and group size. The population density of S. leucopus was estimated using the sampling method by distances with linear transects and a single observer (Peres 1999; Buckland et al. 2001). This method involves counting the animals seen by an observer who walks along a transect line, by measuring the perpendicular distance to the point where the individual was observed or to the geographical center of the group observed (Peres 1999; Buckland et al. 2001). This methodology assumes the following: 1) The animals found at zero meters of distance perpendicular to the transect are always detected, i. e., the probability of detection is equal to 1. 2) the animals in a group should be recorded in the position in which they were first observed, avoiding to count individuals more than once. 3) the distance between the line and the center of the group should be accurately measured. 4) all observations should be independent events.
To locate the transects, we walked around the whole edge of the study area, in order to determine the geo-location of the perimeter. The location of transects was designed aided with Geographic Information Systems (Figure 2). Forty-four transects were laid out systematically with an average length of 308.6 m (DS ± 27.6 m), separated by 200 m between them, and arranged in a north-south direction at 180°; the total length of transects was 13.6 km and each was marked with phosphorescent tape every 20 m. Each transect was walked in silence 8.1 times on average, at a mean speed of 0.6 km/h, with an average distance of 2.5 km per transect; this resulted in a cumulative sampling effort of 109.8 km away.
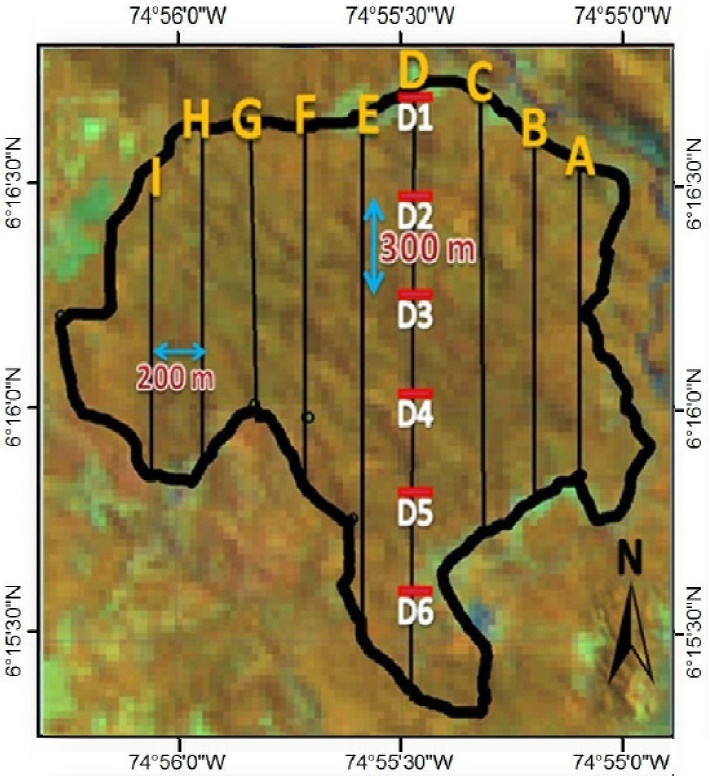
Figure 2 Location of the linear transects in the study area. The letters indicate the trails. *Transects by trail (transects): Trail A: 4 transects, Trail B: 5 transects, Trail C: 6 transects, Trail D: 6 transects, Trail E: 6 transects, Trail F: 6 transects, Trail G: 4 transects, Trail H: 4 transects, Trail I: 3 transects.
Tours were conducted by three persons walking simultaneously along different transects, from 7:00 until 12:00 hours and then from 14:00 to 16:30 hours. When a 20-minute tour was completed, 20 minutes passed before another started, assuming that this time was sufficient for groups of primates to be distributed “naturally” in the area, hence allowing to record the same group in a different transect according to the methodology.
Once an individual or group of S. leucopus was located, the observer remained on site a maximum of 15 minutes in order to keep a constant probability of detection along the transect (Peres 1999). This time is considered as sufficient to determine the size of the group, although there is the possibility of underestimating its size if groups are not followed. Once a group was detected, individuals were counted, measuring the distance perpendicular to the transect (from the geographical center of the group), and the geolocation of the record was determined. This information allowed determining the size of each group recorded; however, it was not possible to determine the sex and age composition, as this would require capturing and examining individuals.
Data Analysis. The DBH and height of vegetation were evaluated using average values; the density of trees was estimated projecting the number of individuals who met the characteristics for the analysis and that were collected (Roncancio et al. 2011). The inverted Simpson index was obtained with the program EstimateS 9.1 (Colwell et al. 2012) from a database of the species identified in each plot sampled, aiming to quantify the plant diversity in the study area.
The population density of S. leucopus was estimated with the program DISTANCE 6. 0 (Thomas et al. 2010). The analysis was run with a database containing transects, total sampling effort for each transect, perpendicular distance for each observation of individuals or groups, and number of individuals recorded in each observation. The aim of the distance sampling analysis is to fit a function to the detection of perpendicular distances of observations and use this function to estimate the proportion of primates that were not detected in the sampling (Thomas et al. 2002).
To find the detection function with the best fit, the frequency distribution of perpendicular distances was compared with six models: 1) Half normal with a cosine series expansion. 2) Half normal with Hermite polynomial. 3) Even with cosine. 4) Even with simple polynomial. 5) Hazard-rate with simple polynomial. 6) Hazard-rate with simple polynomial. From the above models, the one that yielded the lowest value in the Akaike information criterion (AIC) was selected. AIC is a quantitative method for the selection of the model that best fits the data and that uses the lowest number of parameters (Buckland et al. 2001).
The estimated population density for S. leucopus in the study area was compared with estimates for other localities by means of confidence intervals (CI). When the CIs of two density estimates showed an overlap greater than 25 %, it was considered that there was no evidence that the densities in both sites were significantly different, with a 95 % confidence level (Cumming et al. 2007).
Results
Physical characteristics. The perimeter of the study area was 7.96 km, bordering an area of 4.0 km2 (400 ha). The altitude was 1,003 meters above sea level; the weighted cover index () was 6.91, so that the local vegetation can be regarded as an open forest; interpersion juxtaposition interpersion index (IJI) was 59.55, indicating a moderate degree of connectivity in the dominant cover; and the mean shape index (MSI) was 1.46, indicating that the study area tends to be either circular or square.
Plant structure and diversity. The area is dominated by trees of the families Hypericaceae, Melastomataceae, Urticaceae, Ochnaceae, Verbenaceae and Myrsinaceae. Also recorded were species of the families Annonaceae, Sapotaceae, Moraceae, Bignoniaceae, Rubiaceae, Chloranthaceae, Leguminosae, Arecaceae and Flacourtiaceae. A total of 62 individuals were collected, leading to the identification of 22 species; the most abundant one was Vismia macrophylla (Hypericaceae), followed by Belluccia pentamera (Melastomataceae), Cecropia peltata (Urticaceae), Cespedesia spathulata (Ochnaceae), Myrsine guianensis (Myrsinaceae), Lippia sp. (Verbenaceae), and Miconia sp. (Melastomataceae).
In Playas de San Rafael, the mean tree height was 11.5 m (DS ± 4.56; range: 1.8 to 24.5 m), the mean DAP was 17 cm (DS ± 7.57; range: 10 to 52.07 cm), the inverted Simpson index was 10.33, and plant density was 516 trees/ha.
Population Density of Saguinus leucopus. A total of 356 tours were performed, distributed in 44 transects, with an average of 8.1 tours/transect (range: 8 to 9). In all, 55 records of S. leucopus were obtained during these tours. The encounter rate was 0.5 groups/km. The mean group size was 3.8 individuals (DS ± 2.21; range: 1 to 10 individuals/group). The best fit for the frequency distribution of perpendicular distances was the uniform model with a cosine series expansion (Buckland et al. 2001).
The estimated population density of S. leucopus in Playas de San Rafael was 46.5 ind/km2 (95 % CI = 31.9 to 67.9) and 12.3 groups/km2 (95 % CI = 8.8 to 17.2), with coefficients of variation of 19.2 % and 16.8 %, respectively. The component that most contributed to the variance of population density was the encounter rate with 64.7 %, followed by group size with 23.2 %, and probability of detection with 12.1 %.
Discussion
As regards vegetation structure and its relationship with the density of the white-footed tamarin, two fundamental aspects were considered, namely DBH and tree height. The DBH recorded in Playas de San Rafael was low relative to those found in Charca de Guarinocito (32.95 cm), Rio Manso (23.38 cm), Venecia (20.3o cm) and El Paujil (19.67 cm; Roncancio et al. 2011). The average tree height in Playas de San Rafael (11.5o m) evidenced a preference of S. leucopus for lower and middle strata (5 to 10 m) in the forest.
The vegetation cover was homogeneous across the study area, since most of the zones within it were in the same natural regeneration stage. The presence of two individuals of the family Sapotaceae (Pouteria sp.) corroborates the extent of disruption of the forest; most Pouteria species are sciophyte trees, i. e., they need shade in the early stages; in addition, they are long-lived trees and tend to be located on sites with already established vegetation (Finegan 1996). In our study, Pouteria sp.1 showed the largest DBH of the trees sampled, suggesting that they could be relicts of the original vegetation.
The white-footed tamarin usually feeds on a wide variety of fruits that include those produced in secondary forests in early succession stages, riparian forests and even introduced plants (Poveda and Sánchez-Palomino 2004; Santamaria et al. 2007). Within the family Melastomataceae, Bellucia pentamera and Miconia sp. showed a significant abundance; these species have a high productivity of soft fruits that are consumed by S. leucopus (2004 Cuartas-Calle). As Playas de San Rafael is an area with low plant diversity, the permanent food availability can be attributed to families like this. In addition, S. leucopus also consumes fruits of Myrsine guianensis, Cecropia peltata, Inga sp., Pouteria sp., and Rollinia sp. Cuartas-Calle (2004), which were all collected during this work.
The population density of S. leucopus in Playas de San Rafael (46.5 ind/km2) was no different from those reported for other localities, such as the area of influence of the Amani dam (Santamaria et al. 2007), where a population density of 54 ind/km2 was reported (95 % CI = 35 to 84 ind/ km2). El Pajuil, which recorded 37 ind/km2 (95 % CI = 22 to 61 ind/km2; Roncancio et al. 2011). This may be due to the broad coefficients of variation of population density for these sites (> 10 %); narrower confidence intervals allow the detection of significant differences in the density for different areas. This imprecision in the estimate of population density is influenced, to a greater extent, by the variation in the encounter rate, since there is a differential use of the habitat in some locations (Roncancio et al. 2011). To improve the accuracy of the population density estimator, the number of transects should be increased.
To note, similar to this study, in Amani and El Pajuil the size of groups was not estimated from accurate counts of groups; instead, population density was estimated from counts recorded during tours; thus, population density may be underestimated, as the groups found during tours were not followed, some individuals might not have been recorded (Roncancio et al. 2011).
Playas de San Rafael recorded a higher population density versus Yali - Lemon (Mejía and Gomez 2011), a locality with a reported population density of 6 ind/km2 (CI 3 to 10 ind/km2). By contrast, the population density at Playas de San Rafael was lower than the one estimated for La Pedrera, of 101 ind/km2 (CI 58 to 177), Río Manso with 142 ind/km2 (103 to 196), Venecia with 125 ind/km2 (CI 55 to 286; Roncancio et al. 2011), and La Primavera with 149 ind/km2 (CI 78 to 284; Roncancio et al. 2009). The low population density at Yali-Limón may be related to anthropogenic pressures due to the unprotected status of the forest (Mejía and Gomez 2011). On the other hand, the high population density observed in the localities mentioned above can be explained as a density-related compensation, where the extinction of species of larger primates may lead to more resources available for populations of S. leucopus, hence resulting in an increased carrying capacity (McArthur et al. 1972). This overcrowding may also be associated with a crowding phenomenon, where populations tend to be concentrated in forest remnants that act as shelter when habitats become fragmented (Defler 1981).
The population of S. leucopus found in Playas de San Rafael currently meets the conditions required to be considered as in good condition, mainly for being a protected continuous forest. Although there are some roads and buildings that can be considered as barriers, no forest segment is isolated. For some mammal species, this type of artificial structures are likely barriers that restrain displacement; however, in the study area S. leucopus makes good use of these structures and individuals are frequently observed foraging or moving using the taller trees, and sometimes electrical cables as well, to get across roads (pers. obs.). Therefore, it might be assumed that the groups of S. leucopus in the study area are not isolated from other groups and that there is a constant flow of individuals, which would ensure genetic variability; however, genetic studies are necessary to confirm this hypothesis.
In Playas de San Rafael, human activities that have taken place over time such as the construction of the hydroelectric plant and the military base at the highest spot of the forest, in addition to selective logging and poaching, have likely contributed to shape the current vegetation structure. When events of these sort occur, is put to the test the potential capacity of the system to fill the surface area or space available in the forest (Roncancio 2009). Taking into account that one of the main functions of this primate in an ecosystem is the dispersion of seeds, it might suggest that, if there is a greater diversity of plants, probably the diversity in food supply for the tamarins also is greater. However, although the plant diversity in Playas de San Rafael is low compared to other places such as Rio Manso (85.04), Venecia (27.13), La Pedrera (21.54) and El Paujil (14.38) (Roncancio et al. 2011), are some of the favorite plant species by individuals of Saguinus leucopus.
The estimate of the density of Saguinus leucopus in Playas deSan Rafael obtained was 46.5 ind/km2, an average density for the species, taking into account the densities found in other localities. However, it is important to understand that the populations of S. leucopus tend to have significant changes according to the specificities of the environment. To be able to accurately determine the conservation status of the species, through the analysis of the variations in population density, it is necessary that this type of work are constant and are linked to a monitoring plan that will allow to make inferences about the trends of their populations.

