


 text new page (beta)
 English (pdf)
 Article in xml format
 Article references
 Send this article by e-mail
 Cited by SciELO
  Similars in
SciELO
Similars in
SciELO 
 Permalink
Introduction
The understanding and prediction of the responses of species to climate change at different spatial and temporal scales is a key challenge in contemporary ecology. A useful tool to assess the sensitivity of species to climate change is niche modeling, which involves determining the climate-habitat interactions that limit their distribution range (Soberon and Nakamura 2009). However, these niche models are unsuitable for characterizing demographic or ecological processes that are intrinsic to each species (Fordham et al. 2013). At the local level, the area occupied by a species (defined as the proportion of sampling units where a species is detected; Noon et al. 2012) is a parameter that has been used as an alternative to abundance. The area occupied by a species can be used to infer habitat selection and allows proposing hypothesis on species population dynamics and distribution. The occupation model (Gastón and Warren 1997; Mackenzie and Nichols 2004; Buckley and Freckleton 2010) may be useful to analyze the variables that define an ecological niche and favor the conservation of biodiversity in a given area, as some of these variables directly influence the proportion of sites occupied by a given species (Royle and Nichols 2003; Benayas 2009). In this way, occupation also assumes an n-dimensional niche based on presence-absence models.
Most studies on species distribution are based on models that assume a “global” ecological relationship (i. e., water availability, precipitation, vegetation). These ecological relationships may be affected by processes and conditions in the local habitat, and give rise to a heterogeneous pattern that is more accurately described through the values of parameters in a local model (Miller 2012). To test the above, we chose Las Barajitas Canyon, located in the arid coastal region of Sonora where anthropogenic disturbance is low. Nevertheless, due to its location and proximity to the central Gulf of California coast, this site is vulnerable to natural phenomena (tropical storms and hurricanes). Therefore, it is an ideal location to study to identify the conditions associated with ecological wildlife parameters, such as occupation, species’ activity patterns and the identification of a particular ecological niche. The importance of studying niches and occupation in this canyon lies in that these will allow relating the role and likelihood of persistence of a species in a given area (Fordham et al. 2013). In addition, it may represent a model for monitoring changes in the presence-absence of the species in the canyon related to potential natural and anthropogenic disturbances at a local scale.
Mammals are an interesting group to study given their wide distribution range and the diversity of times of the day when they carry out their activities (Bennie et al. 2014). Within mammals, the gray fox (Urocyon cinereoargenteus) is a small-to-medium-sized canid (3 to 5 kg) that is a generalist carnivore with a distribution range spanning from temperate forests to xeric shrublands. It is seemingly more abundant in sites with abundant rocky outcrops and dense vegetation cover (Fritzell and Haroldson 1982; Cypher 2003). In Mexico, it is distributed throughout the continental (Hall 1981); however, there is little information about its ecology (Servin et al. 2014). The gray fox is a species that, for being omnivorous, could function as a stabilizer of ecological networks (Fagan 1997); Due to its broad distribution and biological plasticity, it may also serve as an umbrella species (Brown 2003; Botello 2015).
By using photo trapping — a proven effective non-invasive method to construct occupation models (O’Connell et al. 2010) — the objective was to obtain the baseline conditions and requirements associated with a little disturbed habitat, which influence the ecological niche. In turn, these determine biological plasticity by modeling the distribution of this fox species in Sonora and the Sonoran Desert, as well as the occupation-abundance relationship of U. cinereoargenteus in Las Barajitas Canyon.
Materials and Methods
Study Area: Las Barajitas Canyon (28° 04’ N and -111° 09’ W) is part of a series of canyons in Sierra El Aguaje, belonging to the Sonoran Desert subdivision, in the central Gulf Coast. It is located in the southern edge of the Sonoran Desert, near Guaymas. It includes a broad transition from thorny shrubland to tropical deciduous forest (Felger 1999), which has led to a remarkable biodiversity. The local vegetation is dominated by a Bursera-Jatropha association (Shreve and Wiggins 1951). The local climate is characterized by a transition from tropical arid to tropical semi-arid conditions (Burquez et al. 1999; Peinado et al. 2011; Bogan et al. 2014). Sierra El Aguaje is located within the Cajón del Diablo hunting reserve, corresponding to the Priority Terrestrial Region RTP-18 (CONABIO 2000). Gallo-Reynoso and González-Martínez (2003) reported 799 invertebrate species (9 of which are endemic), as well as 67 mammals, 20 reptiles, 10 amphibian and 250 bird species.
An area of 5.5 km² in Las Barajitas Canyon was sampled, comprising several types of habitats that included riparian, closed xeric shrubland, caves, permanent and intermittent watering holes, open and closed streams, and areas dominated by palm trees (Figure 1).
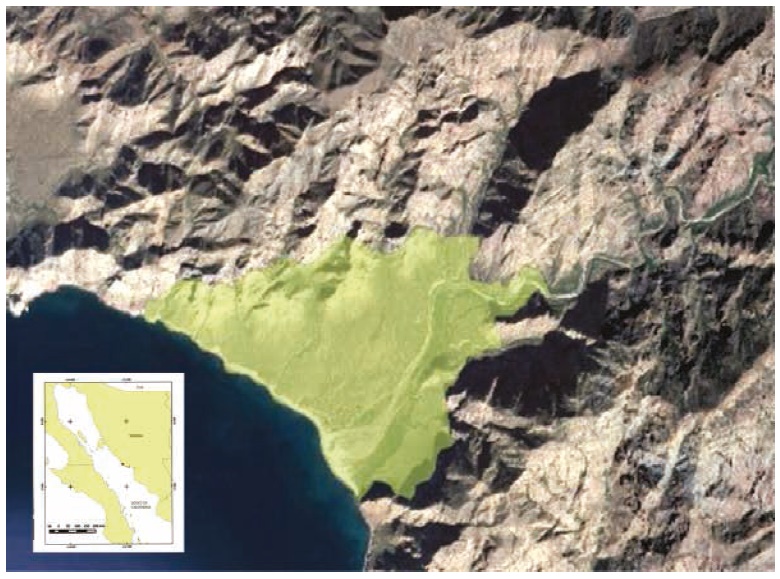
Figure 1 Location of the study area, northwestern Mexico. Sampled area shown in green in the satellite image. Las Barajitas Canyon, Sonora.
Photo trapping: Fourteen photo trapping stations (TS) were established separated by at least 500 m, from May 2013 to April 2014. At each TS, one camera trap (10 Wild-viewXtreme 4, two Bushnell Trophy Cam, and two Bushnell Trophy Cam HD cameras) was placed on tree trunks or wooden stakes at 50 cm above ground and facing north (Chavez et al. 2013). Given the heterogeneity of the habitat, TSs were relocated in each subsequent sampling event (season of the year) to cover most of the study area and identify the most visited sites, thereby setting the criteria for medium- or long-term sampling. In all TSs, except those located adjacent to watering holes, baits (mixture of canned sardine in tomato sauce, raisins and apples; Harrison 1997) were placed during each sampling event. Motion-activated cameras were set to take three photographs per second at 1-min intervals every time motion was detected. Photographs separated by 30 minutes of inactivity between images were considered as separate records (Srbek-Araujo and Chiarello 2005). The value of the Relative Abundance Index (RAI) that was used was the number of separate images per 100 daystrap (Monroy-Vilchis et al. 2009), and population density was estimated as RAI/area studied (Chavez et al. 2013).
Activity Patterns: We analyzed the records of U cinereoargenteus and other sympatric species such as the coyote (Canis latrans), bobcat (Lynx rufus) and cacomixtle (ringtailed cat; Bassariscus astutus), at 2-h intervals throughout the day, thus determining the frequency of occurrence (FO) for each interval. According to Monroy-Vilchis et al. (2009), for this study the twilight period was considered between 06:00 h and 08:00 h at dawn, and between 18:00 h and 20:00 h in the evening.
Vegetation Description and Plant Species-Accumulation Function: To estimate plant species richness, 14 sites close to TSs were sampled, 11 using the quadrant method (an area of 25 m × 50 m) and, on sites with very high vegetation density and cover, three were conducted through vegetation relevés (Braun-Blanquet et al. 1932). In each quadrant, the presence and abundance of each perennial plant species were recorded to calculate species diversity and density. The height of five random individuals of each species was also recorded with measuring tape to determine the vertical structure of the plant community. Photographs of species were taken for subsequent identification in the Herbarium at the University of Sonora. For sites sampled by the quadrant method, an importance value (IV) was estimated for vegetation in each quadrant, as the sum of relative density, relative frequency and dominance of the relative vertical structure, as per Wilder (pers. comm. 2016). For vegetation relives, the percentage of species cover was used (Table 1). These parameters were used as covariates for the occupation models.
Table 1 Importance Values (IV) of vegetation and percent plant coverage of relevés (Braun-Blanquet 1932) for the sites sampled.
| Quadrant | IV/ % | Method |
|---|---|---|
| 1 | 190 | Quadrant |
| 2 | 147 | Quadrant |
| 3 | 221 | Quadrant |
| 4 | 189 | Quadrant |
| 5 | 269 | Quadrant |
| 6 | 205 | Quadrant |
| 7 | 175 | Quadrant |
| 8 | 209 | Quadrant |
| 9 | 309 | Quadrant |
| 10 | 210 | Quadrant |
| 11 | 85 | Br-Bl |
| 12 | 203 | Quadrant |
| 13 | 95 | Br-Bl |
| 14 | 90 | Br-Bl |
The vegetation was assessed through the species-accumulation function (Soberón and Llorente 1993). A matrix of the increase in the number of species was constructed with rows corresponding to cumulative species a), columns to each site sampled b), and each cell to the number of individuals of each species in each sampling site. For linear regression models, the a/b quotient was calculated, where the response variable is obtained by adding a new species (Soberón and Llorente 1993). These species-accumulation functions based on an appropriate model allow the prediction of species richness (Brown 2003). In this study, this function was used for integrating two vegetation sampling methods (quadrants and Br-Bl), thereby determining the state of the vegetation at a given time, and hence discuss the influence of this variable on the presence-absence of the gray fox. Data were analyzed with the program Sigma-Plot version 11.0 (Systat Software Inc., Chicago).
Modeling of Occupation: The occupation (ψ) and probability of detection (p) models were designed by selecting categorical explanatory variables and quantitative variables likely associated with the presence of the gray fox. The categorical variables selected were TS and season of the year (SY, with spring, summer, autumn and winter as categories). The quantitative variables selected were VI (vegetation), presence of sympatric species and height above mean sea level of each TS. Capture histories by TS were produced based on photographic records of U. cinereoargenteus. According to Macias-Duarte and Panjabi 2013, seven occupation models were produced (log-linear relationship model), the parameters of which were estimated with the program MARK (White et al. 2000). The best model to infer the key factors for the detection of and occupation by U. cinereoargenteus was selected using the Akaike (1987) criterion for small samples (AICc; Burnham and Anderson 2002). The statistical significance of the occupation model was determined by a Chi-square test with 95% confidence (White et al. 2000). The occupation-abundance relationship was explained applying a linear regression model with occupation as the TSs where the gray fox was captured, and abundance as the independent records of the gray fox in each TS by season.
Ecological Niche Modeling: The ecological niche and the potential distribution of the gray fox were modelled using records of the presence of this species from the “Cuatro Gatos” project of the Sky Island Alliance non-governmental organization, and from the Global Biodiversity Information Facility (www.gbif.org), and considering the environmental variables associated with these points, cut in ArcGIS 10.1, according to the distribution of this species (Phillips et al. 2006). The bioclimatic variables were obtained from World-clim (http://www.worldclim.org/bioclim). The data were analyzed with the program MaxEnt, which is based on a maximum-entropy algorithm (a higher probability of presence represents less environmental restrictions; Petterson et al. 2011). The bases of the species distribution models (or their ecological niche) are cartographic representations of mathematical or statistical relationships between the actual known distribution and a set of independent variables within a space for the presence of a species, depending on the variables used to derive such distribution. This value represents a probability of presence of the species (Mateo et al. 2011).
Results
Camera trapping: The sampling effort was 164 days/camera. It captured a total of 7,459 photographs of fauna, with 13% corresponding to the gray fox and the rest to sympatric species including coyote (16%), ring-tailed cat (6%) and bobcat (2%), as well as other animal species (Procyon lotor, Tamias dorsalis, Tayassu tajacu, Odocoileus virginianus, Macrotus californicus, Neotoma albigula, Otospemorphilus variegatus, Nasua narica, Lepus californicus, Sylvilagus audobonii and several bird species). Ninety five photographs were considered as individual records of gray fox, with 2 including 2 individuals (female and offspring; female and male), resulting in a RAI = 0.95 for subtropical xeric schrubland. By applying the formula of Chavez et al. (2013), the density of gray foxes is 1.73 individuals per km² in the study area. The highest number of detections occurred in the spring. The sites with the highest Frequency of Occurrence (FO) were those where vegetation cover was >75% according to the method of Braun-Blanquet (1932). Activity Patterns: The activity patterns of the gray fox revealed a higher FO during the night and at twilight hours. The coyote is most active throughout the day, but both this species and the gray fox were found to prefer the darkest hours. In addition, the level of activity of the coyote and the gray fox remained constant throughout the year, although it decreases in the summer (Figure 2).
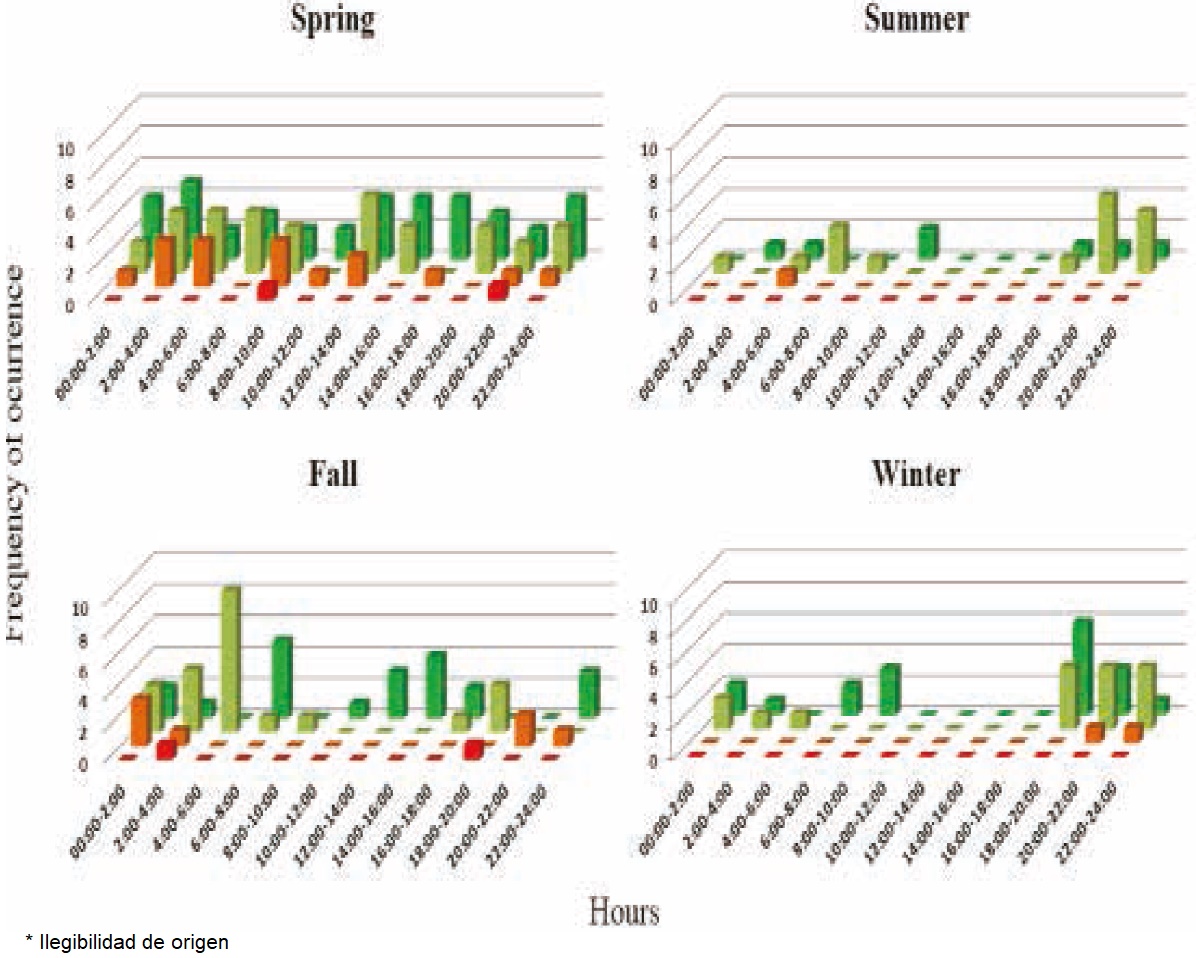
Figure 2 Activity patterns of the gray fox (Urocyon cinereoargenteus) and other sympatric species. L. rufus (red), B. astutus (orange), U. cinereoargenteus (ligth green), and C. latrans (dark green).
Vegetation Description: A total of 3,233 individuals were recorded in 14 sampling sites, belonging to 59 different species distributed in 32 families. The family with the highest species richness was Fabaceae (10), but families with the highest frequency were Euphorbiaceae, Burseraceae and Acanthaceae, being present in all sampling sites. This assessment of the flora of Las Barajitas Canyon found that the dominant plant association is Ruellia-Jatropha-Bursera. With regard to species-accumulation function, a positive linear relationship was observed between species richness and number of sampling sites. The number of sites sampled was insufficient for the function to reach an asymptote of its distribution (Figure 3a). The sites sampled by the Braun-Blanquet method revealed a more pronounced convergence between desert and subtropical species (Table 2).
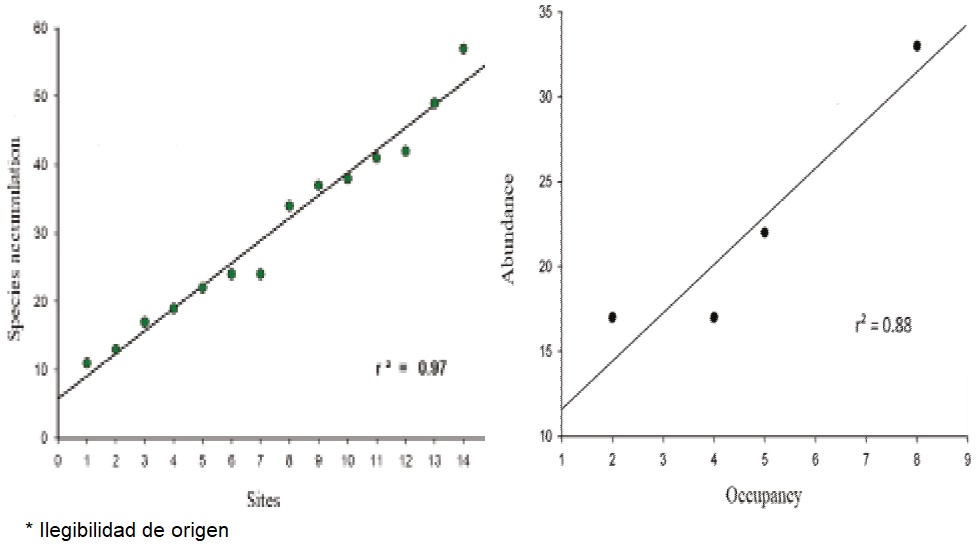
Figure 3 A) Species-accumulation function with the vegetation sampled in Las Barajitas Canyon, Sonora, Mexico. B) Association between occupation and abundance of the gray fox (Urocyon cinereoargenteus) (r² = 0.88) in Las Barajitas Canyon, Sonora, Mexico, in photo trapping stations in May 2013-August 2014.
Table 2 Evaluation of the plant community with higher Frequency of Occurrence of gray fox, by the method of Braun-Blanquet (1932).
| Species | Family | Index | Trait |
|---|---|---|---|
| Watering hole | |||
| Washingtonia robusta | Arecaceae | 3 | characteristic sp |
| Bonellia macrocarpa | Primulaceae | 1 | preferential sp. |
| Carnegia gigantea | Cactaceae | 2 | selective sp. |
| Pachycereus pringlei | Cactaceae | 1 | preferential sp. |
| Stenocereus thurberi | Cactaceae | 1 | preferential sp. |
| Bursera microphylla | Burseraceae | 2 | selective sp. |
| Lycium sp. | Solanaceae | P | associated sp. |
| Maytenus phyllanthoides | Celastraceae | R | incidental sp. |
| Justicia californica | Acanthaceae | P | associated sp. |
| Macroptilium atropurpureum | Fabaceae | P | associated sp. |
| Gossypium davidsonii | Malvaceae | P | associated sp. |
| Hibiscus denudatus | Malvaceae | R | incidental sp. |
| Hofmeisteria crassifolia | Asteraceae | P | associated sp. |
| Bebbia juncea | Asteraceae | P | associated sp. |
| Tephrosia vicioides | Fabaceae | 1 | preferential sp. |
| Stegnosperma halimifolium | Stegnospermataceae | P | associated sp. |
| False mangrove | |||
| Maytenus phyllanthoides | Celastraceae | 3 | characteristic sp. |
| Simmondsia chinensis | Simmondsiaceae | 1 | preferential sp. |
| Jatropha cuneata | Euphorbiaceae | 2 | selective sp. |
| Lycium sp. | Solanaceae | 1 | preferential sp. |
| Brahea brandegeei | Arecaceae | P | associated sp. |
| Atriplex barclayana | Amaranthaceae | P | associated sp. |
| Forchhammeria watsonii | Resedaceae | R | incidental sp. |
| Stenocereus thurberi | Cactaceae | R | incidental sp. |
| Prosopis glandulosa vartorreyana | Fabaceae | 2 | selective sp. |
| Echinocereus scopulorum | Cactaceae | R | incidental sp. |
| Dense shrubland | |||
| Randia thurberi | Rubiaceae | 1 | preferential sp. |
| Simmondsia chinensis | Simmondsiaceae | 2 | selective sp. |
| Maytenus phyllanthoides | Celastraceae | 1 | preferential sp. |
| Forchammeria watsoni | Resedaceae | 1 | preferential sp. |
| Bonellia macrocarpa | Primulaceae | 1 | preferential sp. |
| Lycium sp. | Solanaceae | 1 | preferential sp. |
| Olneya tesota | Fabaceae | 1 | preferential sp. |
| Krameria sonorae | Krameriaceae | 1 | preferential sp. |
| Ruellia californica | Acanthaceae | 2 | selective sp. |
| Sideroxylon occidentale | Sapotaceae | 3 | characteristic sp. |
| Sapindus saponaria | Sapindaceae | 3 | characteristic sp. |
| Marsdenia edulis | Apocynaceae | 1 | preferential sp. |
| Prosopis glandulosa vartorreyana | Fabaceae | 3 | characteristic sp. |
| Ziziphus amole | Rhamnaceae | 3 | characteristic sp. |
| Phaulothamnus spinescens | Achatocarpaceae | 3 | characteristic sp. |
| Ziziphus obtusifolia | Rhamnaceae | 2 | selective sp. |
Index Values for species:
3 = > 75 %, 2 = 50 to 75 %, 1 = 25 to 50 %, P = 5 % and R = < 5 %.
Occupation: The best model (lowest ΔAICc) for occupation (ψ) and probability of detection (p) of the gray fox included the variables climate season and sympatric species (Tables 3 and 4), with ψ = 38.5% (DT = 1.02) p = 7.7% (DT = 0.36). There is a positive linear correlation between occupation and abundance (R² = 0.88, Figure 3b).
Table 3 Models classified by AICc for occupation by gray fox.
| Model | AICc | ΔAICc | Wi |
|---|---|---|---|
| p (station+sympatric species)ψ(station+sympatric species) | 447.77 | 0 | 0.52 |
| p(station)ψ(station) | 447.99 | 0.22 | 0.47 |
| p (sympatric species)ψ(sympatric species) | 477.21 | 29.44 | 0 |
| p(station+IV+alt) ψ(station+IV+alt) | 486.55 | 38.77 | 0 |
| p(station+IV+alt+caco+lynx+coyote) ψ(station+IV+alt+caco+lynx+coyote) | 492.51 | 44.73 | 0 |
p = probability of detection, ψ= occupation. IV= importance value of vegetation, alt= altitude above sea level of the photo trapping station. Sympatric species= coyote, bobcat, and cacomixtle.
Table 4 Best model for the occupation of gray fox (lower ΔAICc).
| Parameter | β | SE | Lower Limit of 95% CI |
Upper Limit of 95% CI |
|
|---|---|---|---|---|---|
| Autumn | 1.9725 | 1.4729 | -0.9143 | 4.8595 | |
| Winter | -1.0615 | 1.3196 | -3.6479 | 1.5249 | |
| Spring | 1.4667 | 1.2979 | -1.0771 | 4.0105 | |
| Cacomixtle | 1.6695 | 0.2970 | 1.0874 | 2.2515 | |
| Bobcat | -0.0488 | 0.3449 | -0.7249 | 0.6272 | |
| Coyote | 1.6142 | 0.3351 | 0.9573 | 2.2711 |
Estimators of regression coefficient (β), standard error (SE) and confidence interval (95% CI).
Ecological Niche Modeling: The models of distribution and probability of occurrence produced by MaxEnt for the State of Sonora and the Sonoran Desert indicate that the probability of presence of U. cinereoargenteus in the study area ranges from 0.46 to 0.62 (Figures 4a, 4b). The bioclimatic variables of highest importance to generate the models for Sonora were precipitation in the coldest trimester, medium diurnal range, and mean temperature in the driest trimester; for the Sonoran Desert, seasonal precipitation, minimum temperature of the coldest season, and precipitation in the warmest trimester, with an AUC = 0.873.
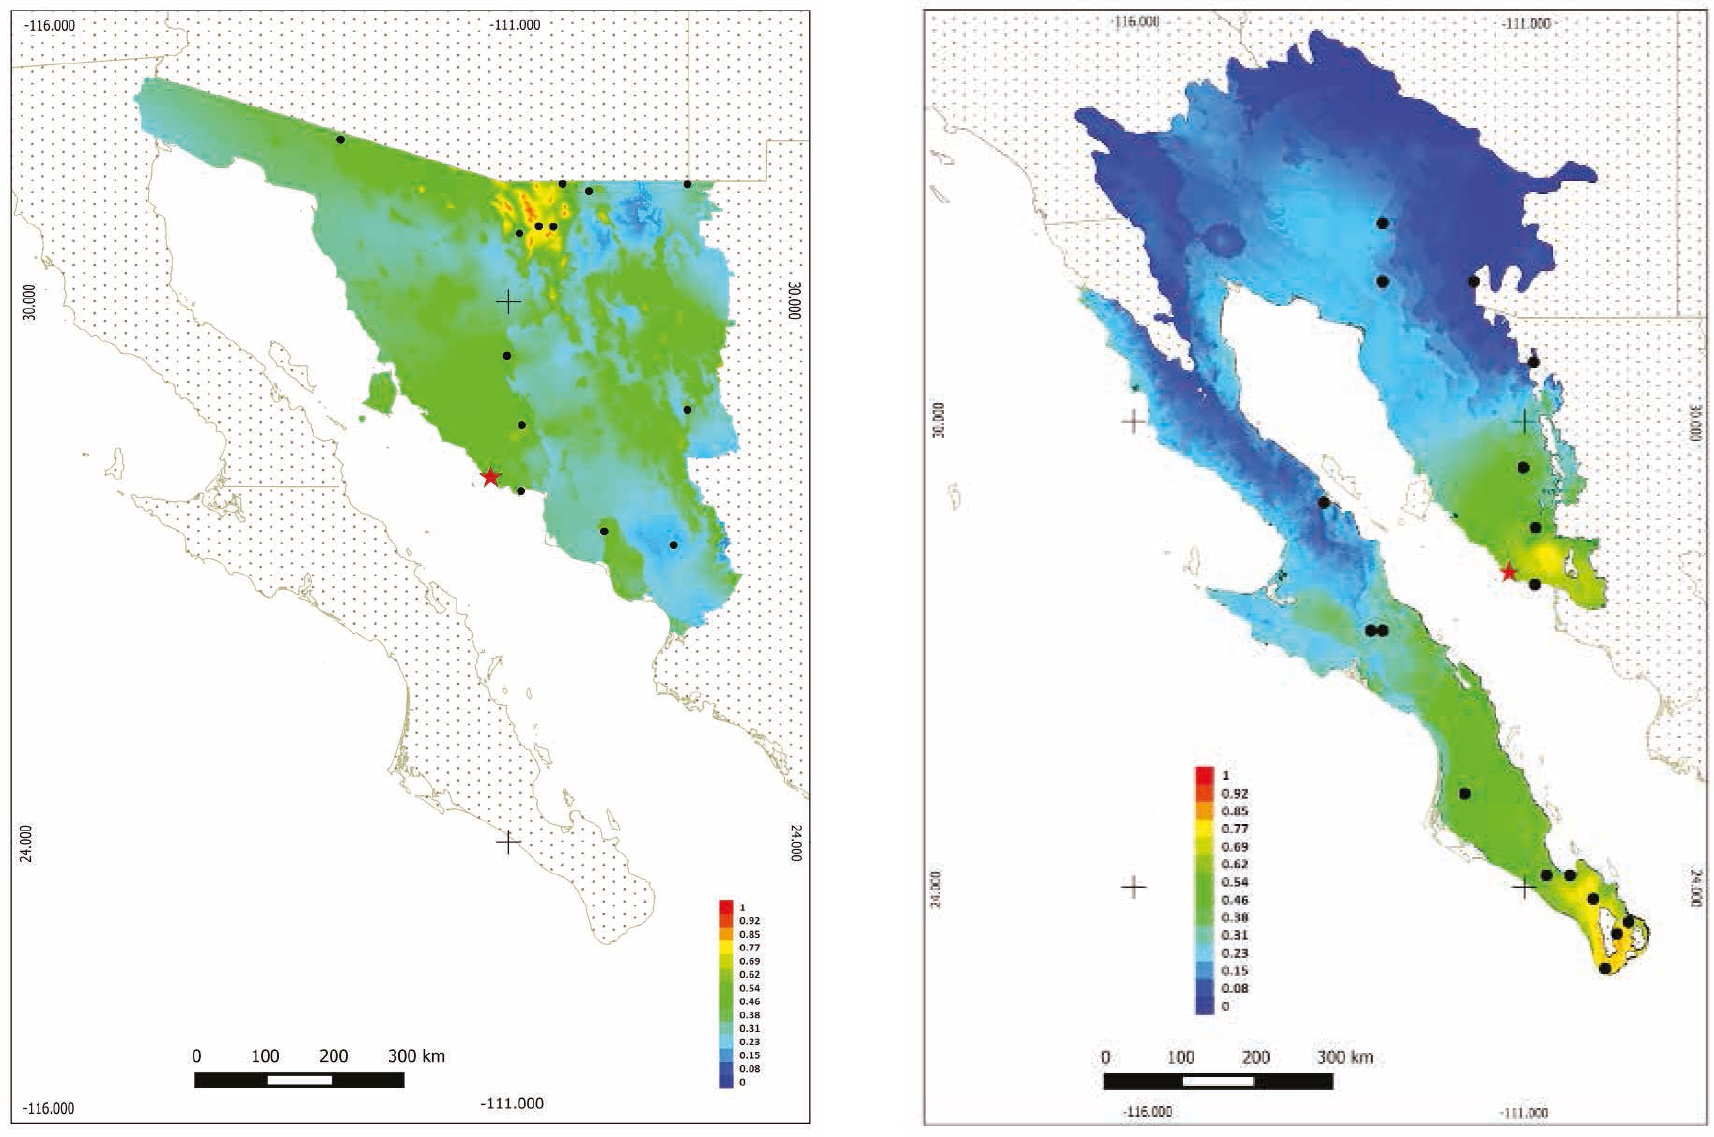
Figure 4 Potential distribution model in Sonora, Mexico, with MaxEnt for the gray fox (Urocyon cinereoargenteus). A) More intense colors (red) indicate a higher probability of presence. B) More intense colors (red) indicate a higher probability of presence. Presence spots of gray fox were used for modeling.
Discussion
Camera trapping: Under the assumption that all TSs have the same probability of capture (Chavez et al. 2013), U cinereoargenteus could be anywhere within the habitat at Las Barajitas Canyon. It was found that TSs with the highest FO were the sites with the most dense vegetation cover, which is considered to be protective of daytime movements across the range of the gray fox (Haroldson and Fritzell 1984; Farias et al. 2005; Sollmann et al. 2013). Fritzell and Haroldson (1982), considering different locations, seasons and estimation methods, found that the density of the gray fox varied from 1.2 to 2.1 individuals per km², which is consistent with the density found in this study (1.73). The value of this parameter indicates that the habitat allows maintaining stable gray fox populations.
Activity Patterns: The coyote (8 to 20 kg), bobcat (5 to 15 kg), and gray fox (3 to 5 kg; Fedriani et al. 2000) are sympatric species across most of North America (Nicholson and Hill 1981; Farias et al. 2005). This convergence is observed in Las Barajitas Canyon, where cacomixtle (0.87 to 1.1 kg) adds to the above species (Poglayen-Neuwall and Toweill 1988). Sargeant et al. (1987) suggest that the sympatric relationship between gray fox and coyote occurs due to the semi-arboreal habit of the former, which provides an effective mechanism to escape from predators. This feature may be considered as a response to pressure from predation by larger species such as bobcat and coyote. Our results differ from those reported by Farias et al. (2005), who mention that the gray fox avoids areas of activity of the potential predators, in both time and space. Similar to the coyote, however, the bobcat is a potential predator of this species. By observing that these species display the same activity patterns in twilight and evening hours, their presence at similar times of the day may be associated with a lower risk of predation. These findings suggest a particular detection in sites frequently visited, where individuals can hide, climb trees or move fast enough to avoid confrontations with these predators.
Vegetation Description: The regularity of flowering and fruiting of plant species is key for sustaining the fauna in a given locality (León de la Luz et al. 1996). Las Barajitas Canyon is a valuable site for the convergence of desert and subtropical species, which provide spaces with greater coverage throughout the year. This is a safer habitat for the gray fox, in accordance with the sites sampled and the frequency of occurrence of this species in these sites. Thus, in terms of vegetation structure in the niche of the gray fox, this canyon is a stable ecosystem, given the relationship between vegetation and fauna to maintain their processes.
Occupation: This depends on the effective or realized niche, which fosters a successful adaptation (Soberon and Nakamura 2009). For an area of 5.5 km² (our field study), occupation values can be considered as high, given the climatic conditions in Las Barajitas Canyon. The model selected to determine and model the presence of U. cinereoargenteus indicates a negative influence in summer, and that the abundance of this species is not directly related to plant diversity. However, floral phenology triggers biological activity and interactions (frugivory), with deciduous shrubs providing a protective dense cover that offers a suitable space for survival.
The biotic conditions associated with climate seasonality are likely to provide the gray fox with a suitable habitat to settle as a closed population, according to the occupation model (Gastón and Warren 1997). This has led to determine the occupation of the habitat and the ecological niche, as measured with a log-linear model, making possible to identify significant effects between resources and environmental conditions.
Ecological Niche: The maps produced with MaxEnt for the study area are within an acceptable value range for classification (Mateo et al. 2011), since U cinereoargenteus is a generalist species with a preference for forested habitats (Fritzell and Haroldson 1982; Chamberlain and Leopold 2000).
The ecological niche of U. cinereoargenteus in Las Barajitas Canyon, as described based on occupation models and correlated with categorical and quantitative habitat variables, indicate that this species does not show niche overlap in a virtually undisturbed habitat (Gastón and Warren 1997). It would therefore be appropriate to consider that the presence of omnivorous generalist species is key for the self-regulation of natural systems (Fagan 1997; Brown 2003; Botello 2015). The ecological plasticity of the gray fox (Lord 1961), coupled with the heterogeneity and floristic diversity of its habitat, allow the diversification of niches between species, contributing to a lower competition for resources; as a result, biodiversity is favored at the local level.
As the existence of an inverse relationship between the density of gray fox and coyote has been previously suggested (Farias et al. 2005). Sollman et al. (2012) state that species with similar feeding habits show a division of habitat and niche, as well as differences in their respective activity patterns, hence facilitating a stable coexistence. In Las Barajitas Canyon, under conditions of little disturbance, the gray fox and the coyote seemingly do not show niche or occupation overlap, and their populations coexist. The analytical techniques used in this study were suitable to identify local factors that may either favor or restrain the particular occupation and ecological niche of the gray fox. Hence, landscape complexity provides environments that favor species and their interspecific relationships, leading to ecological niches based on the local landscape factors in this canyon. For omnivorous species such as the gray fox, the season of the year is seemingly not associated with a drastic change in niche and occupation, suggesting that that this species serves as a major stabilization factor in ecological networks (Fagan 1997).

