


 text new page (beta)
 English (pdf)
 Article in xml format
 Article references
 Send this article by e-mail
 Cited by SciELO
  Similars in
SciELO
Similars in
SciELO 
 Permalink
Introduction
Mitochondrial DNA has been extensively used in studies on phylogeny, demographic processes and intraspecific diversity because of its high nucleotide substitution rate and polymorphism, maternal inheritance, and little recombination (Moritz et al. 1987; Brown et al. 1992; Melnick and Hoelser 1993; Pesole et al. 1999). One of the mitochondrial DNA markers most frequently used for assessing genetic differences and population history in a wide variety of taxa is the control region. This preference derives from its being highly variable with a high level of intra-species polymorphism (Brown et al. 1986; Wolfe et al. 1989; Billington and Hebert 1991; Pesole et al. 1999).
At a geographic scale, landscape affects the habitats, distribution, migration, and genetic structure of populations (Manel et al. 2003). The tools used in phylogeography and for the analysis of genetic diversity can be used to assess the effects of landscape in the distribution of species and the geographic patterns of genetic diversity (Avise 2000).
Genetic diversity is defined as the amount of inheritable variations in organisms, both between individuals within a population and between populations of a species, usually quantified with parameters including expected heterozy-gosity, allelic richness, and haplotype and gene diversity (Beebee and Rowe 2008). Genetic variability analyses contribute to the knowledge of the diversity and evolution of the taxonomic groups studied, the description of species, the differentiation between cryptic groups and their distribution (Frankham et al. 2002), and could even explain the spatial distribution of genetic variation in populations (Hartl and Clark 2007).
Ecuador is a megadiverse country. In the specific case of mammals, this country ranks ninth worldwide, despite being up to 31-fold smaller in area relative to higher-ranking countries (Tirira 2017). Currently, a total of 431 species have been recorded, with 170 (39.4 %) belonging to the Order Chiroptera. Despite this richness, there are few studies specifically related to the genetic diversity of bat species.
Given the scarcity of this type of information, this study focused on determining the genetic diversity of the Ecuadorian populations of the ghost-faced bat, Mormoops megalophylla (Peters 1864). This is a medium-sized insectivore bat (51 - 60 mm, forearm) characterized by complex skin folds in the rostrum, chin with large concave dermal plates, and small eyes surrounded by short rounded ears connected at the front by a skin fold (Rezsutek and Cameron 1991; Tirira 2017). This species is widely distributed in North America, from southern United States through Central America to northern Peru (Rehn 1902; Simmons 2005). Four subspecies are currently recognized: M. megalophylla megalophylla, M. m. tumidiceps, M. m. intermedia, and M. m. carteri; the latter being the one reported in Ecuador (Dávalos 2006). At a global level, the species is classified as Least Concern in the IUCN Red List of Threatened Species (Dávalos et al. 2008); in Ecuador, however, the species is classified as Vulnerable, since its estimated distribution area is less than 2,000 km2, having been recorded in less than ten localities, and considering that their populations might experience extreme demographic fluctuations (Boada et al. 2011).
Mormoops megalophylla inhabits the northern sierra of Ecuador in temperate and high Andean environments where it has been recorded in seven localities: Gruta de la Paz, Rumichaca, Guandera, and Loma Guagua in the Province of Carchi; and in San Antonio de Pichincha, Lloa, and Jerusalem in the Province of Pichincha (Boada et al. 2003,2011). These localities correspond to dry Interandean forest (MDMQ 2011) and lower montane wet forest (MAE 2012). However, records of the species are recurrent only in Gruta de la Paz and San Antonio de Pichincha. The distance between these two localities suggests the potential exchange of individuals between them or the likely existence of additional caves with important populations not yet identified.
Previous studies, especially in Central America, have shown that when there are geographic barriers between bat populations, these show varying degrees of genetic variability (Guevara-Chumacero 2009; Caraballo 2012; Zárate-Martínez 2013; Ruiz-Ortiz 2014). Thus, it was considered that a study to assess genetic diversity in Mormoops mega-lophylla could provide information on the role of landscape as geographical barrier, since it is composed of an array of agricultural and cattle-raising land with few patches of natural forest within an altitudinal range between 1,800 and 4,020 m. The intraspecific relationships in the species of the family Mormoopidae in Ecuador have not been studied; hence, this first approach will determine the genetic variability patterns between populations that are probably remnants of Mormoops megalophylla, characterizing the current geographical distribution of the genetic diversity of populations, and laying the foundation for further studies and proposals related to the conservation of this species.
The research activities proposed in the Action Plan for the Conservation of Bats of Ecuador by Burneo et al. (2015) include the design and development of studies that contribute to the knowledge of the species to determine its demographic features and current conservation status. These objectives can be partially achieved with the information derived from the assessments of the genetic status of the main populations of the ghost-faced bat across its distribution range.
The objective of this study is to provide information about the genetic diversity patterns of Mormoops mega-lophylla in Ecuador, through the analysis and description of the geographical distribution of haplotype and nucle-otide diversity of populations, in order to infer whether alterations in landscape have become physical barriers that restrain gene flow between them.
Materials and Methods
Study area, marking of individuals and sample collection. Two localities were sampled: Gruta de la Paz (GP, Carchi) 0° 30' 59.976" N, -77° 52' 0.0114" W, a tunnel-like broad cave, and San Antonio de Pichincha (SAP, Pichincha) 0° 0' 57.6" N, -78° 27' 0" E, a cave of about 120 m in length (Boada 2003; Figure 1). Individuals were captured and manipulated following the techniques of Kunz et al. (2009) using mist nets from 18:30 until 23:30 (5 hours/net/day) at sites close to shelters in the two localities for a total of 12 nights over a period of eight months in each locality, between June and September 2014. Samples of wing membranes were collected and stored in microtubes, preserved in 70 % ethanol and kept at 4 °C until DNA extraction. Bats were marked with aluminum rings (National Band and Tag Company©) in the forearm and with numbered tattoos in the plagiopa-tagium following the methodology proposed by Kunz and Weise (2009). Bats were released in order to record any displacement of individuals between both areas.

Figure 1 Sampling and marking localities of Mormoops megalophylla in Ecuador. GP (Gruta de la Paz - Province of Carchi) in red; SAP (San Antonio de Pichincha - Province of Pichincha) in green. The map depicts the linear distance between both localities, in kilometers.
Four voucher specimens were collected, two males and two females from each locality, following the collection, preparation, and preservation protocols of Simmons and Voss (2009). The specimens were deposited in the Mammalogy Section of the Zoology Museum at Pontificia Universidad Católica del Ecuador (QCAZ-M). Tissues were frozen at -20 °C.
The sampling and collection of specimens were performed following the ethical guidelines specified in Sikes et al. (2016). Field work was conducted with the permission of the Provincial Offices of the Ministry of the Environment in Carchi and Pichincha (Research authorizations MAE-DPAC-UPN-BD-IC-FAU-2014-002 and 09-2014-IC-FAU-DPAP-MA, respectively).
Mitochondrial DNA extraction, amplification, and sequencing. DNA was extracted from 20 individuals from each locality, following the protocol of Lopera-Barrero et al. (2008). The D-Loop was amplified following the protocol of Zhong et al. (2013) using the primers for the mitochondrial DNA Control region in mammals reported by Fumagalli et al. (1996): L16517 (5'-CAT CTG GTT CTT ACT TCA GG-3') and HSC (5'-TGT TTT AGG GGT TTG GCA G-'3), with a modification of primer HSC by Guevara-Chumancero (2010): HSC (5'-TGT TTT AGG GGT TTG GCA G-3') to amplify 700 bp approximately. The thermal profile consisted in an initial denaturation at 94 °C for one minute followed by 35 amplification cycles at 94 °C for one minute, alignment at 50 °C for 45 seconds, extension at 72 °C for 90 seconds, and a final extension step at 72 °C for four minutes.
The amplified products were purified using the commercial kit Amicon Ultra-0.5 mL Centrifugal Filters for DNA Purification and Concentration - UFC503096 (Millipore) according to the manufacturer's protocol. Subsequently, the sequencing reaction of both strings was performed using the Big Dye Terminator Kit (Applied Biosystems) and including the following stages: one run at 96 °C for one minute, 35 cycles at 96 °C for 10 seconds, 50 °C for five seconds, 60 °C for 4 minutes, 60 °C for one second and a final temperature of 10 °C. Samples were sequenced in the ABI PRISM 3130XL analyzer. The extraction, amplification, photodocumentation, purification, and sequencing processes were conducted in the Molecular Biology Divisional Laboratory (LDBM) at Universidad Autónoma Metropolitana, Campus Iztapalapa, Mexico (UAM-I).
Sequences were reviewed, edited, and aligned using the Clustal W algorithm in Geneious v.8.1.3 (Kearse et al. 2012), and were analyzed visually. In this process, we worked with a 273 bp fragment because regions of tandem repeats (GTGCACACACCCACGT) with absence of polymorphisms were found from position 274.
Intra-population genetic diversity. The following diversity estimators were determined for each locality: number of polymorphic or segregating sites (S) to represent the number of sites that differ between the aligned sequences; number of haplotypes (k); haplotype diversity (h; Nei 1972) to describe the number and frequency of haplotypes with values between 0 and 1, where < 0.5 and > 0.5 represent low and high diversity, respectively. Also, nucleotide diversity (π; Nei 1978) was determined to reflect the frequency of haplotypes and the divergence of sequences between all haplotypes, by measuring the probability of finding two different homologous nucleotides when these are analyzed in the sequences. This parameter can have values between 0 and 1, and is interpreted in the same way as haplotype diversity (Nei 1972; Frankham et al. 2002). These analyzes were run with DNAsp v.5 (Librado and Rozas et al. 2009).
The molecular variation within and between populations was determined through an analysis of molecular variance (AMOVA) with Arlequin v.3 (Excoffier et al. 1992). The gene flow (Nm) between populations was analyzed with DNAsp v.5 (Librado and Rozas et al. 2009) based on the Islands Model of Hudson et al. (1992).
To estimate genetic distances between populations, the fixation index (FST) between the two populations was calculated with MEGA v.5 (Tamura et al. 2011), using the Tamura-Nei model (Tamura and Nei 1993) which considers the differences in substitution rates (transitions and transversions) as well as the different frequencies of the nucleotide bases.
Generation of the haplotype network. The genealogical relationships between the haplotypes found and their geographical distribution were analyzed through a network of haplotypes following the Median Joining method (Bandelt et al. 1999) using PopArt v.5.
Calculation of distances between caves. In addition to the Euclidean distance between the San Antonio de Pichincha cave and the Gruta de la Paz cave, the lowest-cost route between the two localities was calculated based on the minimum difference of altitude in the transition between pixels using the Cost Distance spatial analysis tool from ArcGis v10.3.1, on an elevation layer with a resolution of 30 seconds obtained from the ESRI (Environmental Systems Research Institute) website.
Results
Study area, marking of individuals and sample collection. Over eight months, a total sampling effort of 60 hours/ net was conducted in each locality; this led to 473 individuals captured, 93 corresponding to GP (42 males and 51 females) and 380 to SAP (226 males and 154 females). Seventy two of the individuals captured were marked in GP and 338 in SAP. Wing membrane tissue was collected from 53 individuals in GP and 98 in SAP, randomly chosen among the adults captured. During the study, there were no individuals recaptured in a given locality that had been previously marked in the other.
The sampling effort, in hours/net, was similar in the two localities; however, the number of individuals captured in GP represented only 24.5 % of those captured in SAP. This was due to the difficulty of capture in GP, mainly due to the restricted access to the cave through ravines, pasture land, private agricultural plots, and the flooding of Apaqui river between June and September 2014, as well as to the impossibility to capture individuals manually because of the height of the cave roof (about 30 meters).
Mitochondrial DNA extraction, amplification and sequencing. Molecular analyses were run using 20 tissue samples from each locality (GP: 7 males, 13 females; SAP: 16 males, 4 females). Of these tissues, DNA was successfully extracted from 37 individuals: 17 from GP and 19 from SAP. The amplification and sequencing of the selected region produced 33 edited D-Loop sequences with a total length of 700 bp and a final length of 273 bp.
Intra-population genetic diversity. The diversity estimators of the D-Loop region for the study localities are shown in Table 1. The 33 sequences analyzed yielded nine segregating sites (S = 9). The GP population shows lower number of segregating sites, haplotype diversity and nucleotide diversity relative to SAP. However, haplotype diversity was high (> 0.5) and nucleotide diversity was low (< 0.5) in both localities. A total of nine haplotypes (k = 9, encoded as H1 -H9) were identified in both locations. There were eight haplotypes in SAP, four of these being unique (H6, H7, H8, and H9); in GP, five haplotypes were found, with only one being unique (H4; Figure 2). Of these nine haplotypes, three (H1, H2, and H3) showed the highest frequency in the 33 individuals analyzed in both localities. The location of segregating sites in the nine haplotypes identified is shown in Table 2.
Table 1 Diversity estimators of the D-Loop, distribution and frequency of haplotypes within localities. (n): sample size; (S): number of segregating sites; (k): number of haplotypes; (h): haplotype diversity; (π): nucleotide diversity.

u: unique haplotype for the population

Figure 2 Geographical distribution of D-Loop haplotypes in the two localities. The pie charts show the geographic location of haplotypes and their distribution in the two localities. Colors indicate shared haplotypes; white indicates haplotypes that are unique to each locality. Each haplotype is named with the letter H followed by the respective number.
Table 2 Variable sites and frequency for the nine haplotypes obtained from the D-Loop in the two localities. Dots represent equality based on the first row (H1). Numbers represent the position of the variable base in the sequence. The right side of the table details the frequency of each haplotype by locality.

The AMOVA indicated a low differentiation level between SAP and GP populations (FST(SAP-GP) =0.04, P < 0.05). This analysis showed that this low differentiation level is solely due to differences within populations (103.46 %) rather than to differences between populations (-3.46 %; Table 3).

The gene flow estimated by the number of migrants between both groups using the Islands Model of Hudson et al. (1992) was negative (NmSAP-GP = -15.42), indicating that this estimator cannot be defined for the sample.
Haplotype network. The configuration of the haplotype network obtained provides further data supporting the lack of differentiation between the populations studied. H1, H2, and H3 are the most frequent haplotypes and are distributed evenly between localities. One unique haplo-type was observed for GP and three for SAP (Figure 3).
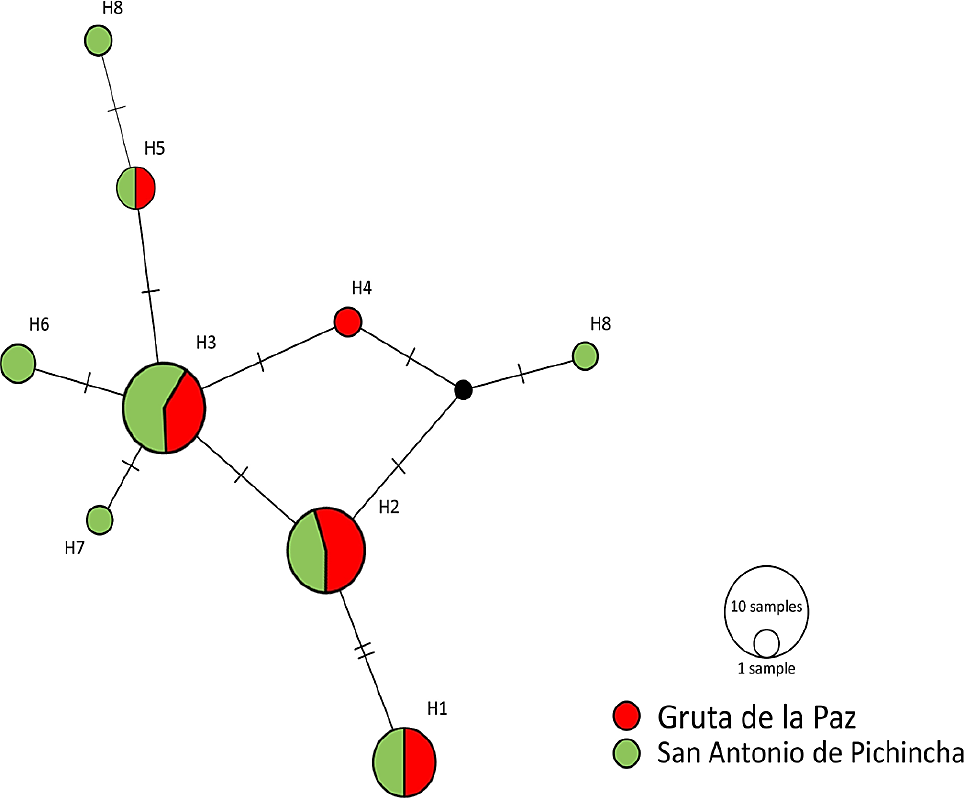
Figure 3 Median-joining haplotype network for D-Loop in the populations of Mormoops megalophylla studied in Ecuador. Circles represent the nine haplotypes, with GP haplotypes in red and SAP haplotypes in green. Lines on bars that separate haplotypes represent the mutational steps between one haplotype and another. The black dot represents a haplotype that was not sampled.
Calculation of distances between caves. The Euclidean distance between the two bat colonies where large populations of the ghost-faced bat have been recorded - San Antonio de Pichincha, in the Province of Pichincha, and Gruta de la Paz, in the Province of Carchi - is 87.6 km (Figure 1). A flight in a straight line following the topography of the land would involve an altitudinal difference of 2,220 m. The calculation of the lowest-cost route indicates that, although the flight distance would increase by 44.6 km (to 132.2 km), the altitudinal difference would be of only 1,090 m (Figure 4).

Discussion
This work is a first approximation to analyzing the genetic diversity between colonies of the vulnerable species Mor-moops megalophylla, and contributes to the conservation efforts proposed by the Action Plan for the Conservation of Bats of Ecuador (Burneo etal. 2015). In spite of living in isolated locations, these bats behave as a single population as evidenced by the little genetic variability between them.
The mitochondrial region analyzed showed a lower genetic diversity in the GP population vs. SAP. This low diversity may be a result of historical reductions in bat population size in GP, leading to bottlenecks with the consequent loss of diversity (Frankham 1995). A pattern of high haplotype diversity coupled with low nucleotide diversity has been observed in the genus Pteronotus, as well as in the family Mormoopidae. This pattern arises either because populations underwent bottlenecks followed by accelerated population growth, or because the populations remaining after experiencing bottlenecks have lost their genetic variability (see Guevara-Chumacero 2009; Caraballo 2012; Zárate-Martínez 2013; Ruiz-Ortiz 2014). There were nine segregating sites obtained with the D-Loop (Table 1); this finding is consistent with the expected result, as the D-Loop shows high variation levels for being non-coding (Klicka et al. 1999; Milá et al. 2007; Beebee and Rowe 2008; McCormack et al. 2008). It should be noted, however, that the results of analyzing a mitochondrial marker are associated with females, so that subsequent studies should include markers associated with the Y chromosome in the analysis.
The haplotype diversity found in the control region is low relative to the results obtained in other studies using the same mitochondrial region. In this case, nine haplotypes were observed in 33 samples, contrasting with studies conducted in other bats with long-range flight capabilities: 35 haplotypes in 53 samples of Leptonycteris curasoae (Phyllostomidae) (Wilkinson and Fleming 1996); 86 haplotypes in 94 samples of Tadarida brasiliensis (Molossidae; Russel et al. 2005); and 67 haplotypes in 105 samples of another mor-mopid bat, Pteronotus davyi (Guevara-Chumacero 2009).
Based on the information published by Nei et al. (1975) and Avise (2000), it could be inferred that the high haplo-type diversity and low nucleotide diversity values in Ecuador suggest that ghost-faced bat populations could have undergone a period of vigorous growth from a low effective population size, with time sufficient to build haplotype diversity but insufficient to increase nucleotide diversity.
The FST value for the D-Loop is very close to zero (FST = 0.04), indicating a virtually non-existent population variability. The negative, or infinite, value of Nm indicates that in this case the estimator cannot be defined for the sample, which could be due to the fact that the subpopulations analyzed actually belong to a single genetic population (Hudson et al. 1992). The AMOVA results show the lack of genetic differentiation between both populations (Table 3); the negative value between populations indicates that there is no variation, while a value above 100 % shows that the total variation occurs within populations (Beebee and Rowe 2008). The poor differentiation between haplotypes is indicative of a panmictic population that has been fragmented recently by habitat loss and transformation, in addition to the direct threats that populations currently face, such as moderate tourism activities in SAP and religious events in GP.
The little differentiation between haplotypes and the shared frequencies between both localities suggest the existence of a single lineage. However, the absence of recaptures of individuals from SAP in GP, and vice versa, in this study, suggests that this population has been split by habitat transformation, leading to isolated colonies.
In spite of this, the absence of genetic differentiation could be due to the high dispersal ability of bats associated with their high and strong flight (Rezsutek and Cameron 1993), although other studies with flying species, including migratory ones, have shown that genetic differences may be a consequence of habitat fragmentation (Bates 2002; Lindsay et al. 2008; Oliveras de Ita et al. 2011). By avoiding high mountain areas in this potential flight route, individuals would be forced to cross a greater number of fragmented areas, as shown in Figure 4. The species studied is tolerant to fragmented environments, but prefers cave environments (Rezsutek and Cameron 1993); therefore, the lowest-cost route would define future efforts in the search of caves in these intermediate environments where populations of the species could be found, in order to confirm whether there is flow of individuals (and, therefore, gene flow) between the Ecuadorian populations, since non-reproductive males and females of the species often use different caves or different parts of caves than breeding females (Bonaccorso et al. 1992).
Endangered species often exist as a few isolated populations (Harrison and Bruna 1999), and this has been the situation observed in the ghost-faced bat populations studied in Ecuador. It is crucial to preserve both populations, as the presence of unique haplotypes suggests the occurrence of an early differentiation event. If this is the case, this variability could be detected in future analysis with the use of markers such as microsatellites or restriction sites associated DNA (RADseq).
Under this assumption, the maintenance of genetic diversity is important for two main reasons: individual differences are important because they are inheritable and, therefore, provide inputs for natural selection; in addition, genetic diversity reduces the inheritability of unfavorable traits, since individuals in isolated populations are forced to mate with relatives (inbreeding), leading to genetic uniformity in offspring (Lacy 1997). Maintaining genetic diversity in endangered species such as Mormoops megalophylla is essential for the survival and adaptability of their populations in the face of extreme environmental conditions such habitat fragmentation and pollution.
The San Antonio de Pichincha cave and the Gruta de la Paz cave maintain numerous bat colonies in tourist areas and zones dedicated to the extraction of building materials, making them sensitive to disturbance. Boada et al. (2003) estimated that the Pichincha colony would include around 4,800 individuals, while estimates from this study indicate the presence of around 3,260 individuals; which indicates a significant decline in a period of just over a decade. Something similar is likely happening in the Carchi colony. Being a strict insectivore, the ghost-faced bat has a significant bioindica-tor potential due to its susceptibility to pollutants by having a high bioaccumulation capacity (Jones et al. 2009). This is an important trait to be considered in areas that include the last remnants of Andean dry forests in the region.
|n order to preserve the genetic variability of this species in Ecuador, a significant effort is needed to inventory possible caves in intermediate localities between San Antonio and Gruta de la Paz, given the genetic flow that may still exist between these populations, as suggested by the results of the gene flow analysis, which could not be confirmed through recaptures. If new colonies of ghost-faced bats are found, local conservation networks should be formed to maintain the integrity of caverns.
In 2011, the cave located in San Antonio de Pichincha was declared an Important Site for the Conservation of Bats (SICOM) by the Latin American and the Caribbean Network for the Conservation of Bats (RELCOM) after having considered this place as a refuge for the species. A similar approach is currently in development for Gruta de la Paz. The information obtained in this study will be one of the inputs to meet the conservation goals for this species, as proposed in the Action Plan for the Conservation of Bats of Ecuador (Burneo et al. 2015).
The populations of Mormoops megalophylla in Ecuador yielded low estimated diversity values relative to other mormopid bats for the mitochondrial region analyzed. The genetic diversity indicators (FST Nm, and AMOVA) show that the two populations studied form a single genetic population that, according to the haplotype network, is undergoing an early differentiation stage.
This study and its results, in relation to the information on the molecular marker used, provide early indications of the status of populations based on their genetic variability. These should be supplemented with the use of a marker associated with the Y chromosome, and with information from other markers such as microsatellites.
The disruption of caves has proved to be a significant threat for the conservation of species such as Mormoops megalophylla in Ecuador. Although we consider that all caves sheltering bats should be protected and their access restricted whenever possible, we also believe that tourism activities should be carefully planned and monitored.
The conservation of this bat species in the country warrants continued monitoring using marking techniques to determine its migratory processes and evaluate the habitat fragmentation between the two locations studied. Also required are sampling efforts in intermediate sites and localities with historical records, as well as the analysis of other genetic regions as markers of nuclear origin.

