


 nueva página del texto (beta)
 Inglés (pdf)
 Artículo en XML
 Referencias del artículo
 Enviar artículo por email
 Citado por SciELO
  Similares en
SciELO
Similares en
SciELO 
 Permalink
Introduction
Estimates of the population size and the definition of habitat use of wild mammals are factors of paramount importance for management and/or conservation purposes; these parameters can provide key information for decision-making in relation to these populations (Sutherland 2006). Population abundance and distribution vary in space and time, along with the availability of environmental elements needed to sustain life (Litvains et al. 1996).
The habitat provides food, coverage, shelter and other factors that are essential to the survival of populations. Many ecological research in mammal populations, such as those focused on estimating abundance, the condition of pupulations (Dellafiore and Maceira 1998; Richard et al. 1998; Walker et al. 2000), and the use of their environment, provide key information for long-term conservation and management (Samuel et al. 1985).
The studies of habitat use consider the environment where animals conduct their activities (Litvains et al. 1996). This depends on the interaction of various environmental and ecological factors that affect habitat quality, being unique for each species, influenced by dietary requirements and rest and shelter areas, as well as by seasonality, which often involves the adoption of a number of strategies for the use of spaces (Tellería 1986; Bello et al. 2002; Guzmán-Lenis and Camargo-Sanabria 2004; Noss et al. 2003).
In particular, otters live in areas that meet certain requirements, including a wide riparian vegetation and an adequate vegetation cover (Colares and Waldemarin 2000a; Gori et al. 2003; García Botello and Quintana 2005), since in the river banks they carry out activities such as rest, marking of territory, cleaning of fur, and breeding of offspring (Chanin 1985; Kruuk 1995). Similar to most mammal species, Lontra longicaudis is sensitive to drastic alterations in the habitat, to the degradation of river bank environments and to pollution of water bodies; hence, it is considered as an indicator of the degradation of aquatic ecosystems (Lodé 1993).
Leopold (1959) mentions that otters are not abundant in Mexico, and given the high economic value of its fur, it is not uncommon that their populations decline under excessive hunting, because the species has a low reproductive potential (one to two offspring per female). Currently, the otter is included in the threatened category in Mexican laws according to NOM-059-SEMARNAT-2010 (SEMARNAT 2010), so that the current status of the otter in the country should be considered in order to design appropriate management strategies aiming to its conservation. In addition, this species is included in CITES Appendix I (CITES 2016), and in the Red List of threatened species in the near threatened category (Rheingantz and Trinca 2015).
Particularly, records on the presence of otters in the state of Durango are scarce. Baker and Greer (1962) mention that local inhabitants have seen otters in the same river where this research was conducted (San Diego river), although downstream. Servín et al. (2003) reported the presence of otters in Arroyo El Alemán, municipality of Súchil, through the tanned fur of an animal hunted on 2 January 1994; also, Charre-Medellin et al. (2011) found excreta along the Mezquital river bank but did not determine the abundance of otters in this site.
A successful management and conservation of otters requires establishing the distribution and abundance of this species (Ruiz-Elm et al. 2001). Therefore, the aim of this work is to characterize the habitat of the otter and estimate its population abundance in the upper part of San Diego River, in order to determine if otter relative abundance depends directly on the characteristics of the habitat or if the otter population fluctuates between seasons or throughout the year.
Materials and Methods
Study area. The work was conducted in Quebrada de Galindo, located at ejido Adolfo Ruiz Cortinez (sic), municipality of Pueblo Nuevo, Durango, Mexico, specifically on the upper part of San Diego river (23.737° N, -105.298° W), located in southwestern Durango at a mean altitude above sea level of 1,760 m for segment 1, 1,770 m for segment 2, and 1,692 m for segment 3 (Figure 1). The main climate types are temperate subhumid and semi-cold subhumid (Garcia 1981). The vegetation in the upper portions is composed of mixed forest dominated by the genera Pinus and Quercus, while river banks include riparian vegetation composed of trees of the genera Salix, Populus, Bursera, Lysiloma and Pithecellobium.
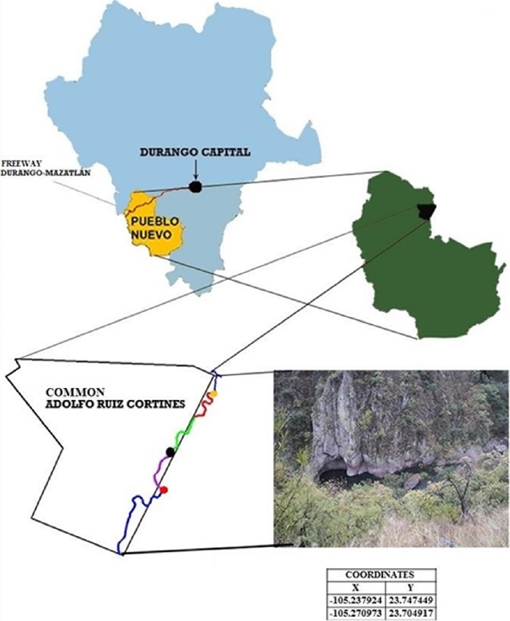
Figure 1 Location of the study area in San Diego River (23.737° N and -105.298° W), Durango, Mexico.
Characterization of the otter habitat. Through monthly visits, eight kilometers of the river were sampled for two years (2012 - 2013). These were divided into three segments of identical length (2.6 km), as preliminary visits revealed that these had distinctive physical and environmental characteristics. In each segment, an area comprising the flow zones to study, lentic (pools) and lotic (rapids), was located. These flow zones were selected as preliminary visits revealed a greater amount of excreta on the banks of pools relative to rapids; hence, one objective was to determine the potential relationship of water flow with otter presence or absence. In addition, food availability (fish) for otters was sampled in pools and rapids along the three river segments to explore whether this parameter was related to the presence of excreta.
In each flow zone, water physicochemical parameters (pH, temperature, dissolved oxygen and total dissolved solids) were recorded using a YSI 556 MPS multi-parameter probe once per season of the year: spring (March, April and May), summer (June, July and August), fall (September, October and November) and winter (December, January, February). In addition, the river width and depth were measured with a 15-m flexometer; the depth was measured by dropping the flexometer to the bottom and reading the tape at the water mirror (Macías-Sánchez 2003). In each segment, a 5 m-wide strip was sampled from the edge of the river to the forest on each side of the river, the tree and shrub species present in the area were identified whenever possible (Ruiz-Olmos et al. 1998). To determine which flow zone (pools or rapids) had the highest amount of fish, a sampling was conducted with a seine net (“chinchorro”) in each segment and flow zone once a month; these values were used to calculate the mean fish catch in each flow zone (Macías-Sánchez 2003).
Otter relative abundance. The rocks and fallen trees used as latrines by otters were identified during trips. A latrine was defined as any component of the habitat that showed at least one otter feces. For each latrine, its geographical position (latitude and longitude) was recorded with a Garmin GPS; the number of feces found, which were removed at each sampling, considering only those that were either recent or dry but complete (i. e., well-formed and not disintegrated).
The number of feces and latrines were used to calculate three otter relative abundance indices for each river segment according to Macias-Sánchez (2003), considering: 1) the number of feces divided by the total kilometers traveled (NE); 2) the number of latrines divided by the total kilometers traveled (NL); and 3) the number of feces divided by the defecation rate and total kilometers traveled (AN). We used the defecation rate estimated by Gallo-Reynoso (1996), i.e. three defecations per day, based on two female otters in captivity (Macías-Sánchez 2003). The comparison in the number of feces between segments and between months (January to December) was carried out using a completely random single-factor analysis of variance (Zar 1999).
Relationship between otter abundance and habitat variables. A multinomial logistic regression was applied using the program SPSS Statistics 21, to obtain a model and determine the relationship of otter population abundance with habitat variables (water physicochemical parameters and area) used for the habitat characterization (Johnson and Wichern 2002). To incorporate the vegetation variable to the statistical analysis, categorical values were assigned to the presence of vegetation on the river banks by segment; in the case of the second segment the value assigned was zero since vegetation was scarce in the steep mountain slopes. Average fish caught were compared between flow zones using a single-factor analysis of variance (Zar 1999).
Results
Habitat characterization. The first segment (Figure 2a) was characterized by a shallow channel ranging between 0.7 m and 1.3 m depth in river rapids and between 1.6 m to 2.2 m in pools. Winter was the season with the lowest temperature, which fluctuated between 9.5 °C and 13.2 °C. The pH was acid in pools of this segment, ranging between 4.34 and 6.45, dissolved O2 varied between 8.98 to 12.25 mg/l, and total dissolved solids ranged from 0.059 g/l to 0.109 g/l. High (45 m) but separate mountain walls, with minimum and maximum end-to-end distances of 4 m and 17 m, respectively, bordered this river segment (Table 1). The dominant tree species observed along the channel in this segment were the genera Pinus, Arbutus, Juniperus, Quercus, and some Salix bonplandiana specimens. Two otter dens were observed on the river banks in strategic locations. These areas were protected by the local relief, namely a rocky outcrop protruding from the edge of the channel into its center, serving as a barrier against upstream rising waters; vegetation that accumulated in the pool downstream to the outcrop served as protection for otters to build their dens.

Figure 2 Outlook of the San Diego River habitat in the first segment (a), second segment (b), and third segment (c).
Table 1 Physicochemical variables of water per season and segment for the two years of sampling (2012 - 2013) in San Diego River, Durango. Physicochemical variables of water per climatic season and segment (seg), water temperature (Tp), total dissolved solids (Ts), dissolved oxygen (Od), pH, flow zone (Zf), channel width (Ac), depth (Pf) and height of walls (Ap), slow-flowing water (pools) and fast-flowing waters (rapids).
| Station | Seg | Tp (Cº) | Ts (g/l) |
Od (mg/l) |
pH | Zf | Ac (m) |
Pf (m) |
Ap (m) |
|---|---|---|---|---|---|---|---|---|---|
| winter | 1 | 9.52 | 0.078 | 10.53 | 4.34 | pool | 12 | 1.6 | 45 |
| 1 | 14.33 | 0.068 | 12.25 | 6.45 | rapid | 14 | 0.7 | 40 | |
| 2 | 21.44 | 0.094 | 9.41 | 6.99 | pool | 6.5 | 3.7 | 30 | |
| 2 | 21.22 | 0.093 | 10.07 | 7 | rapid | 5 | 1.2 | 8 | |
| 3 | 20.39 | 0.096 | 8.18 | 5.71 | pool | 12 | 3.8 | 5 | |
| 3 | 20.30 | 0.094 | 8.61 | 5.97 | rapid | 12 | 1.5 | 0 | |
| spring | 1 | 10.60 | 0.109 | 8.98 | 4.37 | pool | 9 | 1.5 | 45 |
| 1 | 15.31 | 0.107 | 9.09 | 5.88 | rapid | 7 | 1 | 40 | |
| 2 | 28.11 | 0.099 | 9.87 | 7.06 | pool | 5.4 | 4.2 | 30 | |
| 2 | 24.23 | 0.100 | 11.14 | 7.87 | rapid | 4 | 1 | 8 | |
| 3 | 22.29 | 0.101 | 8.15 | 5.51 | pool | 12 | 3 | 5 | |
| 3 | 21.32 | 0.11 | 7.02 | 5.77 | rapid | 10.5 | 1 | 0 | |
| summer | 1 | 11.27 | 0.059 | 11.97 | 4.46 | pool | 7.7 | 2.2 | 45 |
| 1 | 15.52 | 0.081 | 9.45 | 5.69 | rapid | 8.2 | 1.3 | 40 | |
| 2 | 24.69 | 0.062 | 9.65 | 8 | pool | 7 | 6.5 | 30 | |
| 2 | 22.73 | 0.078 | 9.41 | 7.33 | rapid | 6 | 1.4 | 8 | |
| 3 | 20.99 | 0.084 | 8.33 | 5.5 | pool | 13.1 | 4.8 | 5 | |
| 3 | 21.46 | 0.092 | 8.79 | 5.39 | rapid | 14 | 1.5 | 0 | |
| fall | 1 | 13.24 | 0.067 | 10.23 | 4.68 | pool | 6 | 1.9 | 45 |
| 1 | 17.52 | 0.089 | 11.46 | 5.81 | rapid | 5 | 0.9 | 40 | |
| 2 | 23.33 | 0.078 | 9.56 | 7.06 | pool | 6.5 | 3.4 | 30 | |
| 2 | 21.89 | 0.068 | 9.37 | 7.87 | rapid | 5 | 1.2 | 8 | |
| 3 | 20.12 | 0.094 | 8.51 | 5.51 | pool | 12.3 | 4.5 | 5 | |
| 3 | 21.78 | 0.096 | 8.75 | 5.77 | rapid | 14 | 1.3 | 0 |
The second segment (Figure 2b) runs across a ravine, the bordering walls were 30 m in maximum height, separated by a distance ranging from 4 to 7 m; water depth was between 3.4 m to 6.5 m at pools and between 1 m to 1.4 m in rapids. During the sampling period, pH ranged between 6.99 and 8; dissolved O2, from 9.41 to 9.71 mg/l; and water temperature, from 21.2 °C to 28.1 °C (Table 1). This segment was characterized by absence of riparian vegetation due to the steep mountain walls, with only some species of the genera Agave and Bursera, as well as grasses that managed to survive on cliffs. A distinctive feature observed in this section that differentiated it from the other two was the presence of thermal water streams from springs located in the upper parts of the surrounding mountains and falling on the walls of rocks to reach some of the pools along this stretch of the river. No sites that were suitable for otters to build their dens like those observed in the first segment were observed in this area.
The third segment (Figure 2c) was strikingly different from the second, cliffs are not observed and river banks are suitable for riparian vegetation with species like Salix bomplandiana, Buddleja cordata, Fraxinus udhei, Prunus serotina, Populus tremuloides and Lysiloma sp, Bursera sp, Pithecellobium dulce. This area showed a wider channel, averaging 13 m from shore to shore, with a maximum depth of 4.8 m in pools and a minimum of 1.3 m in rapids; dissolved O2 ranged between 7.02 and 8.79 mg/l and total dissolved solids ranged from 0.094 to 0.11 g/l. In this segment, water temperature remained below 22.3 °C, but did not drop below 20.1 ºC, and pH ranged from 5.3 to 5.9 (Table 1). As in the first segment, an otter den was also observed.
Otter relative abundance. A total of 266 feces were recorded throughout the two years of sampling, the largest number was collected between January to May (n = 189), which corresponds to the dry season for this region; the mean relative abundance (AN) for the entire sampling period was AN = 0.46, with a confidence interval of ± 0.16 otters/km. The highest value was observed in May with 1.02 otters/km (n = 49), and the lowest in the rainy season in July and September, with AN = 0.104 otters/km (n = 5) in each month. The abundance indices NE and NL were positively related to one another over the sample period, i.e., when the number of feces increased, the number of latrines also did, and vice versa (Figure 3). The only significant differences were recorded in the number of feces in May vs. July and September (F = 2.6; P = 0.02), the latter corresponding to the rainy season. A higher number of feces (n = 108) was found in the second segment, and the lowest number of feces (n = 59) occurred in the first segment; this difference was not statistically significant (Figure 4).

Figure 3 Relationship between mean monthly rainfall and abundance of the otter Lontra longicaudis annectens in the two years of sampling (2012 to 2013) in San Diego River. Number of feces per kilometer of river (NE), number of latrines per kilometer of river (NL), and the number of otters per kilometer of river (AN).

Figure 4 Mean number of feces of the otter Lontra longicaudis annectens per segment (seg) of San Diego River, Durango, Mexico (mean ± standard deviation) in the two years of sampling.
Habitat-abundance relationship. A model to predict otter abundance based on the habitat physicochemical variables was derived (Ab). Ab = -0.2542 - 0.023 (T) + 21.724 (Ts) + 0.082 (Od) + 0.433 (pH) - 1.028 (Zf) + 0.058 (Ac) - 0.308 (Pr) - 0.035 (Vr).
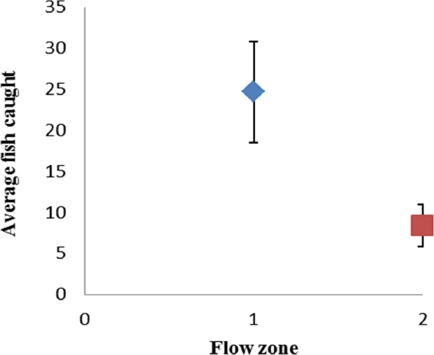
This model indicates that as water temperature (T) rises, otter relative abundance decreases; the opposite is true in relation to dissolved solids (Ts), dissolved oxygen (Od) and pH, i. e., abundance rises as the values of these variables increase. On the other hand, there is a higher otter relative abundance in pools and shallow areas (Zf), where the channel is not narrow (Ac) and riparian vegetation (Vr) is scarce. Significant differences were found between flow zones regarding the presence of fish (F = 5.35; P = 0.03), with the highest number of specimens observed in pools (Figure 5).
Discussion
Habitat characterization. The habitat of the Neotropical otter in the study area coincides with the description by Casariego-Madorell et al. (2008), who found that the pH of water ranged between 6 and 7 in Ayuta River, state of Oaxaca. Mason and Macdonald (1987) found that otters (Lutra lutra) in a Welsh region were absent in areas where water pH decreased to 5.5; on the other hand, Macias-Sánchez (2003), when sampling Los Pescados and Actopan rivers, in the state of Veracruz, mentions that dissolved oxygen ranged from 7.6 to 9.5 mg/l and from 8.5 to 9.5 mg/l, respectively. Garcia and Quintana (2005) highlight the preference of otters for clean water with high dissolved oxygen levels in the low delta of the Paraná River, Argentina. In this study, the pH in the first segment was mainly acid (4.34 and 6.45), possibly because there was abundant decaying matter in some of the pools along this stretch of the river; in contrast pH was close to neutral in the other segments, above all in the second segment. Otter abundance dropped in the first segment, which showed similar pH values to those recorded in the study by Mason and Macdonald (1987).
The total dissolved solids measured in this study were lower compared with those reported by Mayor-Victoria (2008) in Río Roble, Colombia, where this author reported two values: 0.371 and 0.403 g/l, but mentions that these values were high likely because the readings were taken in the rainy season, when the river was very turbulent. This same author mentions that the river width was between 15 and 30 m; in the study reported here, the third segment displayed the widest channel, 13 m on average, relative to the other two segments, which showed a narrower channel bordered by steep walls, above all the intermediate segment.
Macias-Sánchez (2003) found that water temperature increased downstream, while lower temperatures were reported in the upper portions (Los Pescados river: 27-21 °C max.-min.; Actopan river: 25 to 24°C max-min). Casariego-Madorell et al. (2008) recorded a mean temperature of 25.7 °C in Ayuta River, Oaxaca, while average water temperatures were 24.4 °C and 26. 2 °C in Copalita and Zimatán rivers, respectively; these values are similar to those measured in the second and third segments ( = 22.9 ºC), no like that the first segment upstream ( = 6.67 ºC).
On the other hand, Casariego-Madorell et al. (2008) mention that the vegetation on the banks of Copalita and Ayuta rivers was formed mainly by species of the families Bignoniaceae and Leguminosae (species with a more tropical affinity than the genera Pinus and Quercus identified in this work); only the species Pithecellobium dulce coincides with those found in this study. This author also mentions that, in general, the portions sampled of the study rivers had walls not exceeding five meters high, with Ayuta River being shallow for the most part, and with a moderate current in both seasons of the year. This resembles to some extent our findings in the first segment, since the depth in this stretch of the river was similarly low, with pools of up to 1.3 meters in depth. The Zimatan river displayed boulders up to 5 m in height where there was little vegetation, composed primarily of Cactaceae (succulent species). In this work, the second segment had pools of up to 6.5 m in depth, very similar to what is mentioned by the last author, where vegetation was poor and was also represented by succulent species (genus Agave). A major difference is the condition of walls bordering the river, which were considerably higher than the five meters reported by the authors, reaching up to 45 m in height in some portions.
As regards the sites where utter dens were found, our observations match those reported by Arellano-Nicolas et al. (2012) who mention that dens were located in areas with dense riparian vegetation and rocky walls, representing conditions that are suitable for the establishment of otter dens. In this study, otter dens were observed in the first and third segments, which showed a higher abundance of riparian vegetation and rocky outcrops ideal for the protection of the vegetation.
Otter relative abundance. The mean relative abundance of 0.46 otters/km recorded in this work differs from the figures reported by Macias-Sánchez (2003) of two and six otters/km in Los Pescados and Actopan rivers, Veracruz, but were similar to 0.34 otters/km determined by Gallo-Reynoso (1996) for the Yaqui river, Sonora, and to 0.43, 0.21 and 0.52 otters/km reported by Arellano-Nicolas et al. (2012); however, the latter authors reported 1.22 otters/km for the rainy season, while in this study the figure of 1.02 otters/km was recorded for the dry season, specifically in May. Santiago-Plata et al. (2013) also found higher values in the huracane season (1.12 tracks/km) versus the dry season (0.70 tracks/km), but agree that tracks decreased in the rainy season in general relative to the other two seasons (dry and huracane). On the other hand, Casariego-Madorell et al. (2008) also found a larger number of feces in the period between October and March, at the end of the rainy season and in the dry season; Duke-Dávila et al. (2013) also reported a higher abundance in the dry season compared to the rainy season. These findings coincide with the findings in this work, probably because the river flow does not increase in the dry season, preventing feces from being removed, washed away or dispersed by water when the river level rises (Aranda et al. 1980).
On the other hand, González-Christen et al. (2013) in lake Catemaco, Veracruz, Mexico, found significant differences in the abundance of otters between the four segments sampled; although otter abundance was not compared between segments, these authors calculated the differences in number of feces by segments and no significant differences emerged. However, significant differences were found between November, December, and January throughout the study (F = 5.96; P = 0,001); in this work, significant differences were found in the number of feces between a dry month (May) and two months of the rainy season (July and September). On the contrary, Santiago-Plata et al. (2013) in Laguna de Terminos, Campeche, Mexico, did not find significant differences (H = 1.6; P < 0,446) in the number of tracks observed between climate seasons, but significant differences were observed (H = 4.96; P < 0,026) in the number of tracks per collection zone.
Otter relative abundance and habitat. The model showed an acceptable fit statistics, and the most significant variables were total dissolved solids, pH, flow zone and depth. Casariego-Madorell et al. (2008) indirectly found a relationship between abundance and dissolved oxygen, with otter abundance tending to be higher in zones where dissolved oxygen was also higher; in this study a positive, relationship between dissolved oxygen and otter abundance was also observed, but it did not reach statistical significance. On the other hand, Botero-Botero (2013) mentions that the otter in La Vieja river basin, Colombia, inhabits in rivers of medium-sized and large flows; additionally, this author observed a low positive correlation between otter abundance and channel width ( = 0.241; P = 0.0001), and depth ( = 0.218; P = 0.0001). This same author noted a low inverse correlation between abundance and current velocity ( = -0.238; P = 0.001).
In this work, the relationship between channel width and otter abundance was also positive, as opposed to depth, with which a negative relationship was observed, and one may assume that the otter prefers rapids where depth does not exceed 1.5 m. However, when the flow zone variable was analyzed, it was noted that the higher abundance occurred in pools. Therefore, shallow ponds could be considered the zones with the highest otter abundance for having slow-flowing water, hence agreeing with the negative relationship between abundance and current velocity reported by the author mentioned above. Our findings are similar to those reported by Lopez-Martin et al. (1998) in Bergantes River, Spain, where Lutra lutra uses low-flowing stretches and deep pools, where food and shelter are available in the dry season. Hence, the physicochemical characteristics of water likely reflect the abundance and availability of fish, as well as their probability of being captured in turbid waters relative to very clear waters.
With regard to the abundance-vegetation relationship, authors such as Colares and Waldermarin (2000b), Gori et al. (2003), García and Quintana (2005), Mayor-Victoria and Botero-Botero (2010) and Arellano-Nicolas et al. (2012) found a positive relationship between otter abundance and the areas with the highest plant cover. In this study, the model indicated that abundance was negatively related with the zones with the greatest abundance of riparian vegetation. However, this difference is likely due to the fact that the areas with the highest otter abundance were located in the second segment, which had the ideal characteristics as feeding grounds for otters (deep pools with greater abundance of fish), so that a higher number of tracks would be expected in these areas. Prenda and Granado-Lorencio (1996) report that the number of feces is not necessarily related to the abundance of animals, but may be related to the intensity of habitat use; accordingly, some areas may be used largely for specific activities such as feeding.
Gallo-Reynoso et al. (2016) mention that otter latrines are used as “information centers”, to where the individuals of a given sector of the river go to mark and sniff out feces, urine and gels (gelatinous secretions from anal glands that apparently indicate the reproductive status) of other individuals. From the hormones in these excretions, otters identified in olfactory terms other individuals in the area and their reproductive status, whether they are in a lactating status, are adults or juveniles. Sometimes the location or physical position of latrines are independent of the presence of vegetation, deep pools or feeding areas.
In conclusion, the relative abundance of otters in the section of San Diego River sampled, lies within the range of values mentioned in other works; likewise, the local habitat agrees in most of its characteristics with those described for other areas of the country. However, since the study area is located in the limits of the altitudinal range of the species, it is necessary to further the studies on the conditions of the habitat and their relationship with otter abundance along the river. This will make possible to better understand the ecology of otters and develop environmental and social conservation strategies (environmental education) needed to preserve the otter in San Diego River, Durango.

