


 nova página do texto(beta)
 Inglês (pdf)
 Artigo em XML
 Referências do artigo
 Enviar este artigo por email
 Citado por SciELO
  Similares em
SciELO
Similares em
SciELO 
 Permalink
Introduction
The processes that govern the existence and formation of species assemblages have been a recurrent discussion topic in evolutionary ecology (Diamond 1975; Connor and Simberloff 1979; Bowers and Brown 1982, Gotelli and Ellison 2002), raising the questiont of whether the species assemblages (in a broad sense, a phylogenetically related group within a community; see Fauth et al. 1996) are formed at random, or, on the contrary, are determined by biotic and abiotic processes (Arita 1997; Adams 2007). Various authors (Diamond 1975; Bowers and Brown 1982; Patterson 1999; Adams 2007; Gotelli and Ellison 2002) have suggested that the patterns of species coexistence within an assemblage, at the regional and continental levels, do not occur at random but are determined by certain general patterns or “assemblage rules”. These rules would favor the co-occurrence of certain species at the local level, or would eventually determine the morphology (for example, the arrangement of sizes) through interspecific competition dynamics (Willig and Moulton 1989; Gotelli and Ellison 2002). As a result, species within some highly diverse communities will display a relatively uniform organization across a size gradient (Willig 1986; Arita 1997; Adams 2007); as a result, morphologically similar species within a trophic guild are unlikely to occupy the same habitat (Bowers and Brown 1982).
As suggested in other studies, interspecific competition may affect morphological patterns through changes in either the organization of sizes or the adjustment of sizes (Bowers and Brown 1982; Willig and Moulton 1989). In the former case, the probability of persistence of a species within an assemblage decreases by the presence of morphologically similar species, while the latter refers to evolutionary changes in a morphological feature of the involved species to minimize competition (Willig and Moulton 1989). In both cases, an in-depth understanding of the role of competition has been restrained by various methodological issues, in particular the determination of the belonging to ecological guilds and the construction of statistically null assemblages (Arita 1997). For example, it has been indicated that the organization or adjustment of sizes could only act at the assemblage level when competition is sufficiently intense and prevalent at the local level (Willig and Moulton 1989).
If the morphology of an organism is considered as part of an environmental mold, we could describe such morphology and understand the ecological role of this species within the assemblage (Ricklefs and Travis 1980; Willig 1986). Multivariate analyses have been used to describe and compare the spatial clustering of species, by representing these within a hyperdimensional Euclidean space, to estimate the ecological structure within the assemblage (Findley 1975; Ricklefs and Travis 1980; Freeman 1981; Willig 1986; James and McCulloch 1990; Arita 1997; Peres-Neto et al. 2003). In general, morphometric characters are usually easier to obtain (often from museum specimens or even from publications), simple to estimate, highly replicable, independent of the structure of the habitat, and adequately correlated with resource use (Pizzimenti and De Salle 1980; Ricklefs and Travis 1980; Freeman 1998). In addition, if morphology is not directly related to ecology, multivariate analyses can unveil patterns that are explained based on a theoretical, ecological and evolutionary context (Ricklefs and Travis 1980; Willig 1986).
In the present study, we used a Principal Components Analysis (PCA) to determine the relative importance of variables with respect to each component (Crisci and Lopez-A 1983; James and McCulloch 1990), and use it as an approximate description of the relationships between the units of study (Peres-Neto et al. 2003), or between their ecological roles, if these are determined by the original variables (Pizzimenti and De Salle 1980; Ricklefs and Travis 1980). If such a pattern does exist and is adequately represented in the variables chosen, the major components of the regional and local analyses would be expected to show similar loads for most variables (Ricklefs and Travis 1980; Peres-Neto et al. 2003).
To assess these patterns, this study focuses on cricetid rodents of the Western, Central and Eastern cordilleras of Colombia. Previous studies (Lopez-Arevalo et al. 1993; Gómez-Valencia 2006; Muñoz-Saba et al. 2000; Otarola 2003; Sánchez et al. 2004; Viancha-Sánchez et al. 2012; Sánchez-Giraldo and Díaz-Nieto 2015) agree that the local richness of rodents reaches an average between 9 and 11 species in 8 to 10 genera, and that composition varies according to elevation and geographic region. At the regional scale, more intensive studies in the Andes of Venezuela (Soriano et al. 1999) and Ecuador (Voss 2003) report 10 and 9 genera of rodents, respectively. Although these studies suggest a regional pattern in these assemblages, the morphometric relationships between organisms within these are not analyzed, which would be key in the process of organization and maintenance of assemblages at the local level (Pizzimenti and De Salle 1980; Ricklefs and Travis 1980; Arita 1997). The objective of this study is to evaluate the similarities and differences between local rodent assemblages from morphometric analyses, using craniodental variables of specimens to infer potential patterns of ecological interrelationship between species. In this way, it could be established whether the relationships between morphometry and coexistence provide evidence of assemblage structuring patterns, for example through a regular arrangement of sizes or shapes among species (Pizzimenti and De Salle 1980; Ricklefs and Travis 1980; Arita 1997).
Materials and Methods
Data collection. We measured specimens deposited in the Colección Teriológica of the University of Antioquia, Colombia, collected from the Andean region (Central and Western Cordilleras), between 2002 and 2014. Some localities were pooled together to avoid losing information for specimens whose specific localities contained low representativeness in terms of number of species. To this end, we took into account that the pooled localities belong politically and/or geographically to the same region, from the 2008 map of the Antioquia regions (available at http://www.zonu.com/detail/2011-08-23-14446/Regiones--de-Antioquia-2008.html), thereby gathering as much information as possible (Table 1). For example, Bello and Girardota were pooled together (Aburrá Norte), while Jardín-Támesis and La Mesenia (both in the Municipality of Jardín) were kept separated for being located in different mountain ranges. In this way, the analyses are based on these regional units (Figure 1).
Table 1 Rodent species included in the analysis with their respective numbers of localities and specimens.
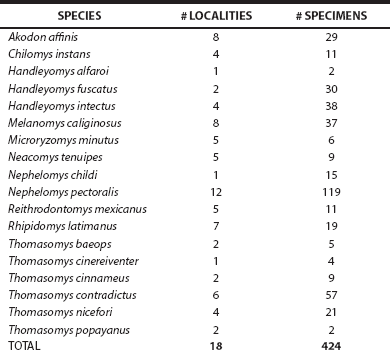
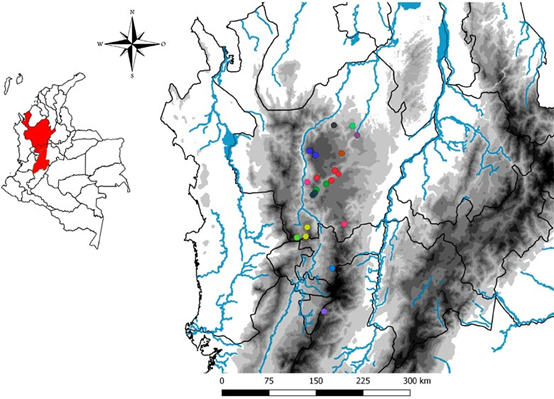
Figure 1 Map of the municipalities in the departments of Antioquia, Caldas and Tolima that included sampling localities for the specimens used in morphometric analyses.
Taxonomic identification was performed using keys (Weksler and Percequillo 2011; Patton et al. 2015), descriptions (Voss et al. 2002; Pacheco 2003; Percequillo 2003; Voss 2003; Weksler 2006) and reference material from the same collection and the Field Museum of Natural History (Chicago, USA).
Morphological and Morphometric Analyses. We recorded 15 homolog cranial measurements for all specimens (adult males and females), following the specifications of Patton et al. (2000) and Voss et al. (2001). These measures sought to highlight morpho-functional aspects, for example as regard chewing, or resource selection (see Pizzimenti and De Salle 1980; Giménez and Giannini 2011). The measures employed were: condyle-incisor length (CIL), zygomatic width (ZW), mastoid width (MW), minimum interorbital constriction (MIC/LIB), rostral length (RL), nasal length (NL), rostral width (RW), orbital length (OL), diastema length (DL), molarrow length (ML/LM), incisive-foramen length (IFL), palatal bridge length (PBL), alveolar width (AW), mesopterygoid fossa width (MFW), and zygomatic plate width (ZPW/BZP). Measurements were taken with an electronic caliper to the nearest 0.01 mm, and using a stereoscopic microscope in the case of measures requiring greater precision.
Statistical Analyses The original data were log-transformed (log10; using the program PAST) to reduce biases associated with the different magnitudes of variables, approaching a normal distribution of the data (Ricklefs and Travis 1980; Jackson 1993); then a variance-covariance matrix was obtained (James and McCulloch 1990). This matrix was used to conduct a Principal Components Analysis (PCA) to elucidate the variability of variables (characters), measured in terms of their factorial coefficients (loads). In this analysis, eigenvalues represent the sum of the variances of variables for each component, used for determining which components are more important (Jackson 1993); the components with the largest eigenvalues were used to be represented graphically.
In this way, the PCA was used as a screening tool (Norman and Streiner 1996) for the set of all localities (regional analysis), as well as for some localities evaluated individually (local analyses), to allow a comparison between components and their basic parameters, such as eigenvalues, percentages of variation and factorial coefficients. In order to confirm the reliability when choosing the appropriate components in the overall PCA, a ‘bootstrap’ resampling of 1000 repetitions was conducted (Jackson 1993; Peres-Neto et al. 2003). In addition, it is also expected to organize the variation related to any individual variable. That is, if two or more variables are summarized by the same component, this will indicate that these share similar co-variation patterns, leading to a better interpretation of the relationship (Peres-Neto et al. 2003). Finally, the values of the first principal components (which represent the greatest variance of the data) are shown in scatter plots obtained with the PAST program (Paleontological Statistics version 3.04; Hammer et al. 2001).
Results
Number of species and individuals per locality. A total of 424 specimens of Andean rodents were recorded, belonging to 10 genera and 18 species of the family Cricetidae (Sigmodontinae): Akodon, Chilomys, Handleyomys, Melanomys, Microryzomys, Neacomys, Nephelomys, Reithrodontomys, Rhipidomys and Thomasomys (Figure 2), of which Thomasomys, Handleyomys and Nephelomys were the most diverse ones, with six, three and two species, respectively, while the rest recorded a single species each. The genus with the largest number of individuals was Nephelomys with 134 specimens, followed by Thomasomys with 98 specimens. The least represented genera were Neacomys and Microryzomys, with 9 and 6 specimens, respectively (Table 1).
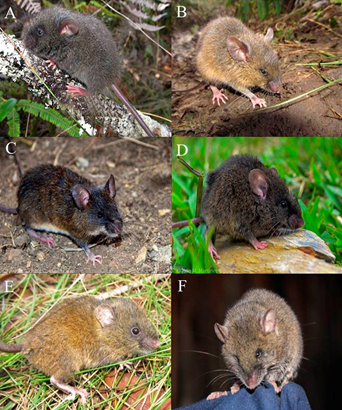
Figure 2 Some of the species recorded in the sampling of Andean rodents. Top row, Chilomys instans (A), Nephelomys childi (B); middle row, N. pectoralis (C), Handleyomys fuscatus (D); bottom row, Thomasomys cinnameus (E), and T. cinereiventer (F).
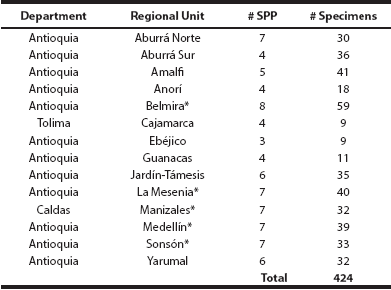
The specimens analyzed were obtained from different localities in the departments of Antioquia, Caldas and Tolima (Table 2), Antioquía being the most important one for its larger number of localities. On the other hand, the comparisons between assemblages were conducted using five localities that showed a high representativeness of individuals and species (see Table 2), as the availability of individuals was restricted in some localities where samples were not rigorous or species were rare. This sampling at different localities and formations allows a reliable approximation of the regional assemblage, as well as an additional level of analysis in the comparison of the relevance of the morphological variables included.
Table 2 Geographical origin of specimens and number of species (# SPP) and individuals in each locality. The asterisk indicates the localities selected for the individual analysis.
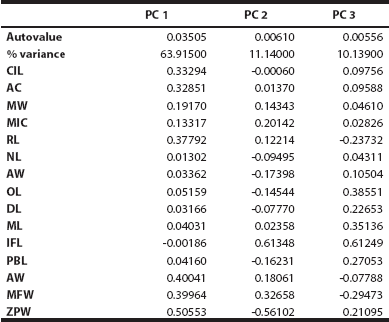
Principal Components Analysis (PCA). The general PCA reveals that the first three components account for 85.2 % of the total variation, with 63.9 % for CP1, 11.1 % for CP2 and 10.1 % for CP3 (Table 3). This same table shows quantitatively the values of the loads contributed by variables to each component; the most important variables for CP1 were ZPW, AW, and MFW (all with a positive load); for CP2 were IFL, ZPW (negative load) and MFW; and for CP3 were IFL, OL and ML (all with a positive load).
Table 3 Table of the factorial coefficients associated with the first three components of the analysis of total assemblages. Autovalues and the percentage of variance represented by each component are shown. The acronyms used are indicated in the Methodology section.
A scatter plot shows 75.1 % of this variation (Figure 3), which, together with the characterization of the principal components CP1 and CP2 along with the contribution of the different variables (Table 3), corresponds to the analysis of the regional pattern of the Andean rodent assemblage throughout the study area, providing a reference point for analyzing individual assemblages.
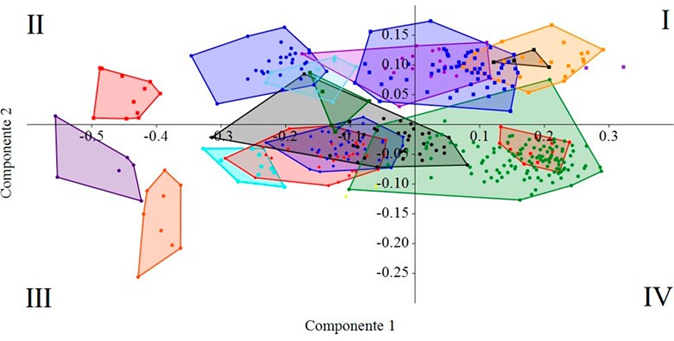
Figure 3 Scatterplot of species in the hyperdimensional space represented by CP1 and CP2 for the total data. Color polygons identify the clustering patterns of species; symbols and colors correspond to: A. affinis = blue dot, C. instans = light blue dot, H. alfaroi = yellow diamond, H. fuscatus = red diamond, H. intectus = blue diamond, M. caliginosus = black dot, M. minutus = índigo dot, N. tenuipes = orange dot, N. childi = red dot, N. pectoralis = green dot, R. mexicanus = red square, R. latimanus = dark purple dot, T. baeops = green square, T.cinereiventer = black square, T. cinnameus = light blue square, T. contradictus = blue square, T. nicefori = dark orange square, T. popayanus = purple-blue square.
The arrangement of clusters of species (Figure 3) allow defining some morphometric groups based on their limited or null overlap in the space defined by components 1 and 2. These would correspond to: (A) small and delicate, located in quadrant III (M. minutus, N. tenuipes, and R. mexicanus); (B) small, in quadrant II (A. affinis, R. latimanus, T. baeops, and T. cinnameus); (C) medium-sized, in quadrant III (C. instans, H. alfaroi, H. fuscatus, H. intectus, and M. caliginosus); (D) large and delicate, quadrants I and II (T. cinereiventer and T. contradictus); and (E) large, in quadrants I (T. nicefori and T. popayanus) and IV (N. childi and N. pectoralis). To help differentiate these patterns, Figure 4 shows some skulls of representative species within each morphotype.
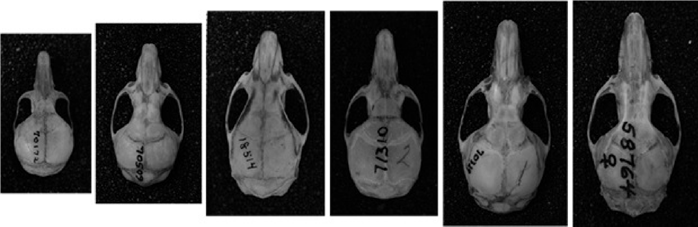
Figure 4 Representative skulls of the morphotypes identified in PCA. From left to right: Reithrodontomys mexicanus (group A), Handleyomys alfaroi (group B), Melanomys caliginosus (group C), Thomasomys cinereiventer (group D), Nephelomys childi (group E-IV), and Thomasomys nicefori (group E-I). All skulls are shown at the same scale; the bar at the far right is equivalent to 20 mm.
On the other hand, to analyze the representativeness of the observed patterns (morphogroups), analyses were performed with the data from individual localities that showed the higher richness in terms of species and number of individuals. These were: Belmira (8 spp., 59 specimens), La Mesenia (7 spp., 40 specimens), Medellín (7 spp., 39 specimens), Sonsón (7 spp., 33 specimens), and Manizales (7 spp., 32 specimens).
Belmira. This locality, in the Central Cordillera (6.7072° N, -75.6888° W) and with elevations between 2,900 and 3,050 m, included a total of eight species that represented five of the morphogroups defined above: (A) M. minutus, R. mexicanus, (B) A. affinis, T. baeops, T. cinnameus, (D) T. contradictus, (E-I) T. nicefori, and (E-IV) N. pectoralis. The PCA reveals that the first three components account for 94.2 % of the variation; this value is partitioned into 86.4 % for CP1, 4.8 % for CP2, and 3.0 % for CP3. Figure 5a presents the morphospace determined by the first two components.
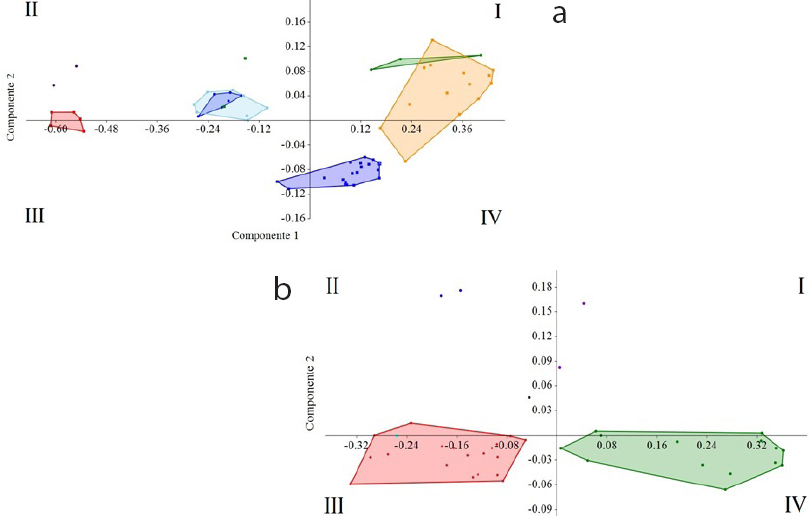
Figure 5 Scatterplot of the species recorded in some local assemblages shown in the hyperdimensional space represented by CP1 and CP2. Symbols and colors are as in Figure 3. (a) Belmira, Central Cordillera, (b) La Mesenia, Western Cordillera.
La Mesenia. Located in the Central Cordillera (5.5254° N, -75.9294° W) and with elevations around 2,350 m; seven species were recorded, representing five of the morphogroups defined above: (B) A. affinis, R. latimanus, (C) H. fuscatus, M. caliginosus, (D) T. cinereiventer, (E-I) T. popayanus, and (E-IV) N. pectoralis. In the PCA for this locality, the first three components account for 91.8 % of the variation: 82.0 % for CP1, 6.2 % for CP2, and 3.6 % for CP3. The scatter plot determined by the first two components is shown in Figure 5b.
Medellin. Located in the Central Cordillera (6.2082° N, -75.6480° W) with elevations above 2,300 m; seven species were recorded, representing all the morphogroups previously defined: (A) M. minutus, (B) A. affinis, (C) H. intectus, M. caliginosus, (D) T. contradictus, (E-I) T. nicefori, and (E-IV) N. pectoralis. The PCA reveals that the first three components account for 94.4 % of the total variation: 84.6 % for CP1, 6.9 % for CP2, and 2.9 % for CP3.
Sonsón. Located in the Central Cordillera (5.7182° N, -75.2469° W) and with elevations above 2,050 m; seven species were recorded, representing all the morphogroups defined above: (A) N. tenuipes, (B) R. latimanus, T. cinnameus, (C) C. instans, (D) T. contradictus, (E-I) T. nicefori, and (E-IV) N. childi. This PCA reveals that the first three components account for 95.6 % of the variation: 82.9 % for CP1, 9.1 % for CP2, and 3.5 % for CP3.
Manizales. Located in the Central Cordillera (5.0838° N, -75.4230° W) and with elevations of 2,550 m; seven species were recorded, representing all the morphogroups defined above: (A) R. mexicanus, (B) A. affinis, T. baeops, (C) C. instans, (D) T. contradictus, (E-I) T. nicefori, and (E-IV) N. pectoralis. The PCA for this locality indicates that the first three components account for 92.7 % of the variation: 83.3 % for CP1, 5.3 % for CP2, and 4.1 % for CP3.
Discussion
In general, among the local assemblages of high-Andean rodents of Antioquia, a species arrangement model can be seen where there are differences in the size and shape of the species (skull morphometry), a pattern that can be corroborated in the scatter plots (Figures 3, and 5), as well as in the analysis of loads (factorial coefficients) of the relevant variables for each component. With regard to the first aspect, cricetids are characterized by morphotypes associated with different trophic niches (Pizzimenti and De Salle 1980), many of which are presented in this analysis and are distributed across the space defined by the first two main components. This separation was further evidenced when local communities were analyzed, with the few species (seven to eight) being segregated in a differential way between the various assemblages (Figure 5).
When the presence of these six morphogroups was analyzed, as defined by the PCA at a regional scale, it is evident that there is zero to minimal overlap in the morphometric space between species at the local scale, although this is also a consequence of a lower representativeness in the number of species (with a maximum of eight in Belmira and La Mesenia). However, it is remarkable that all morphogroups occur in the localities with fewer species (seven). It should be noted that the majority of these morphogroups do not correspond to taxonomic divisions, and that these divisions do not behave as a single unit with regard to morphology.
However, in the scatter plot of the regional assemblage this pattern should not be interpreted in a manner similar to the local one, since the inclusion of the whole sample in a single analysis results in the overlap between species within the same morphogroup (e. g., N. childi and N. pectoralis; Figure 3). Since some authors (Pianka 1973, Gotelli and Ellison 2002; Adams 2007) point to that a wide competition would not be favored in natural assemblages, this co-occurrence would indicate that other factors are acting at the level of that assemblage. However, as recorded in our sampling and other studies (Percequillo 2003), these two species are not sympatric. In contrast, sympatry may occur in some cases, such as in Belmira with T. baeops and T. cinnameus (Figure 5a), which would indicate that additional factors would be offsetting the potential competition (for example, character displacement).
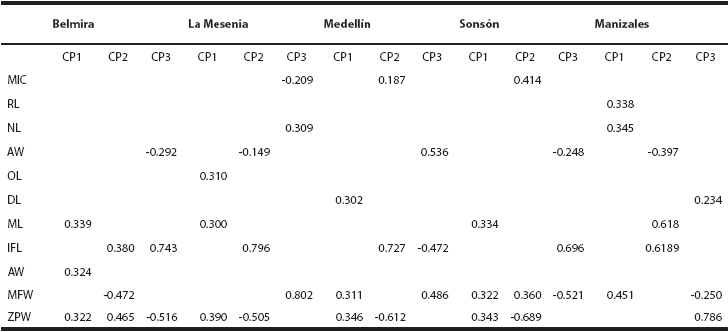
Among the variables analyzed, there are five (ZPW, MFW, IFL, ML and RW; Table 4) that account for most of the variation in the overall analysis and the individual analyses, while at the same time, four others (CIL, ZW, MW and PBL) did not contribute significantly in any PCA of these localities (therefore, these are not shown). In this way, the arrangement of morphometric variables would allow inferring an ecological separation of species, as evidenced in the morphogroups identified. Although these variables are not directly related to size as such, these could play a key role in the segregation of resources between species from an anatomical point of view (Landry 1970), determining muscular insertions (ZPW) or passage of food to the digestive tube (MFW). In a study of the rodent Peromyscus zarhynchus, Lorenzo et al. (2006) suggest that morphometric differences between geographical populations seem to be influenced by the variation in the type of food available in these areas. Gould (1966) mentions that evolutionary allometry represents real temporal changes of ratios within a genetic continuum; due to the relationship between these shape, ecological segregation can function as a mechanism favoring differences between species of the same genus, even before promoting geographical isolation. Further studies with a greater emphasis on ecomorphological aspects could unveil the role of these variables in the segregation between species. Likewise, other aspects should also be considered, such as diet at the local level (see Pizzimenti and De Salle 1980; Giménez and Giannini 2011), selection of specific microhabitats (Vitt et al. 2000), and evolutionary relationships between species, to understand the dynamics and organization of these assemblages.
Table 4 Summary of the variables with the three largest loads in the first three principal components (CP1, CP2, CP3) of the five individual analysis. The acronyms used are indicated in the Methodology section.
Although the procedure of combining localities that are geographically close allowed to obtain some interesting approximations, in the long term it is recommended to include only localities with sufficiently comprehensive sampling to elucidate the complex of rodents inhabiting these Andean forests. Methodologically, combining undersampled localities can lead to further error in the analysis, or may confound the actual assemblage patterns. For example, localities such as La Mesenia (Western Cordillera) or Belmira (Central Cordillera) have comparable numbers of species and individuals, revealing patterns not only regarding presence but also abundance, which would be more informative to raise additional questions to this study.
Localities sampled evenly can also contribute to the knowledge of geographic patterns for species, which in many cases show discontinuities not attributable to any geographical or ecological barrier. For instance, we found that N. pectoralis was collected in four of the five individual localities, but its distribution is interrupted by its sister species N. childi, which was recorded only in Sonsón. In other cases, there are species that do not occur in both cordilleras, outlining a biogeographical exclusion pattern (Voss et al. 2002; Pacheco 2003; Percequillo 2003). Such is the case of some species of Thomasomys; for example, T. popayanus and T. cinereiventer in the Western Cordillera; and T. baeops, T. contradictus, T. cinnameus, and T. nicefori in the Central Cordillera. However, the lack of sampling rigor precludes the detection of a real pattern, since there are rare species that can only be captured in specific microhabitats or after intense sampling (Sánchez-Giraldo and Díaz-Nieto 2015).
In addition, there are still information gaps on the ecology of high-Andean rodents in Colombia, especially regarding diet-related topics (Montenegro-Díaz et al. 1991; Lopez-Arevalo et al. 1993; Solari 2007), which considerably reduces the resolution power of this approximation. Likewise, we must take into account the restricted distribution of some of the species included in the analyses. For example, the genera Handleyomys, Nephelomys and Thomasomys show pairs of similar species with an allopatric distribution (Voss et al. 2002; Pacheco 2003; Percequillo 2003). However, this gap is likely influenced also by their taxonomic closeness, making it difficult to find species with very similar morphology in the same locality (Bowers and Brown 1982, Gotelli and Ellison 2002).
These fundamental factors influence assemblage rules, so it was not possible to demonstrate a structure that is maintained from the regional scale to that of local assemblages. Besides, the geographical isolation of the various assemblages may result in different combinations of species and particular relationships within the morphometric space. In this sense, although ecomorphological analyses are an effective tool for understanding the assemblages and organization in a community (Pizzimenti and De Salle 1980; Ricklefs and Travis 1980; Arita 1997; Moreno et al. 2006; Giménez and Giannini 2011), these were not conclusive in this particular case. However, this first approximation shows the usefulness of regional studies to understand patterns of species diversity and replacement, which should be supplemented by analyses of ecological aspects such as diet composition, microhabitat, foraging strategies, and periods of activity (Bruseo and Barry 1995; Arita 1997; Vitt et al. 2000) to interpret the coexistence of various species in a local assemblage.

