


 text new page (beta)
 English (pdf)
 Article in xml format
 Article references
 Send this article by e-mail
 Cited by SciELO
  Similars in
SciELO
Similars in
SciELO 
 Permalink
Introduction
Whittaker et al. (2005, p. 4) defined conservation biogeography as "the application of biogeographical principles, theories, and analyses, being those concerned with the distributional dynamics of taxa individually and collectively, to problems concerning the conservation of biodiversity". Although biogeographic patterns have been used as criteria for area prioritization, many of them are limited to current patterns (such as species richness), but evolutionary patterns are, in general, missing (Luna-Vega et al. 2010).
Two main criteria are used to incorporate evolutionary approaches: 1) taxonomic distinctness or phylogenetic diversity, and 2) geographic distributional patterns (Vane-Wright et al. 1991; Posadas et al. 2001; Faith et al. 2004). On one hand, phylogenetic diversity is a measure of the "uniqueness" of taxa, which allows ranking areas for conservation on the basis of information encoded in phylogenies (Posadas et al. 2001). On the other hand, endemic taxa (as traditionally defined, those confined to political divisions or micro-areal) have been included as surrogates in Systematic Conservation Planning (SCP; Margules and Sarkar 2007) considering that their persistence requires immediate conservation actions. However, inclusion of endemic taxa does not guarantee the representation of overall species diversity (Bonn et al. 2002). Other approaches, such as phylogenetic endemism, have been used more recently (Rosauer and Jetz 2014).
An alternative view considering endemism as a pattern of geographical distribution, rather than restricted to political entities may also be used as a surrogate in SCP. In this concept, taxa restricted to natural units are recognized as endemic, and areas of endemism are diagnosed by shared distributional boundaries of two or more endemic species (Morrone 1994, Morrone and Escalante 2009). A pattern of endemism is expected to be repeated by several taxa (Morrone 2001), such that the prioritization of areas of endemism would allow the conservation of evolutionary processes (e. g., speciation and adaptation). However, areas of endemism are not commonly used in prioritization strategies (v. gr. Méndez-Larios et al. 2005).
The Mexican Mountain Component (MMC; Morrone and Márquez 2003) is inhabited by several endemic species. The MMC encompasses the main mountainous systems in Mexico, and has high geological and environmental complexity, including six biogeographical provinces (Morrone and Márquez 2003; Escalante et al. 2005): 1) the Sierra Madre Occidental in the west, 2) the Sierra Madre Oriental in the east, 3) the Transmexican Volcanic Belt of central Mexico, 4) the Balsas basin south of the Transmexican Volcanic Belt, 5) the Sierra Madre del Sur in south-central Mexico, and 6) Chiapas in the south of the country. The MMC is also known as the Mexican Transition Zone (MTZ; Halffter 1962, 1964; Escalante et al. 2005), and for some authors, it is controversial the inclusion of the Balsas basin and Chiapas provinces within it (see Morrone 2005).
Recent studies of Mexican mammals indicate that the distribution patterns of 24 endemic mammals match the pattern of MMC provinces (Aguado-Bautista and Escalante 2015; Escalante et al. 2005, 2007, 2009; Morrone 2005). Insects (Halffter 1987), plants (Andrés et al. 2006), and birds (Navarro-Sigüenza et al. 2007) exhibit similar patterns of endemism and rarity in Mexican mountains. As such, endemic species of mammals may represent adequate biodiversity surrogates for the conservation of the MMC. Mammals have been used as model taxa in several studies focusing on biogeography and conservation (Morrison et al. 2007; Eklund et al. 2011; Redford et al. 2011), and have been utilized specifically as biodiversity surrogates (see Lewandowski et al. 2010; Cantú-Ayala et al. 2013).
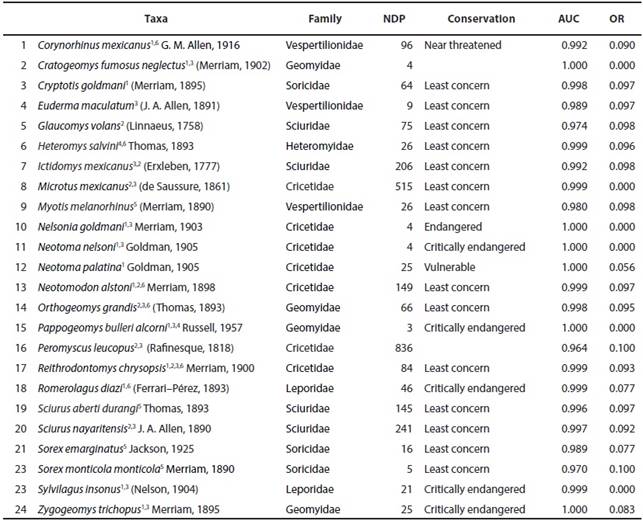
The mountain ecosystems of the MMC have been previously shown to be highly relevant for conservation (Cantú-Ayala et al. 2013; Suárez-Mota and Téllez-Valdés 2014). In addition, recent cartography of land use and vegetation (INEGI 2013a; http://www.inegi.org.mx/geo/contenidos/recnat/usosuelo/, consulted 01/12/2014) suggests that the MMC is an area with a high coverage change in the last years. Some endemic mammals of the MMC tend to be micro-areal (with ranges, as small as a few square kilometers) and rare (with low frequency of occurrence), and are consequently often catalogued under risk categories (Table 1; SEMARNAT 2010; IUCN 2014). In addition, climate change could result in extinction of mammalian endemic species in the mountainous areas of Mexico (Ponce-Reyes et al. 2012; Aguado-Bautista and Escalante 2015).
Table 1 Endemic mammal taxa of the Mexican Mountain Component, including number of data points used in models and their conservation status. References: 1Escalante et al. (2005); 2Morrone (2005), 3Escalante et al. (2007); 4Escalante et al. (2009); 5Ceballos (2014); not registered as endemic, but with distribution restricted to the MMC); 6Aguado-Bautista and Escalante (2015). Number of data- points (NDP). ; Conservation status* (Conservation); AUC value training (AUC); Omission rate training (OR)*NOM059-SEMARNAT-2010 (Semarnat, 2010) and Red List de la International Union for Conservation of Nature (IUCN, 2013) (http://www.iucnredlist.org; consulted 12/12/2013).
One of the main instruments of the environmental politics in Mexico is the system of protected natural areas (PNA), which includes 176 federally protected areas (SEMARNAT 2014; http://www.conanp.gob.mx/que_hacemos/, consulted 29/01/2014). In general, it has been demonstrated that PNA tends to be effective to prevent land use/land cover change (LUCC; Sánchez-Cordero and Figueroa 2007; Figueroa et al. 2011), making them an important consideration in prioritization exercises.
Here, our aims were twofold. We use patterns of endemism in mammals to: 1) prioritize conservation sites in the MMC, and 2) evaluate the current system of natural protected areas in Mexico, under the assumption that areas of endemism reflect sites whose protection conserves evolutionary processes.
Materials and methods
Mexico has a high richness of mammal species (496 species, Ramírez-Pulido et al. 2014), 38 of which are restricted to the MCC (Escalante et al. 2005). We based our analysis on small body- sized mammals endemic of the MMC (Escalante et al. 2005, 2007, 2009; Morrone 2005; Ceballos, 2014; Aguado-Bautista and Escalante 2015), whose taxonomy and distribution is considered well understood (e. g., Halffter 2004). As such, analyses were based on 24 species and subspecies (Table 1). The taxonomic nomenclature was based on the Mammals of Mexico List by Ramírez-Pulido et al. (2014) and the proposal of Fernández et al. (2014) for the families Geomyidae and Heteromyidae. The analyzed species include two rabbits, three bats, three shrews, four pocket gophers, four squirrels, and eight rats and mice. Five of these species are listed as critically endangered and one as endangered by the IUCN Red List of Threatened Species (IUCN 2014; Table 1).
We obtained 2,961 occurrence records for the 24 mammals (Table 1) from the "Biogeographic atlas of the terrestrial mammals of North America" (Escalante and Rodríguez-Tapia 2011; Escalante 2013; http://www.atlasbiogeografico.com/, consulted 25/06/2013). This database is available directly from the authors. The map of the MMC was obtained from Arriaga et al. (1997) and modified based on the provinces outlined by Morrone and Márquez (2003) and Escalante et al. (2005).
We modeled the distribution of the 24 species and subspecies using Maxent 3.3 (Phillips et al. 2006; Phillips and Dudík 2008). Two topographic attributes of the region (altitude and slope) and 19 environmental variables (http://www.edc.usgs.gov/products/elevation/gtopo30/hydro/namerica.html; http://www.worldclim.org, consulted 25/06/2013; Hijmans et al. 2005) were used as potential predictors of species distribution at a 1 km2 spatial resolution. Distribution model extent included all of Mexico. For species with ≥10 records, 75 % of the records were used to construct the model and 25% to validate it; for species with less than 10 records, the entire set of records was used for both model training and testing (Hernandez et al. 2006; Pearson et al. 2007). For all species, MaxEnt was executed using the following settings: 20 replicates, replicate bootstrap type, 1000 maximum iterations and convergence threshold of 1.0 E-5. The distributional model of each species was derived from the average model. All the distributional models were evaluated using the area under the receiver operating characteristic curve (AUC), considering scores greater than 0.9 as adequate (Table 1).
In order to define the threshold of environmental suitability for species, we employed the 10 percentile value of training sample points (see Escalante et al. 2013) in R-Studio ver. 3.0.1 (R Development Core Team 2013; http://www.r-project.org, consulted 05/08/2013). This value assumes that 10 % of the records used for model generation are susceptible to error. In order to incorporate the historical dimension of geographical space available for species (Soberón 2010), the distributional model of each species was cropped using the MMC polygon.
To prioritize the areas, we used Maxent2ConsNet (Ciarleglio 2008) and ConsNet v. 2.0 (Ciarleglio et al. 2009; http://www.uts.cc.utexas.edu/~consbio/Cons/consnet_home.html, consulted 13/09/2013). There are two algorithms for area selection: area minimization problem and representation maximization problem. Area minimization problem selects a set of cells with the minimum total area required for all surrogates to meets its assigned target; representation maximization maximizes the expected number of surrogates that meet their targets within a maximum total area (Margules and Sarkar 2007).
We performed several prioritization exercises using different algorithms, targets of representation for surrogates, and layers of information about PNA and land use change (LUCC). Each different exercise is called a "problem" in ConsNet. After many trials, we decided to perform only one exercise for the representation maximization problem algorithm and several for the area minimization problem algorithm. The advantages of the minimum area problem include its wide use, ease of understanding and implementation, excellent ability to drive search results, and lack of potential for failure (Ciarleglio et al. 2009; Hamel and Andréfouët 2012). Performed prioritization problems are shown in Table 2. All vectorial maps (shapefiles) were obtained from INEGI at a scale of 1:1,000,000 and in Lambert Conformal Conic projection: PNA ("Área Natural Protegida"; INEGI 2013b; http://www.inegi.org.mx/geo/contenidos/recnat/geologia/infoescala.aspx), roads ("Carretera"; INEGI 2013c; http://www.inegi.org.mx/geo/contenidos/topografia/topografia_1m.aspx), cities ("Localidad Urbana"; INEGI 2013d; http://www.inegi.org.mx/geo/contenidos/topografia/topografia_1m.aspx), and land use and vegetation ("Serie V"; INEGI 2013a; http://www.inegi.org.mx/geo/contenidos/recnat/usosuelo/). Maps were re-projected and rasterized to 1 km pixels, to coincide with the extent and the 24 species distribution models of surrogates.
Table 2 Prioritization problems performed in ConsNet 2.0. PNA = protected natural areas; LUCC = land use/ land cover change; CR = cities and roads. Target of representation, % of the each surrogate to be protected (Target); Permanently included cells (Permanently IN); Permanently excluded cells (Permanently Ex).
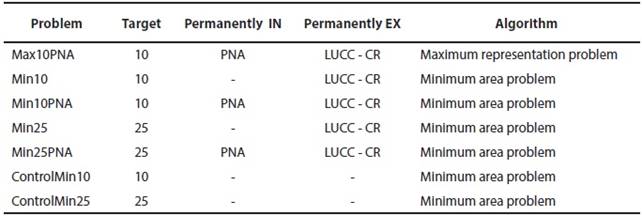
The 42 MMC PNA were used in some problems as permanently included cells, in order to evaluate the representation of surrogates within them. LUCC was incorporated by specifying agricultural areas (including crops and pastureland), cities, and roads (considering all roads of two or more lanes and a buffer of 5 km along them; Cuervo-Robayo and Monroy-Vilchis 2012). Because our aim relates to conservation, for all problems, cells representing LUCC were permanently excluded, except for two problems used as controls, assuming a situation with no land modifications (Table 2). Additionally, we used two different conservation targets for surrogates: 10 % and 25 % of their distributional area. These targets were chosen following international goals for protected areas, as we have not analyses of population viability to calculate area sizes ensuring species persistence. However, some studies of mammals in Mexico predict a linear relationship between targets and prioritized area (Justus et al. 2008). The initial solutions were constructed through Rarity First, applying the RF4 adjacency algorithm (Ciarleglio et al. 2009, 2010; Nori et al. 2013). All problems were run with 1,000,000 iterations and standard neighborhood selection.
We used the following nomenclature to specify problems: Max: representation maximization problem; Min: area minimization problem; Control: solutions with no cells excluded or included; 10: target of 10 % of representation of surrogates; 25: target of 25 % of representation of surrogates; PNA: problem including the existent PNA. For example, Min10PNA refers to a solution using the area minimization problem algorithm, at 10 % of target of representation of surrogates, using PNA as permanently included cells, and excluding areas with LUCC (Table 2).
Because the best solutions will have more area with low fragmentation and high connectivity, the best solutions will be those that minimize the border effect (Fahrig 2003; Kurosawa and Askins 2003, Fletcher et al. 2007). We therefore evaluated all solutions based on their total area, perimeter, shape, number of pixels and clusters, proportion of coincidence with PNA, and they were compared between them.
Results
The best solutions for each problem are shown in Table 3 and Figures 1 a-f. Comparisons of prioritized areas for each problem and PNA are shown in Table 4 and Figures 1 h-m. The best solution for Max10ANP did not reach the conservation target for any surrogate, despite having the best relation for shape. For this reason, we decided not to use this algorithm to continue the prioritization (Table 3). For shape evaluation, the Control's result problems were the best solutions (shape values closer to 0 represent less fragmentation. The representation of 25 % of each surrogate requires almost three times more area than the 10 % goal and leads to less fragmentation (Table 3).
Table 3 Results of prioritization problems for mammals of the MMC (Problem); Area in km2 ; Perimeter in km2; Shape, perimeter-area ratio (Shape); Number of selected cells (Selected cells); Number of satisfied targets (Satisfied targets); Number of clusters (clusters).
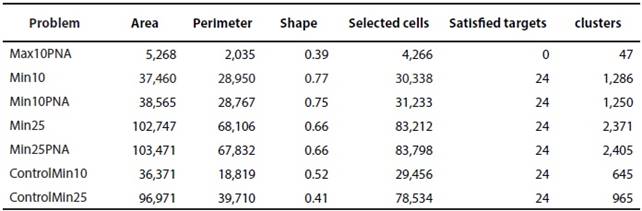

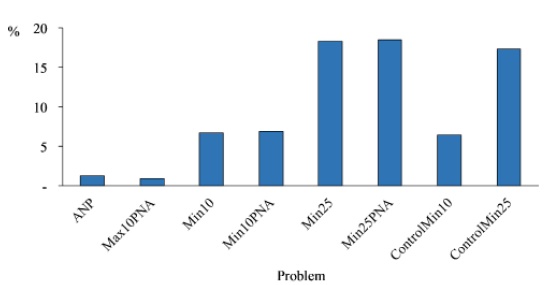
Figure 1 Maps show the pixels prioritized in the Mexican Mountain Component (MMC). A) Best solution for the ControlMin10 problem (a problem is an exercise of prioritization under particular conditions, see Table 2). B) Best solution for the ControlMin25 problem. C) Best solution for the Min10 problem. D) Best solution for the Min25 problem. E) Best solution for the Min10PNA problem. F) Best solution for the Min25PNA problem. G) Comparison between prioritized areas for the ControlMin10 problem and the protected natural areas (PNA). H) Comparison between prioritized areas for the ControlMin25 problem and the protected natural areas (PNA). I) Comparison between prioritized areas for the Min10 problem and the protected natural areas (PNA). J) Comparison between prioritized areas for the Min25 problem and the protected natural areas (PNA). K) Comparison between prioritized areas for the Min10PNA problem and the protected natural areas (PNA). L) Comparison between prioritized areas for the Min25PNA problem and the protected natural areas (PNA). M) Percentage of MMC area occupied by the best solutions of all the minimum area problems, including the PNA and Max10PNA.
Table 4 Comparisons of prioritization problems for mammals of the MMC. Area (km2) intersected (Area); % represented of the PNA (% PNA); Area (km2) exclusive of each problem wit-hout PNA (Area without PNA); Area (km2) of PNA (Area PNA).
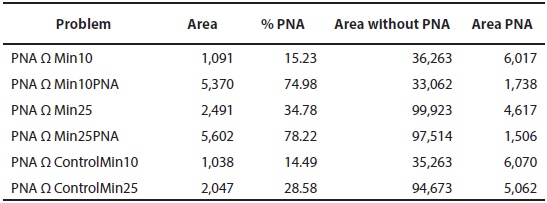
Comparing among the best solutions of the Min problems with PNA, we observed that only around 15 % of PNA area coincides with Min10 and Control10 (Table 4). This means that the existing PNA are not sufficient to maintain at least 10 % of the distributional area of endemic mammals. It would be necessary to include more than 35,000 km2 to reach this conservation target. For Min25 and Control25 the projection is similar; they include only 30 % of the areas currently designated as PNA (adding almost 100,000 km2). For Min10ANP and Min25ANP the percentage of coincidence with PNA is more than 70 %; they do not reach a higher percentage because there are excluded cells of altered vegetation, even within the PNA (Table 4).
The total MMC area occupied by our solutions is shown in Figure 2. For Min10 and Min10PNA, almost 7 % of the area of MMC is prioritized for conservation, while for Min25 and Min25ANP it is above 18 %. The respective control solutions are similar. The Max10PNA and only PNA have the lowest percentage of area.
Discussion
Choosing the best solution to prioritize MMC areas for endemic mammals is no an easy task. In a world without LUCC, the best solutions would clearly be those that minimize perimeter-area ratios (see ControlMin10 and ControlMin25), but LUCC-free areas no longer exist. On one hand, because larger perimeter-area ratios generate high edge effect, we prefer to use the problems considering current PNA, even though those solutions imply larger surface (for example, the difference between Min10 and Min10PNA is around 2,000 kilometers). On the other hand, Max10PNA problem was the worst solution because it does not reach the conservation targets of endemic mammals, even though it had the lowest ratio. Additionally, the proposal of a target of 25% would be probably not be economically, politically and socially viable, since this target may imply high cost and is likely to affect productive activities like forestry. Therefore, we suggest that the best scenario to prioritize areas of conservation for endemic mammals in the MMC is the Min10PNA.
The solution for the Min10PNA allows the conservation of more than 18,000 km2 of mountain areas above 2,400 m of elevation (corresponding to nearly 50 % of the prioritized area). The majority of the Min10PNA prioritized area is located in the Sierra Madre Occidental province (35 % of prioritized total area), followed by the Transmexican Volcanic Belt (30 %), and the Sierra Madre del Sur (11 %). Using the Min10PNA, the rarest and most distributionally restricted species (the volcano rabbit or"teporingo", Romerolagus diazi), is conserved in 62 % of its distributional area, which is of interest since it is critically endangered (Table 1).
There are some exercises of prioritization of areas in Mexico, but not for the MMC. Fuller et al. (2007) warned about the cost of postponing conservation actions in Mexico. They prioritized areas using the minimization problem and a target of 10 %, obtaining similar areas for the MMC, although they used a different concept of endemism. For southern Mexico, Urbina-Cardona and Flores-Villela (2010) prioritized areas for the herpetofauna, many of them in mountain areas coinciding with our southern MMC; however, their concept of endemism did not consider sympatry. Illoldi-Rangel et al. (2012) performed a multi-criterion analysis in order to prioritize areas for Mexican species of Opuntia; they concluded that all plans would require around one-third of Mexican territory and high connectivity. However, we think that decisions about connectivity should be considered with caution, since each biogeographic province has its own evolutionary history and excessive connectivity may force the joining of areas and biotas with different histories which are naturally disjoint.
For the Transmexican Volcanic Belt province, some prioritization exercises have been performed (Sánchez-Cordero et al. 2005; Fuller et al. 2006; Suárez-Mota and Téllez-Valdés 2014). For example, Fuller et al. (2006) proposed a network of protected areas for 99 species of mammals, based on an algorithm of rarity, complementarity, and connectivity. These authors coincide with the fact that the current system of protected areas does not adequately represent biodiversity. Suárez-Mota and Téllez-Valdés (2014) agree that it is necessary to include areas in conservation priorities not considered in the current PNA. Also, there are other prioritization exercises for particular areas in Mexico, which partially covered the MMC (v. gr. Illoldi-Rangel et al. 2008).
Mountainous areas for conservation that has been prioritized based on other criteria coincide with our findings. For example, an area with high phylogenetic endemism for mammals was identified in Central Mexico, possibly associated with high elevation and topographic complexity (Rosauer and Jetz 2014). The cloud forest of Chiapas should be protected because it could decline dramatically by 2080 (Ponce-Reyes et al. 2012), although, in fact, all of southeastern Mexico requires special attention (Cantú-Ayala et al. 2013). In addition, the vulnerability of endemic species of mountainous areas could be high for some areas of endemism, such as the Transmexican Volcanic Belt, the East District, Soconusco and the MTZ (Aguado-Bautista and Escalante 2015).
It would be necessary to quantify in detail the congruence among our proposal and all other approaches in order to obtain a more robust proposal to present to stakeholders. In addition, the incorporation of land costs will be a strong determinant to implementing any conservation plan for the MMC (v. gr. Fletcher et al. 2013); similarly, vulnerability studies should be incorporated. Moreover, it is necessary to evaluate the current system of protected areas, in particular with respect to their effectiveness for maintaining ecosystems facing the effects of climate change and LUCC (v. gr. Figueroa et al. 2011; Ponce-Reyes et al. 2012). Finally, concepts of endemism as a biogeographic pattern should be standarized to generate a more integrated general approach (see Noguera-Urbano 2016).
Patterns of endemism can provide adequate surrogates for SCP. The current system of PNA is shown to be insufficient to conserve the distributional areas of 24 endemic mammals of the MMC. A strategy based on prioritizing areas using the solution that considers the area minimization problem with a target of 10 % of distribution of the endemic mammals as surrogates, including PNA and other areas, and excluding altered vegetation, can help to maintain the distributional patterns of endemism of the Mexican biota. However, comparisons with other prioritization exercises are necessary in order to propose an efficient and effective system of protected areas in Mexico.

