SciELO - Scientific Electronic Library Online

 
vol.6 número3Mamíferos terrestres de un humedal en la cuenca del río Usumacinta, Tabasco, MéxicoFototrampeo de mamíferos terrestres de talla mediana y grande asociados a petenes del noroeste de la península de Yucatán, México índice de autoresíndice de assuntospesquisa de artigos
Home Pagelista alfabética de periódicos  

Serviços Personalizados

Journal

Artigo

Indicadores

Links relacionados

  • Não possue artigos similaresSimilares em SciELO

Compartilhar


Therya

versão On-line ISSN 2007-3364

Therya vol.6 no.3 La Paz Set. 2015

https://doi.org/10.12933/therya-15-304 

Artículos especiales

Potential distribution of the ocelot ( Leopardus pardalis) in Northeastern Mexico

Distribución potencial del ocelote ( Leopardus pardalis) en el noreste de México

Jesús Manuel Martínez-Calderas1 

Octavio C. Rosas-Rosas1 

Jorge Palacio-Núñez1  * 

Juan Felipe Martínez-Montoya1 

Genaro Olmos-Oropeza1 

Luis A. Tarango-Arámbula1 

1Colegio de Postgraduados, Campus San Luis Potosí. Iturbide 73, Salinas de Hidalgo 78620. San Luis Potosi, México. E-mail: biologo99mx@yahoo.com.mx (JMM-C), octaviocrr@colpos.mx (OCR-R), jpalacio@colpos.mx (JP-N), fmontoya@colpos.mx (JFM-M), olmosg@colpos.mx (GO-O), ltarango@colpos.mx (LAT-A).


Abstract:

INTRODUCTION:

The ocelot (Leopardus pardalis) is a Neotropical cat which is threatened by illegal hunt and habitat destruction in the Mexican territory. Mexican and American authorities are interested in promoting their conservation. The MaxEnt algorithm allows modeling the potential distribution of elusive species, for instance, the ocelot. This has been based on trustable presence records and some other information about the habitat condition. This work was developed with the aim of generating important information about the species in Northeastern Mexico, especially, with the purpose of determining its potential distribution.

METHODS:

Our study was conducted in six physiographic subprovinces in the Mexican states of Tamaulipas and San Luis Potosí. Sixty-trhee recent records about the ocelot were obtained, 41 through literature and 22 from field surveys , between May 2006 to May 2009. In order to develop a prediction model which let us know the animal potential distribution, twenty-seven bioclimatic, topographic, vegetation and anthropic variables were used through the MaxEnt software.

RESULTS:

The model AUC was of 0.8221 ± 0.009. The most related variables about the ocelot presence were: precipitation of wettest month and quarter, vegetation cover, vegetation type, terrain elevation, precipitation of coldest quarter, terrain slope, human population density, and distance to roads. The potential distribution area overs 20.8 % of the study area. The physiographic subprovinces showing the highest potential distribution were: llanuras y lomerios (7.4 %), Carso Huasteco (4.8 %), Gran Sierra Plegada (4.5 %), and sierras and llanuras occidentales (3.4 %). The llanura costera Tamaulipeca subprovince showed lower potential distribution; meanwhile, llanuras de Coahuila y Nuevo Leon and sierras y llanuras del norte de Guanajuato were not suitable distribution for ocelot.

DISCUSSIONS AND CONCLUSIONS:

In order to obtain the ocelot potential distribution model we use recent information collected through field work and surveys. Through this, we could achieve a robust model, where were relevant both bioclimatic and landscape variables. There are patches of habitat important in size and quality for ocelot. The physiographic subprovinces with the roughest landscape were the ones where the highest presence of the species. This study complements the ocelot distributional range in Northeastern Mexico and providing important information about the habitat quality in that portion of the country, as well as the difficulty to possible connectivity between Mexico and USA.

Keywords: camera trap; field survey; huasteca region; MaxEnt; neotropical cats

Resumen:

INTRODUCCIÓN:

El ocelote (Leopardus pardalis) es un felino neotropical que se encuentra amenazado en México por la cacería ilegal y la destrucción de su hábitat. Existe interés de las autoridades de Estados Unidos y de México para conservarlo. El algoritmo MaxEnt permite modelar la distribución potencial de especies elusivas, como el ocelote, con base en registros confiables de presencia, e información sobre condiciones del hábitat. Este trabajo se realizó con la finalidad de generar información relevante en torno a esta especie en el noreste de México, así como determinar su distribución potencial.

MÉTODOS:

El estudio se llevó a cabo en seis subprovincias fisiográficas en los estados mexicanos de Tamaulipas y San Luis Potosí. Se obtuvieron 63 registros recientes; 41 a partir de literatura y 22 de trabajo de campo, entre mayo de 2006 y mayo de 2009. Para realizar el modelo potencial de distribución del ocelote se utilizaron 27 variables entre bioclimáticas, topográficas, de vegetación y antrópicas. El modelo se realizó mediante el uso del programa MaxEnt.

RESULTADOS:

El modelo AUC fue de 0.8221 ± 0.009. Las variables que mejor se relacionaron con la presencia del ocelote fueron: precipitación del mes y del trimestre más húmedos, cobertura vegetal, tipo de vegetación, elevación del terreno, precipitación del mes más frío, pendiente del terreno, densidad de población humana y distancia a caminos. La distribución potencial abarcó 20.8 % del total del área de estudio. Las subprovincias fisiográficas que mostraron la distribución potencial más alta fueron: llanuras y lomerios (7.4 %), Carso Huasteco (4.8 %), Gran Sierra Plegada (4.5 %) y sierras y llanuras occidentales (3.4 %). La llanura costera tamaulipeca mostró poca extensión con distribución potencial; en cambio, las llanuras de Coahuila y Nuevo León y las sierras y llanuras del norte de Guanajuato no presentaron evidencia de distribución para el ocelote.

DISCUSIÓN Y CONCLUSIONES:

Con el fin de obtener el modelo de distribución potencial del ocelote, se utilizó información reciente, obtenida de trabajo de campo y encuestas. Debido a lo anterior, se llegó a un modelo robusto, donde fueron relevantes variables bioclimáticas y del paisaje. Existen parches de hábitat importantes en tamaño y calidad para el ocelote. Las subprovincias fisiográficas con el paisaje más rugoso fueron las que mostraron mayor presencia de la especie. Este trabajo complementa el área de distribución del ocelote en el noreste de México y aporta información importante acerca de la calidad del hábitat, pero también sobre los problemas de conectividad entre las poblaciones de México y las de Estados Unidos.

Keywords: cámaras trampa; felinos neotropicales; MaxEnt; región Huasteca; trabajo de campo

Introduction

In Mexico, there are six species of wild felids: puma (Puma concolor), bobcat (Lynx rufus), jaguar (Panthera onca), ocelot (Leopardus pardalis), jaguarundi (Puma yagouaroundi) and margay (Leopardus wiedii). All of these species may be found in the Northeastern region of the country, even though the last four are mainly neotropical distributed (Hall 1981; Aranda 2005). These four are also classified as threatened species under Mexican laws (NOM-059-ECOL-2010, SEMARNAT 2010). Specifically, the ocelot is an elusive and adaptable species which has been found in a gradient landscape condition: tropical and subtropical forests, temperate forests, semitropical scrub and semi desert scrub (Martínez-Calderas et al. 2011). Nevertheless, in this zone, the landscape has been fragmented (Trejo and Dirzo 2000; Reyes et al. 2007) affecting the wild populations connectivity (e. g. Wilcove 1985; Gehring 2000; Nupp and Swihart 2000). In this geographical region it may be possible to have certain connectivity between Mexican populations and southern USA populations. For this reason, both governments are interested in the feline long term conservation, by establishing corridors and priority protection areas (Haines et al. 2005). Nevertheless, there are no solid bases for such conservation, since just a study are focused on potential priority areas and biological corridors. Grigione and Mrykalo (2009) worked in the American state: Texas, New Mexico and Arizona, as in the Mexican states of Tamaulipas, Nuevo León, Coahuila, Chihuahua and Sonora.

In order to analyze the felids habitat, a great number of variables have been considered: vegetal cover, water sources, weather, altitude (Ortega-Huerta and Medley 1999; Harveson et al. 2004; Klar et al. 2008; Wolf and Ale 2009), human development and prey availability (Niedziałkowska et al. 2006; Doswald et al. 2007; Klar et al. 2008). One of the most effective tools that is used to predict the wild species potential distribution is the MaxEnt algorithm (MaxEnt, Phillips et al. 2006). In comparation with GARP, the other most widely used software, but this was not considered to have a high commission error (rate of false positive predictions) compared to MaxEnt answer (Peterson et al. 2007). Furthermore, Maxent, performs a better discrimination of the most significant predictive variables and has a higher precision in the results (Phillips et al. 2006). This is based on localities which have shown the presence of the species (Guisan and Zimmermann 2000; Elith et al. 2006; Hernandez et al. 2006; Pearson et al. 2007). Models generated by this algorithm predict and indicate availability of appropriate and inappropriate habitat for the species presence, generating a map which contains all this information (Phillips et al. 2006). Despite the adaptation to different and contrasting climatic conditions and types of habitats in the Northeast of Mexico, the ocelot has conservation problems due to illegal hunt, habitat destruction (López-González et al. 2003; Aranda 2005) and feasible isolation within the population. The objective of the current study was to model and identify the ocelot potential distribution in the Northeast region of Mexico, as a basis for strengthening the criteria and the establishment of priority areas and corridors necessary for its conservation.

Methods

Study area. This work was carried out in the Northeast region of Mexico, considering the entire state of Tamaulipas and the central and eastern portion of San Luis Potosí, with an extension of 119,013.7 km2 (Figure 1). The landscape was fragmented by crop fields, farmer lands, human settlements and roads. Terrain ranges from flat to rugged, meanwhile altitude ranges from 0 to 2,500 m and the annual precipitation varies from 600 to 2,500 mm (INEGI 2002a). In this region it is possible to find several physiographic subprovinces presenting great landscape variation (Cervantes-Zamora et al. 1990), each one presenting different kinds of native vegetation or land use (INEGI 2002a). The human settlements and agriculture are located mainly in intermontane valleys and other flat land areas.

Figure 1. Study area map showing the state of Tamaulipas and San Luis Potosi; physiographic subprovinces (PSP) location and ocelot records location. Abbreviations of PSP: LCNL = Llanuras de Coahuila y Nuevo Leon; LCT = Llanura Costera Tamaulipeca; LL = Llanuras y Lomerios; GSP = Gran Sierra Plegada; SLO = Sierras y Llanuras Occidentales; CH = Carso Huasteco; SLNG = Sierras y Llanuras del Norte de Guanajuato. 

Land use areas that may be associated to human activities (agricultural and urban) represent 21.8 %, meanwhile the areas designated for induced vegetation represent 13.2 %, being the most abundant. Natural areas occupy 47.1 % of the study area, where the most extensive is the desert scrub with 17.9 % (INEGI 2002a). The most important types of native vegetation are: semitropical thorn scrub, Tamaulipan thorn scrub and tropical deciduous forest. Basically, the physiographic subprovinces (PSP) of llanuras de Coahuila y Nuevo Leon are flat and dominated by induced vegetation (35.4 %) and Tamaulipan thorn scrub (33 %). The physiographic subprovince Llanura Costera Tamaulipeca is dominated by flat land with slight undulations. Here, the predominant land use is mainly agricultural and urban (35.5 %) and Tamaulipan thorn scrub (34.2 %). Llanuras y lomerios subprovince corresponds to a landscape ranging from flat to undulated; predominant land use is induced vegetation (38.7 %) and agricultural and urban (22.6 %). Gran Sierra Plegada corresponds to a karst mountain massif which shows an indefinite orientation and irregular intermontane valleys. Vegetation is constituted by tropical rain forest (34.1 %), pine-oak forest (22 %) and agricultural and urban (20.7 %). Sierras y llanuras occidentales is mainly covered by low mountains with extensive valleys and plains. Desert scrub vegetation (55.8 %) predominates, followed by agricultural and urban (18.7 %) and semitropical thorn scrub (16.9 %). The Carso Huasteco is dominated by abrupt karst mountains (north- south oriented) with intermontane valleys, agricultural and urban (17.9%), oak forest (17.5 %) and semitropical thorn scrub (17.0 %). Sierras y llanuras del norte de Guanajuato present vast mountains with extensive valleys and plains, were grasslands (39.0 %) and desert scrub (31.7 %) predominates (Table 1).

Table 1 Vegetation types and land use percentage within physiographic subprovinces on the study area. 

LCNL = llanuras de Coahuila y Nuevo Leon; LCT = llanura Costera de Tamaulipas; LL = llanuras y Lomeríos; GSP = Gran Sierra Plegada; SLO = sierras y llanuras Occidentales; CH = Carso Huasteco; SNG = sierras y llanuras del Norte de Guanajuato.

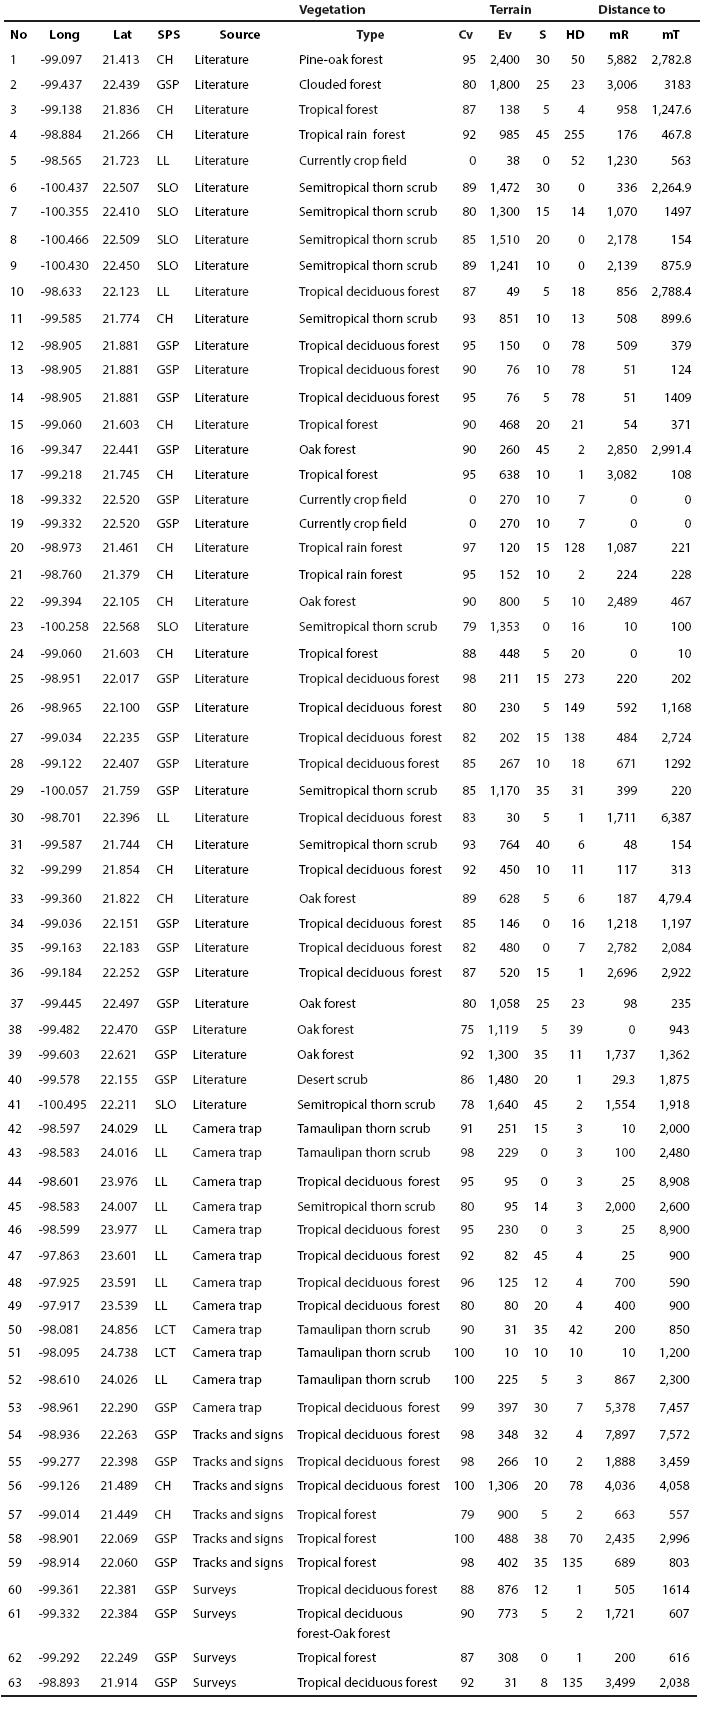
Ocelot records data and environmental predictors. The ocelot presence records (Appendix 1), as well as their geographic location were obtained through two different sources: 41 were obtained from literature (Martínez-Calderas et al. 2011), while 22 were collected through field work carried out from December 2008 to September 2010. From the last ones, 12 were obtained by using camera traps, 5 through surveys and 5 through tracks and signs. In order to make the model, 63 ocelot records and 27 variables were employed: 19 bioclimatic variables derived from WorldClim 1.4 dataset (Hijmans et al., 2005), vegetation cover (Hansen et al. 2000), vegetation type (INEGI 2005), digital elevation model (terrain elevation), topographic index, rugosity, slope (terrain slope) (INEGI 2008), distance to roads (INEGI 2002b) and human population density in the year 2000 (CIAT et al. 2005). For this purpose, a spatial 30 arc-seconds (~1 km) resolution was chosen. With the aim of minimizing the collinearity between variables, a Pearson correlation with ENM Tools 1.4 software was performed (Warren et al. 2009), selecting those with absolute value of correlation coefficients r < 0.5 (Booth et al. 1994; Rissler and Apodaca 2007; Dortmann et al. 2012).

Potential distribution modeling. In order to generate the ocelot potential distribution map we may use the MaxEnt software (version 3.3.3k) based on maximum entropy algorithm (Phillips et al. 2006). The following default settings were chosen: maximum number of background points = 10,000, regularization multiplier = 1, replicates = 20, replicate run type = bootstrap, convergence threshold = 0.00001 and maximum iterations number = 10,000. From the occurrence data 70 % (44 records) were used as training data set, while 30 % (19 records) were used as test data set. The logistic MaxEnt output presented prediction values ranging from 0 (unsuitable habitat) to 1 (optimal habitat). With the purpose of validating the model performance, omission error weight and commission error equally, were considered for the area under curve (AUC), which is generated by the algorithm (Hernandez et al. 2006) and is directly obtained from the model evaluation through ROC curves (i. e. Contreras-Medina et al. 2010).

Furthermore, the variables were assessed through a jackknife test which compares the models with all the possible combinations of environmental variables by measuring the variable importance. This expressed the relative importance of each predictor variable (in a separate way) in order to determine the percentage that each one provides to the model. Results obtained from the model (ASCII format) were processed and reclassified using ArcGIS (ESRI 2006). The binary map (absence-presence) for the ocelot potential distribution was generated (Figure 2), considering the average map that represents the induced and adjusted habitat of the species (Anderson et al. 2003; Burneo et al. 2009). For this purpose, the minimum presence training was employed as threshold reclassification (0.3575). Lastly, the map and levels were used for calculating the potential distribution area, showing the total area percentage for each SPF.

Figure 2 Potential distribution of ocelot in NE Mexico. 

Results

The calculated average training AUC for the replicate run was of 0.8221 (± 0.009), indicating a excellent model (Hosmer and Lemeshow 2000). Based on the Pearson correlation, only nine variables were employed for the model generation. The most important variables (Table 2) for the ocelot potential distribution were: precipitation (wettest month, wettest quarter and coldest quarter), vegetation cover and type, terrain elevation and slope, human population density, and distance to roads. Collectively, these variables account for 100 % of the explained variance in the species distribution. The implication of predictive variables in regards of the ocelot distribution in Northeastern Mexico was reflected in the patches preserved for species development (Figure 2).

Table 2 Relevant variables for the ocelot potential distribution map in NE Mexico. 

The ocelot potential distribution area in Northeastern Mexico covers 20.8 % of the study area. The physiographic subprovinces which presented the highest potential distribution relative to the total study area, were: llanuras y lomerios (7.4 %), Carso Huasteco (4.8 %), Gran Sierra Plegada (4.5 %) and sierras y llanuras Occidentales (3.4 %). On the other hand, llanura costera Tamaulipeca, llanuras de Coahuila y Nuevo León and sierras y llanuras del norte de Guanajuato subprovinces show a percentage of less than 0.8 % and while the last two show a percentage of less than 0.1 % (Table 3). The physiographic subprovinces which presented the highest potential distribution, relative to the each subprovince area, were: Carso Huasteco (59.9 %), Gran Sierra Plegada (36.9 %), llanuras y lomerios (22.4 %) and sierras y llanuras occidentales (16.9 %). The other physiographic subprovinces showed less than 5 %.

Table 3 Potential distribution area for the ocelot in each physiographic subprovinces of the study area. 

* Potential habitat percentage to each physiographic subprovince.

**Rtph: relative to the total area of potential distribution in the study area.

Discussion

The model which was used to generate the ocelot distribution map was robust for both model training and test confirmation, making our results reliable. In order of importance, the most significant variables were related to climate, landscape and human activities. In the case of landscape, the most important were terrain elevation, vegetation type and cover.

Based on our map, we may confirm that landscape is extremely fragmented with a heterogeneous patch distribution (size and location). Some patches are large and continuous even between adjacent physiographic subprovinces, while other appear to be small and isolated. Some physiographic subprovinces as Carso Huasteco, Gran Sierra Plegada, llanuras y lomerios and sierras y llanuras occidentales have preserved sites representing a suitable habitat for the species development. In Carso Huasteco, sierras y llanuras occidentales, llanuras y lomerios and llanura costera Tamaulipeca subprovinces the records were abundant; while in llanuras de Coahuila y Nuevo Leon and sierras y llanuras del norte de Guanajuato there were no records and ocelot potential distribution were minimal.

In our model, precipitation climatic variables during the wettest month and quarter (first and second, in order of importance) and coldest quarter (sixth in importance) presented the highest contribution to the ocelot distribution. It must be said that the kind of weather determines the most favorable habitat. Furthermore, it explains the ocelot distribution in the physiographic subprovinces where there is an appropriate habitat. Globally, this species is found in areas with predominant humid tropical climate (Vaughan 1983; Emmons 1988; Di Bitetti et al. 2006; Moreno and Giacalone 2006; Dillon y Kelly 2007); nevertheless, ocelots may be found in sub humid climates (Ludlow and Sunquist 1987; Trolle and Kerry 2003; Maffei et al. 2005). Furthermore, in its most Northern distribution of Mexico and the USA, ocelot also inhabit drier environments (Caso 1994; Martínez-Meyer 1997; Harveson et al. 2004).

Habitually, human disturbance is related to the ocelot absence. In this regard, Jackson et al. (2005) has reported that ocelots do not live in areas which present a high degree of disturbance. Several authors have mentioned that the wild felids are negatively affected by human settlements and road density (e. g. Woodroffe 2000; Cain et al. 2003; Grigione and Mrykalo 2009). The human population density in year 2000 occupied the third place in the list of variables regarding the ocelot distribution. However, we have found physical evidence of two ocelots wandering within small towns (inside a house and a yard); other four animals were seen in the vicinity. One of the reasons of the ocelot presence in small towns is represented by domestic animals and trash which is an alternative food source. In all the rural communities where ocelots were found, dense vegetation was predominant. Even so, the highest ocelot presence was found in areas showing a lower degree of disturbance.

The Carso Huasteco is a physiographic subprovinces which presents numerous human settlements; and where the largest city in the region (Ciudad Valles) is located. Nevertheless, this subprovinces represents a large proportion of areas offering suitable climate and habitat for the species. The Gran Sierra Plegada and sierras y llanuras occidentales subprovinces are less populated, maintaining a better potential distribution. In contrast, llanuras y lomerios is fragmented by settlements and occupies the third place in the potential distribution for this species. The llanura Costera Tamaulipeca is basically populated by humans and its potential distribution area is low. According to our results, the antagonistic effect of human density in regards to the ocelot presence is not clear. Possibly, it interferes with the existence of good conditions habitat patches, requiring further research. The study area still presents certain patches which show good condition.

Vaughan (1983) and Nowell and Jackson (1996) mentioned that this kind of feline prefers altitudes below 1200 m. Similar results were found where altitudinal gradients included a wide variety of habitat types (whether the habitats were suitable for ocelots or not). This species prefers habitats which present native vegetation (Nowell and Jackson 1996; Harveson et al. 2004; Aranda 2005) and dense cover (Jackson et al. 2005). High vegetation cover can improve the ocelot predatory skills, as it allows the animal to hide from its prey, especially during full moon periods (Emmons et al. 1989). In areas presenting limited vegetation cover, the ocelot is forced to use less dense areas (Caso 1994). We found continuity in potential distribution patches where this felid is well protected. Tewes and Hughes (2001) points out that roads are responsible of increasing the ocelot accidental death. Additionally, roads affect the ocelot distribution as they limit its mobility and gene flow between populations (Haines et al. 2005). Nonetheless, most of our records were located near roads.

Based on historical records from 1900 to 2002, and other opinions given by experts about biology and distribution of jaguar, ocelot and jaguarondi, it was possible to identify and delimit conservation areas of these wild felids in USA and NE Mexico (Grigione et al. 2009). However, the obtained information was not entirely accurate due to the fact that the main methodology used was "expertise opinion", which may be biased. Commonly, experts manifest contradictory or incompatible opinions resulting in inaccurate or subjective information (Bojorquez-Tapia et al. 2003). Grigione et al. (2009) points outs certain differences between the ocelot conservation areas and some other areas which represent a high potential distribution for the species. There are some contrasting results regarding the potential distribution areas in some portions. In our research, we increased the regional distribution of this species, including the central portion of the physiographic subprovince sierras and llanuras occidentales in San Luis Potosi. In Tamaulipas and San Luis Potosí, the potential distribution for the ocelot encompasses a variety of vegetation types, where dense vegetation cover is highly suitable, especially in the physiographic subprovinces Carso Huasteco, Gran Sierra Plegada and llanuras y lomerios. In the same manner, Grigione et al. (2009) identified portions of the region that may be important for long term ocelot conservation. Also, they mentioned areas with very high priority in the northeast of llanura costera Tamaulipeca. Instead, we found that this area does not have potential habitat. In addition, Grigione et al. (2009) have proposed an ocelot corridor that runs from the middle of the state of Tamaulipas northwards; however, we identified only scarce patches of potential habitat in that area.

The differences between the study Grigione et al. (2009) and ours are an example of the need for more accurate information and intensive field work, such as that undertaken in this study. However, both studies complement the distributional range of species in Northeastern Mexico and provides important information about the habitat quality in this portion of the country. In the same way, it provides information about the necessities for a correct connectivity with the southern USA populations, where now we can observe an unfavorable scenario with small and discontinuous patches. Through bi-national and long term conservation efforts, policies should be focused on minimizing the habitat loss, enhancing the habitat restoration and encouraging ecological and population studies. A key factor is to consider both the ocelot and the people needs.

Acknowledgments

We would like to thank the Consejo Nacional de Ciencia y Tecnología (CONACyT) for its partial support; the Secretaría de Desarrollo Agropecuario and Recursos Hidráulicos of San Luis Potosí, SEDARH, PRONATURA-Noreste, and Environmental Conservation for funding and supporting our research. In addition, we should thank all the staff and volunteers which were part of the project for all their help throughout field research activities.

Literature cited

Anderson, R. P., D. Lew, and A. T. Peterson. 2003. Evaluating predictive models of species distributions: criteria for selecting optimal models. Ecological Modelling 162:211-232. [ Links ]

Aranda, M. 2005. Ocelote, Leopardus pardalis (Linnaeus, 1758). Pp. 359-361 in Los Mamíferos Silvestres de México (G. Ceballos, y G. Oliva, eds.). Fondo de Cultura Económica / CONABIO. México. [ Links ]

Bojorquez-Tapia, L., L. Brower, G. Castilleja, S. Sanchez-Colón, M. Hernandez, W. Calvert, S. Diaz, P. Gomez-Priego, G. Alcantar, E. Melgarejo, M. Solares, L. Gutierrez, and M. Juárez. 2003. Mapping expert knowledge: Redesigning the Monarch Butterfly Biosphere Reserve. Conservation Biology 17:367-379. [ Links ]

Booth, G. D., M. J. Niccolucci, and E. G. Schuster. 1994. Identifying proxy sets in multiple linear regression: an aid to better coefficient interpretation. U. S. Departament of Agriculture, Forest Service. [ Links ]

Burneo, S., J. F. González-Maya, and D. Tirira. 2009. Distribution and habitat modelling for Colombian weasel Mustela felipei in the Northern Andes. Small Carnivore Conservation 41:41-45. [ Links ]

Cain, A. T., V. R. Tuovila, D. G. Hewitt, and M. E. Tewes. 2003. Effects of a highway and mitigation projects on bobcats in southern Texas. Biological Conservation 114:189-197. [ Links ]

Caso, A. 1994. Home range and habitat use of three neotropical carnivores in northeast México. MsC. Dissertation. Texas A&M University. College Station, Texas. [ Links ]

Cervantes-Zamora, Y., S. L. Cornejo-Olgín, R. Lucero-Márquez, J. M. Espinoza-Rodríguez, E. Miranda-Viquez, and A. Pineda-Velázquez. 1990. Provincias Fisiográficas de México. Clasificación de Regiones Naturales de México II, IV. 10. 2. Atlas Nacional de México. Vol. II. Escala 1:4000000. Instituto de Geografía. Universidad Nacional Autónoma de México. Ciudad de México, México. [ Links ]

CIAT (Centro Internacional de Agricultura Tropical), UNEP (United Nations Environment Program), CIESIN (Center for International Earth Science Information Network), Columbia University, and The World Bank. 2005. Latin American and Caribbean Population Data Base. Version 3. Available at http://www.na.unep.net/datasets/datalist.php3. 11 July 2014. [ Links ]

Contreras-Medina, R., I. Luna-Vega, and C. A. Ríos-Muñoz. 2010. Distribución de Taxus globosa (Taxaceae) en México: Modelos ecológicos de nicho, efectos del cambio del uso de suelo y conservación. Revista Chilena de Historia Natural 83:421-433. [ Links ]

Di Bitetti, M., A. Paviolo, and C. De Angelo. 2006. Density, habitat use y activity patterns of ocelots (Leopardus pardalis) in the Atlantic forest of Misiones, Argentina. Journal of Zoology 270:153-163. [ Links ]

Dillon, A. M., and T. M. Kelly. 2007. Ocelot radio telemetry: ocelot trap success, activity patterns, home range and density. Oryx 41:469-477. [ Links ]

Dormann, C. F., J. Elith, S. Bacher, C. Buchmann, G. Carl, G. Carré, J. R. García-Marquéz, B. Gruber, B. Lafourcade, P. J. Leitão, T. Münkemüller, C. McClean, P. E. Osborne, B. Reineking, B. Schröder, A. K. Skidmore, D. Zurell, and S. Lautenbach. 2012. Collinearity: a review of methods to deal with it and a simulation study evaluating their performance. Ecography 36:27-46. [ Links ]

Doswald, N., F. Zimmermann, and U. Breitenmoser. 2007. Testing expert groups for a habitat suitability model for the Lynx lynx in the Swiss Alps. Wildlife Biology 13:430-446. [ Links ]

Elith, J., C. H. Graham, R. P. Anderson, M. Dudik, L. G. Lohmann, B. A. Loiselle, G. Manion, C. Moritz, M. Nakamura, Y. Nakazawa, J. Overton, A. T. Mcc, A. T. Peterson, S. J. Phillips, K. S. Richardson, K. S. Scachetti-Pereira, R. E. Schapire, J. Soberon, S. Williams, M. S. Wisz, and N. E. Zimmermann. 2006. Novel methods improve prediction of species distribution from occurrence data. Ecography 29:129-151. [ Links ]

Emmons, L. H. 1988. A field study of ocelots in Peru. Revue D Ecologie-La Terre Et La Vie 43:133-157. [ Links ]

Emmons, L. H., P. Sherman, D. Bolster, A. Goldizen, and J. Terborg. 1989. Ocelot behavior in moonlight. Pp. 233-242 in Advances in neotropical mammalogy (Redford, K. H., and J. F. Einsenberg, eds.). The Sandhill Crane Press, Inc. Gainesville, EE. UU. [ Links ]

Esri. 2006. ArcGIS Desktop 9.2. Environmental System Research Institute. Redlands, EE.UU. [ Links ]

Gehring, T. M. 2000. Ecology of mammalian predators in a landscape fragmented by agriculture. Doctoral dissertation. Universidad Purdue. West Lafayette, EE. UU. [ Links ]

Guisan, A., and N. E. Zimmermann. 2000. Predictive habitat distribution models in ecology. Ecological Modelling 135:147-186. [ Links ]

Grigione, M., K. Menke, C. López-González, R. List, A. Banda, J. Carrera, R. Carrera, A. Giordano, J. Morrison, M. Sternberg, R. Thomas, and B. Van Pelt. 2009. Identifying potential conservation areas for felids in the USA and Mexico: integrating reliable knowledge across an international border. Oryx 43:78-86. [ Links ]

Grigione, M. , and S. R. Mrykalo. 2009. Effects of artificial night lighting on endangered ocelots (Leopardus pardalis) and nocturnal prey along the United States-México border; a literature review and hypotheses of potential impacts. Urban Ecosystems 7:65-77. [ Links ]

Haines, A. M., M. E. Tewes, L . L. Laack, W. E. Grant, and J. Young. 2005. Evaluating recovery strategies for an ocelot (Leopardus pardalis) population in the United States. Biological Conservation 126:512-522. [ Links ]

Hall, E. R. 1981. The mammals of North America. 2nd edition. John Wiley & Sons. New York, EE. UU. [ Links ]

Hansen, M. R. Defries, J. R. G. Townshend, and R. Sohlberg. 2000. Global land cover classification at 1km resolution using a decision tree classifier. International Journal of Remote Sensing 21:1331-1365. [ Links ]

Harveson, P., M. E. Tewes, G. Anderson, and L. Laack. 2004. Habitat use by ocelots in south Texas, implications for restoration. Wildlife Society Bulletin 32:948-954. [ Links ]

Hernandez, P. A., C. H. Graham, L. L. Master, and D. L. Albert. 2006. The effect of sample size and species characteristics on performance of different species distribution modeling methods. Ecography 29:773-785. [ Links ]

Hijmans, R. J., S. E. Cameron, J. L. Parra, P. G. Jones, and A. Jarvis. 2005. Very high resolution interpolated climate surfaces for global land areas. International Journal of Climatology 25:1965-1978. [ Links ]

Hosmer, D. W., and S. Lemeshow. 2000. Applied Logistic Regression. John Wiley & Sons. New York, EE. UU. [ Links ]

INEGI. 2002a. Síntesis de información geográfica del estado de San Luis Potosí. Instituto Nacional de Geografía e Informática. Aguascalientes, México. [ Links ]

INEGI. 2002b. Conjunto de datos vectoriales de vías de transporte y comunicación de las cartas vectoriales topográficas escala 1:250,000, Serie II, Continuo Nacional. Instituto Nacional de Estadística, Geografía e Informática. Aguascalientes, México. [ Links ]

INEGI. 2005. Conjunto de datos vectoriales de la carta de uso del suelo y vegetación, Escala 1:250,000, Serie III, Continuo Nacional. Instituto Nacional de Estadística, Geografía e Informática. Aguascalientes, México. [ Links ]

INEGI. 2008. Continuo de Elevación. Nacional. Instituto Nacional de Geografía e Informática. Aguascalientes, México. Available at http://mapserver.inegi.org.mx. 11 june 2012. [ Links ]

Jackson, V. L., L. L. Laack, and E. G. Zimmerman. 2005. Landscape metrics associated with habitat use by ocelots on south Texas. Journal of Wildlife Management 69:733-738. [ Links ]

Klar, N., N. Fernández, S. Kramer-Schadta, M. Herrmanne, M. Trinzenf, I. Büttnerf, and C . Niemitz. 2008. Habitat selection models for European wildcat conservation. Biological Conservation 141:308-319. [ Links ]

López-González, C. A., D. E. Brown, and J. P. Gallo-Reynoso. 2003. The ocelot Leopardus pardalis in north-western Mexico: ecology, distribution and conservation status. Oryx 37:358-364. [ Links ]

Ludlow, M. E., and M. E. Sunquist. 1987. Ecology and behavior of ocelots in Venezuela. National Geographic Research 3:447-461. [ Links ]

Maffei, L., A. Noss, E. Cuellar, and D. Rumiz. 2005. Ocelot (Felis pardalis) population densities, activity and ranging behavior in the dry forests of eastern Bolivia: data from camera trapping. Journal of Tropical Ecology 21:1-6. [ Links ]

Martínez-Calderas, J. M., O. C. Rosas-Rosas, J. F. Martínez-Montoya, L. A. Tarango Árambula, F. Clemente-Sánchez, M. M. Crosby-Galván, and M. D. Sánchez-Hermosillo. 2011. Distribución del ocelote (Leopardus pardalis) en San Luis Potosí, México. Revista Mexicana de Biodiversidad 82:907-1004. [ Links ]

Martínez-Meyer, E. 1997. Ecología del ocelote (Leopardus pardalis) en la región de Chamela, Jalisco, México. Dissertation. Universidad Nacional Autónoma de México. Ciudad de México, México. [ Links ]

Moreno, R., and J. Giacalone. 2006. Ecological data obtained from latrine use by ocelots (Leopardus pardalis) on Barro Colorado Island, Panama. Tecnociencia 8:7-21. [ Links ]

Niedzialkowska, M., W. Jedrzejewski, R. M. Myslajek, S. Nowak, B. Jedrzejewska, and K. Schmidt. 2006. Environmental correlates of Eurasian lynx occurrence in Poland - Large scale census and GIS mapping. Biological Conservation 133:63-69. [ Links ]

Nowell, K., and P. Jackson. 1996. Wild Cats: Status Survey and Conservation Action Plan. UICN. Gland, Switzerland. [ Links ]

Nupp, T. E., and R. K. Swihart. 2000. Landscape-level correlates of small mammal assemblages in forest fragments of farmland. Journal of Mammalogy 81:512-526. [ Links ]

Ortega-Huerta, M., and K. Medley. 1999. Landscape analysis of jaguar (Panthera onca) habitat using sighting records in the Sierra de Tamaulipas, Mexico. Environmental Conservation 26:257-269. [ Links ]

Pearson, R. G., C. J. Raxworthy, M. Nakamura, and A. T. Peterson. 2007. Predicting species distributions from small numbers of occurrence records: a test case using cryptic geckos in Madagascar. Journal of Biogeography 34:102-117. [ Links ]

Peterson, A. T., M. Papes, and M. Eaton. 2007. Transferability and model evaluation in ecological niche modeling: a comparison of GARP and Maxent. Ecography 30:550-560. [ Links ]

Phillips, S. J., R. P. Anderson, and R. E. Schapire. 2006. Maximum entropy modeling in species geographic distributions. Ecological Modelling 190:231-259. [ Links ]

Reyes-Hernández, H., M. Aguilar-Robledo, J. R. Aguirre-Ribera, M. Silva-Aparicio, and I. R. Trejo-Vázquez. 2007. Caracterización de remanentes arbóreos y razones de su permanencia en el área del proyecto Pujal-Coy, San Luis Potosí, México. Pp. 85-104 in Corredores biológicos: acercamiento conceptual y experiencias en América (Chassot, O., and C. Morera, eds.). Centro Científico Tropical, Universidad Nacional de Costa Rica/Escuela de Ciencias Geográficas, Instituto Panamericano de Geografía e Historia. Costa Rica. [ Links ]

Rissler, L. J., and J. J. Apodaca. 2007. Adding more ecology into species delimitation: ecological niche models and phylogeography help define cryptic species in the black salamander (Aneides flavipunctatus). Systematic Biology 56:924-942. [ Links ]

SEMARNAT. 2010. NOM-059-SEMARNAT-2010. Protección ambiental-Especies nativas de México de flora y fauna silvestres-Categorías de riesgo y especificaciones para su inclusión, exclusión o cambio-Lista de especies en riesgo. Diario oficial de la federación. Ciudad de México, México. [ Links ]

Tewes, M. E., and R. W. Hughes. 2001. Ocelot management and conservation along transportation corridors in Southern Texas. Pp. 559-564 in Proceedings of the 2001 International Conference on Ecology and Transportation. (Irwin, C. L., P. Garrett, and K. P. McDermott, eds.). Center for Transportation and the Environment, North Carolina State University Keystone, Co. 24-28 September 2001. [ Links ]

Trejo, I., and R. Dirzo. 2000. Deforestation of seasonally dry tropical forest: a national and local analysis in Mexico. Biological Conservation 94:133-142. [ Links ]

Trolle, M., and M. Kery. 2003. Estimation of ocelot density in the Pantanal using capture-recapture analysis of camera-trapping data. Journal of Mammology 84:607-614. [ Links ]

Trolle, M. , and M. Kery. 2005. Camera-trap study of ocelot and other secretive mammals in the northern Pantanal. Mammalia 69:405-412. [ Links ]

Vaughan, C. 1983. A report on dense forest habitat for endangered wildlife species in Costa Rica. National University, Heredia. Costa Rica. [ Links ]

Warren, D. L., R. E. Glor, and M. Turelli. 2009. ENMTools: a toolbox for comparative studies of environmental niche models. Ecography 33: 607-611. [ Links ]

Wilcove, D. S. 1985. Nest depredation in forest tracts and the decline of migratory songbirds. Ecology 66:1211-1214. [ Links ]

Woodroffe, R. 2000. Predators and people; using human densities to interpret declines of large carnivores. Animal Conservation 3:165-173. [ Links ]

Wolf, M., and S. Ale. 2009. Signs at the top: habitat features influencing snow leopard Uncia uncia activity in Sagarmatha National Park, Nepal. Journal of Mammalogy 90: 604-611. [ Links ]

Appendix 1

Information about the ocelot records in Northeastern Mexico. Records obtained from literature are of Martínez-Calderas et al. 2011. Longitude = Long, latitude = Lat, % of cover = Cv , elevation in meters = Ev, degree of the slope = S, Human density = HD, meter to road = mR, meters to towns = mT. SPS: Physiographic Subprovinces LCT = llanura costera de Tamaulipas; LL = llanuras y lomeríos; GSP = Gran Sierra Plegada; SLO = sierras y llanuras occidentales; CH = Carso Huasteco.

Received: June 12, 2015; Revised: August 27, 2015; Accepted: September 03, 2015

*Corresponding author: Jorge Palacio, jpalacio@colpos.mx.

Creative Commons License This is an open-access article distributed under the terms of the Creative Commons Attribution License