


 nueva página del texto (beta)
 Inglés (pdf)
 Artículo en XML
 Referencias del artículo
 Enviar artículo por email
 Citado por SciELO
  Similares en
SciELO
Similares en
SciELO 
 Permalink
Introduction
The Arizona shrew (Sorex arizonae) is one of the most geographically restricted shrews in the world and is currently listed as "least concern" by the IUCN (IUCN 2014). Due to their small size, semifossorial habits, and habitat specialization (Simons and Hoffmeister 2003), the vagility of the Arizona shrew is likely to be low relative to other small mammals and their populations are expected to be highly isolated. In addition, shrews must feed often to maintain their high basal metabolic rates, further restricting their movements between and within habitats (Hanski 1994). Like many other shrews, S. arizonae rarely lives much longer than a year. Spring populations are composed entirely of adults, which die before the next spring and are replaced by young born the previous summer and fall. These ecological and physiological constraints severely limit the ability of S. arizonae to move between suitable habitats and especially to occupy the drier lower elevation habitats that separate areas known to support the species. As a result, we hypothesize that the genetic variation of S. arizonae will be highly structured between mountain ranges harboring the shrew.
The Arizona shrew was described in 1977 (Diersing and Hoffmeister 1977) from ten specimens found in the mountain ranges of southern Arizona. The Arizona shrew is distinguished from other shrews by a well-defined post-mandibular foramen among other differences in dental morphology. S. arizonae inhabits the montane conifer forests and oak-pine woodlands of certain mountain ranges in Arizona, New Mexico, and Mexico. Its range is known to include the higher elevations (above about 1,500 m) of the Chiricahua, Huachuca, and Santa Rita Mountains of southern Arizona, the Animas Mountains of southwestern New Mexico, and the Sierra Madre Occidental of Chihuahua, Mexico. S. arizonae is listed as a species of special concern in Arizona and as endangered in the state of New Mexico and in Mexico (Simons and Hoffmeister 2003).
Montane forest habitats occupied by S. arizonae present discrete ecosystems in which to study populations that, since the end of the Pleistocene, have been isolated by the surrounding lower elevation desert scrub and grassland habitats. These lower elevation habitats are not occupied by S. arizonae. Known as "sky islands", described above, the mountain ranges support a large number of endemic species with limited genetic exchange, including many of the threatened and endangered species in the Southwest (Nishida et al. 1992). Each sky island has a unique topography with horizontal layers of life zones ranging from arid (at the bottom) to boreal (at the top). In Arizona, for example, the Pinalenos Mountains contain the most life zones in the shortest vertical distance of any mountain in North America (Warshall 1986). Several studies of species present on sky islands report varying degrees of genetic differentiation among populations (DeChaine and Martin 2005). These results typically reveal an unusual degree of mtDNA genetic structure as a result of isolation between the different mountain ranges (Masta 2000; Knowles 2001). In addition, a model based on mixing of populations during interglacial expansions of "sky island" ecosystems suggested that glaciations did not inhibit divergence among populations of species having low vagility (Knowles 2001).
In this paper, we measure the genetic variation of S. arizonae populations inhabiting the four mountain ranges known to support the species in the United States using mitochondrial DNA (mtDNA) cytochrome-b sequences. We quantify variation using cytochrome-b because it has been previously shown to be useful in examining phylogeographic patterns in mammals (Avise et al. 1987) and is known to have moderate rates of evolution in a wide range of shrew species with recent divergence times (Fumagalli et al. 1999; Demboski and Cook 2001; 2003; Maldonado et al. 2001; Brant and Orti 2002; Mascheretti et al. 2003; McAliley et al. 2007). Additionally, we used nuclear microsatellite loci to determine the level of genetic differentiation between populations of S. arizonae from the four mountain ranges. Through this effort we seek to elucidate patterns of genetic variation and the phylogenetic status of S. arizonae. Based on this information we provide management recommendations for the species, including directions for further research.
Material and methods
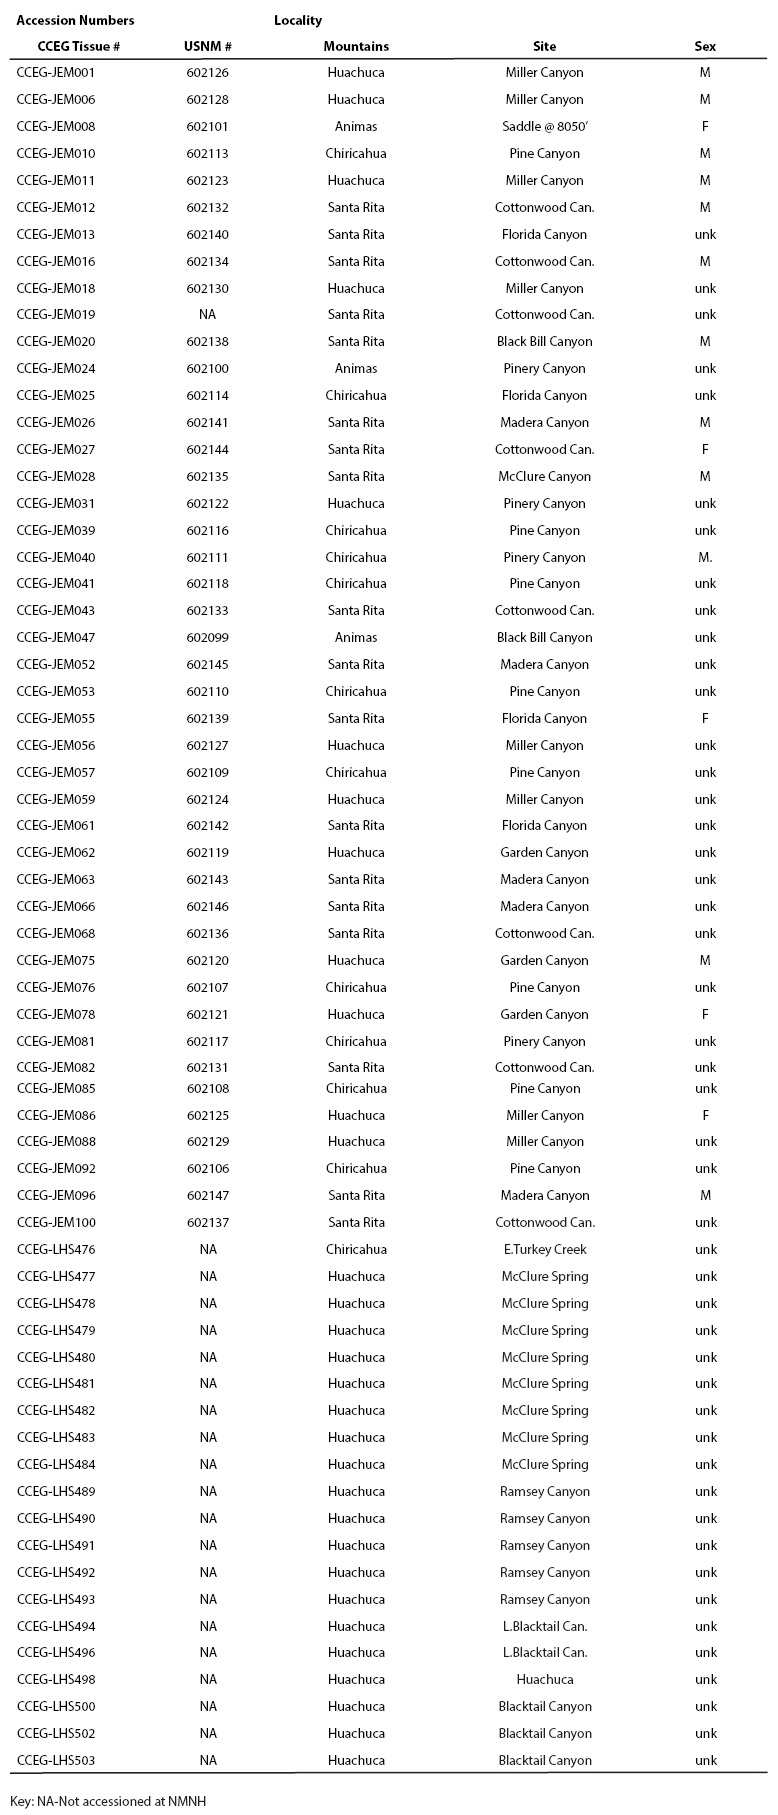
Tissue samples from 64 individuals were obtained from four different mountain ranges in Arizona and New Mexico. Shrews were collected in 1992, 1999, and 2001, using pitfall traps generally set among vegetation, logs, rocks, and/or debris piles (Simons and Van Pelt 1999; Simons and Maldonado 2007). Traps were set at 20 sites in a variety of situations including within and near riparian zones, in canyons, along a ridgeline with seeps, and within a mountaintop saddle. Sixteen sites (80 %) yielded at least one S. arizonae specimen (Animas: 2 of 4 sites; Chiricahua: 4 of 5 sites; Huachuca: 7 of 8 sites; Santa Rita: all of 3 sites). Trap locations varied between 1,745 and 2,675 meters in elevation; captures of S. arizonae occurred from 1,745 to 2,510 meters in elevation. Samples were collected following guidelines approved by the American Society of Mammalogists (Sikes et al. 2011). Tissue samples were obtained from each specimen and stored in ethanol (95 %) at -70 °C. The balance of each of 43 specimens was preserved in ethanol and accessioned at the National Museum of Natural History (USNM) and DNA samples extracted from all 64 individuals used in this study were deposited at the Center for Conservation and Evolutionary Genetics (CCEG) at the Smithsonian Institution (Table 1).
Table 1 Sorex arizonae specimen accession numbers for DNA samples deposited at the Center For Conservation and Evolutionary Genetics (CCEG) and for museum voucher specimens deposited at the National Museum of Natura History (USNM) at the Smithsonian Institution.
DNA Extraction and mtDNA Sequencing. Whole genomic DNA was extracted using the phenol-chloroform method with a final concentration of 1 µg/µL (Sambrook et al. 1989). Initially we utilized two universal primers, LGL765 and LGL766 (Bickham et al. 1995), to amplify the complete cytochrome-b gene of mtDNA of a representative sample from each locality. However, our amplification rates with the larger universal primers were low and worked only in samples with high quality and quantity of DNA. Therefore, we used the larger fragment sequence from a representative sample of Sorex arizonae from each of the four localities to design two internal primers, cytbLshrw (3'-TGG CTC CCT ATG TAT CTG T-5') and cytbHshrw (3'-ATA GCA ACT GCC TTT ATG GGG-5'), that amplify a shorter 249 base pair fragment of the mitochondrial cytochrome-b region. This shorter fragment was capable of capturing sufficient variation to distinguish different haplotypes as it includes the variable region of the left domain of the cytochrome-b that has been previously used for the intraspecific and population level analysis of other North American shrews (Maldonado et al. 2001).
For both primer sets, polymerase chain reactions (PCRs) were performed in a volume of 25 µL with 1.0 unit of AmpliTaq Gold (Applied Biosystems), 1x PCR Buffer, 0.2 mM each dNTP, 0.6 µM each primer, 3 mM MgCl2 and 20 µg BSA. A 10 minute denaturation at 95 °C was used followed by 35 cycles of 94°C for 1 min, 53°C for 1 min, and 72 °C for 1 minute and finally a 10 minute elongation step at 72 °C. PCR products were cleaned using Qiaquick PCR purification columns (Qiagen Inc.) and sequenced using BigDye Terminator V3.1 Cycle Sequencing kit (Applied Biosystems) according to manufacturer's recommendations. Reactions were purified via centrifugation through Sephadex columns (Amersham Biosciences). Sequences were run on the ABI Prism 3100 Genetic Analyzer and edited in Sequencher 4.1 (Gene Codes Corporation, Inc.).
Microsatellite genotyping. Twelve dinucleotide microsatellite loci were amplified for the species. We used six polymorphic microsatellite loci designed specifically for S. arizonae (Ortega et al. 2005). PCR conditions consisted of an initial denaturation at 95 °C for 10 min, followed by 30 cycles at 94 °C for 30s, original annealing temperature for each primer (Ortega et al. 2005) for 45s and 72 °C for 45s, and a final extension of 72 °C for 10 min. All reactions were performed in a Perkin Elmer 9700 Thermalcycler. Amplifications of microsatellites were carried out in a 15 µL volume containing 30 ng of DNA, 0.2 µM of each primer, 0.2 µM of dNTPs, 1x Taq buffer (1.5 µM MgCl2, 10 mM Tris-HCl, 50 mM KCl), and 0.75 U of Taq polymerase. Analysis was performed on an ABI Prism 3100 Genetic Analyzer. Analysis of computer-generated results was executed using GeneScan (version 2.1) software, and final allele-sizing was done with the ABI Genotyper package (version 2.1). Additionally, we used six loci originally isolated in S. ornatus (Maldonado et al. 2006). PCR reactions were performed in a volume of 25 µL with 1.0 unit of AmpliTaq (Applied Biosystems), 1x PCR Buffer, 0.2 mM each dNTP, 0.6 µM each primer, and 3 mM MgCl2. A 5 minute denaturation at 95 °C was used followed by 30 cycles of 94 °C for 1 min, 54-56 °C for 1 min, and 72 °C for 1 min and finally a 10 min elongation step at 72 °C.
Analyses of mtDNA sequence data. For alignment of all mtDNA sequences, the computer program SEQUENCHER 4.1 (Gene Codes Corp.) was utilized and then each sequence was inspected by eye and checked for the presence of stop codons to detect pseudogenes. The resulting multiple sequence alignment was imported into the computer program MacClade (Madison and Madison 2000) to identify variable nucleotide positions. Genetic divergence among haplotypes was estimated using the Tamura and Nei (1993) distance with the computer program PAUP* 4.0 (Swofford 2001).
Cytochrome-b sequences generated using the 249 bp fragment were aligned and compared among the 64 S. arizonae samples. The resulting haplotypes were utilized to generate a statistical parsimony haplotype network using TCS 1.21 (Clement et al. 2000) to visualize potential regional mtDNA structure. TCS calculates the number of mutational steps among all pairs of haplotypes and then joins the most similar haplotypes together into a network where their combined probability is .95%. Genetic variability within populations was estimated in terms of haplotypic (h) and nucleotide (π) diversity, as implemented in the program ARLEQUIN 2.000 (Schneider et al. 2000). We used the analysis of molecular variance (AMOVA; Excoffier et al. 1992) to investigate the proportion of total genetic variation within and among described populations. We calculated 𝐹 𝑆𝑇 statistics based on corrected sequence distances among haplotypes. We generated pairwise genetic distances to calculate fixation indices ( 𝐹 𝑆𝑇 ) between all population pairs. Statistical significance was ascertained by conducting 10,000 permutations in the software ARLEQUIN 2.000.
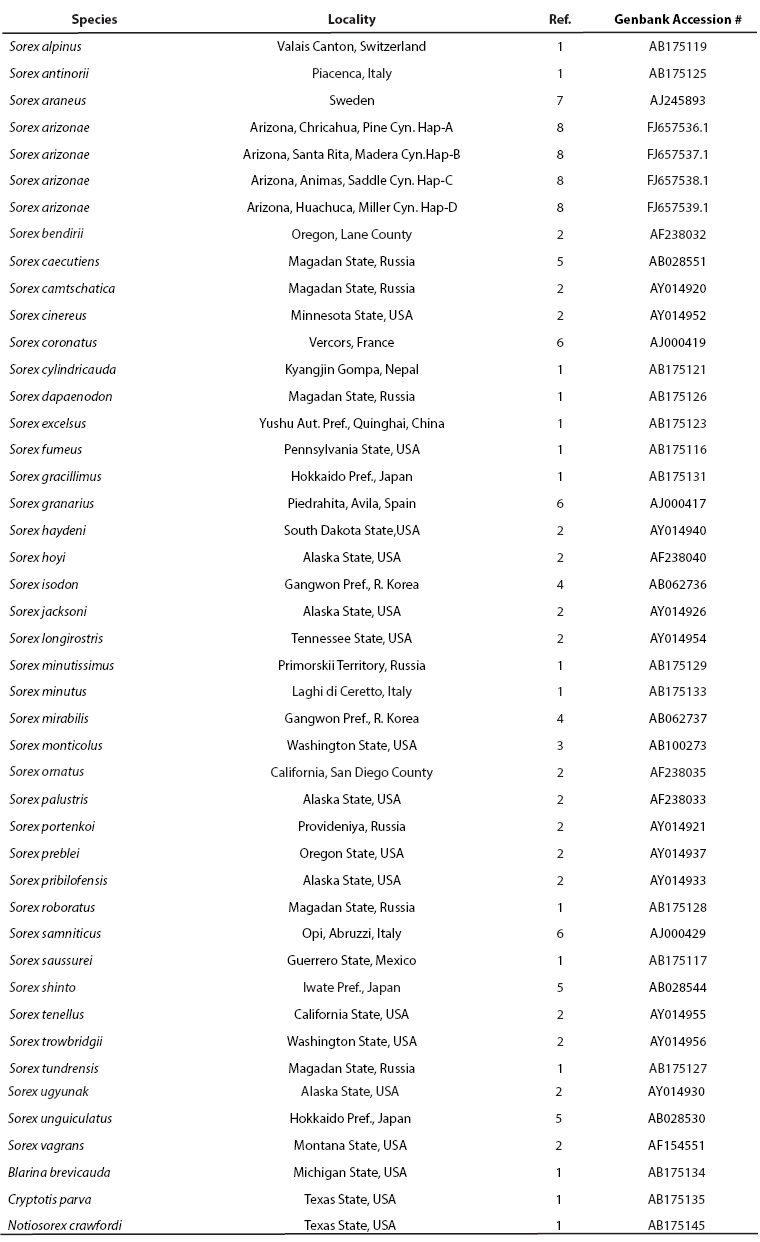
To examine the phylogenetic status of S. arizonae, we obtained a 1,118 bp fragment of the cytochrome-b from each representative haplotype from each of the four localities. The S. arizonae sequences were aligned and compared with sequences from 38 other Sorex species (Ohdachi et al. 1997, 2001, 2006; Fumagalli et al. 1999; Demboski and Cook 2001, 2003; Maldonado et al. 2001; Brant and Orti 2002; Mascheretti et al. 2003; Sipe and Browne 2004; Stewart et al. in litt.). We aligned our Sorex sequences with two short-tailed shrews (Blarina and Cryptotis; Brant and Orti 2002) and a desert shrew (Notiosorex crawfordi) that were used as outgroups (Ohdachi et al. 2006). Genbank accession numbers for all of the sequences used in the phylogenetic analysis comparing S. arizonae to other shrew species are listed in Table 2.
Table 2 Genbank accession numbers for Cytochrome -b sequences used in phylogenetic analysis.
References 1 Ohdachi et al. 2006.
3 Shinohara and Suzuki 3002 (published in database only).
8. This study.
In order to evaluate the appropriate model of molecular evolution for our cytochrome-b sequences we used the program JModeltest v2.1.4 (Darriba et al. 2012). The model selected for all codon positions was GTR + I + G based on the corrected Akaike information criterion. Bayesian posterior probabilities were determined using MrBayes 3.2.1 and were used to place confident limits on tree branches (Ronquist and Huelsenbeck 2003). The Bayesian analysis was run using 5,000,000 generations along four chains with two replicates at a temperature of 0.05. The convergence between the two replicates run in MrBayes was assessed by the average standard deviation of split frequencies (ASDSF) between runs. After 5,000,000 generations, the ASDSF was 0.003. Sample frequency was set to 1000 with a burn-in of 1,250.
Analyses of Microsatellite data. For microsatellite data, allelic frequencies, F statistics (Weir and Cockerham 1984), RST (Rousset 1996), Hardy-Weinberg equilibrium, and genotypic disequilibrium among all loci pairs, as well as expected and observed heterozygosity were estimated using the software program GENEPOP 3.1b (Raymond and Rousset 1995). Sequential Bonferroni corrections (Rice 1989) were made to avoid type I errors.
To examine levels of genetic divergence using microsatellite data, POPULATIONS Version 1.2.28 (O. Langella, Centre National de la Recherche Scientifique, Laboratoire Populations, Génétique et Evolution, Gif sur Yvette; HYPERLINK "http://www.cnrs-gif.fr/pge/bioinfo/populations") was used to generate a Nei's standard genetic distance matrix (Saitou and Nei 1987).
To determine the degree of population genetic structure, the program STRUCTURE Version 2 (Pritchard et al. 2000) was used. This program uses Bayesian analysis to cluster individuals into subpopulations (K) with no prior information as to known populations. In this case, 100,000 MCMC repetitions following a 100,000 burn-in period were used. We allowed the value of K to vary between 1 and 10 and performed 10 independent runs for each value of K. An admixture model was used and correlated allele frequencies were assumed. The mean posterior probability was calculated for each set of ten runs of K and used to determine an optimal K. We also used the ΔK method (Evanno et al. 2005) based on the second-order rate of change in the log Pr(X|K), implemented in the program Structure Harvester (Earl and von Holdt 2012). Two monomorphic loci (A3-26 and 1S) were removed from the dataset for all of the analyses.
Results
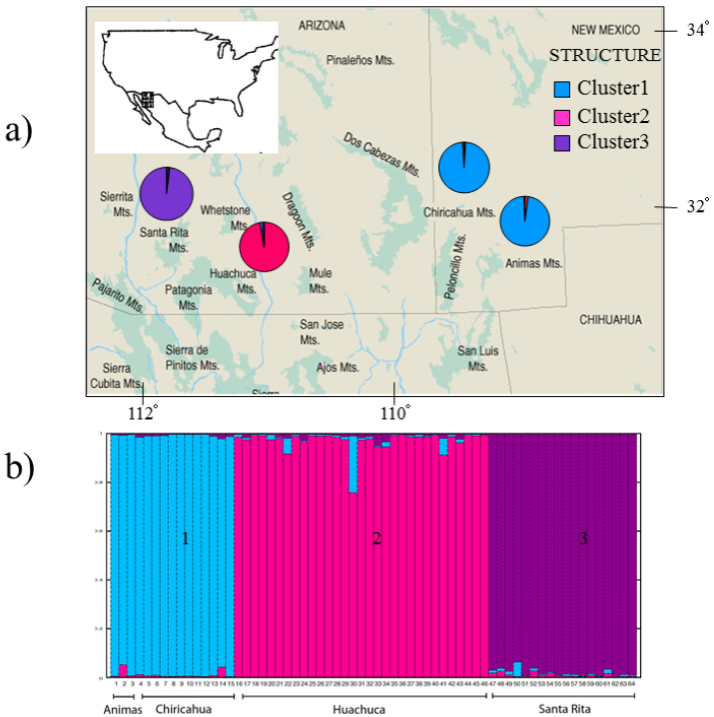
Mitochondrial DNA analysis. A 249 bp fragment of the variable region of the left domain of the cytochrome-b gene was compared between 64 Arizona shrews. Four different haplotypes were identified differing by one to three base pairs (Table 3). Haplotype A was the most common, and it was found in a total of 57 individuals from three populations (Santa Rita, Huachuca, Chiricahua). Haplotype B was found in only two individuals from the Chiricahua population. Haplotype C was restricted to all three individuals from Animas population and, finally, haplotype D was found in two individuals restricted to the Huachuca population (Figure 1a).
Table 3 The four mitochondrial cytochrome-b haplotypes detected in 64 S. arizonae including nucleotide changes in 249 bp fragment. GenBank accession numbers are provided.
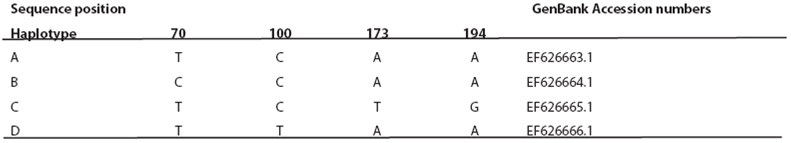
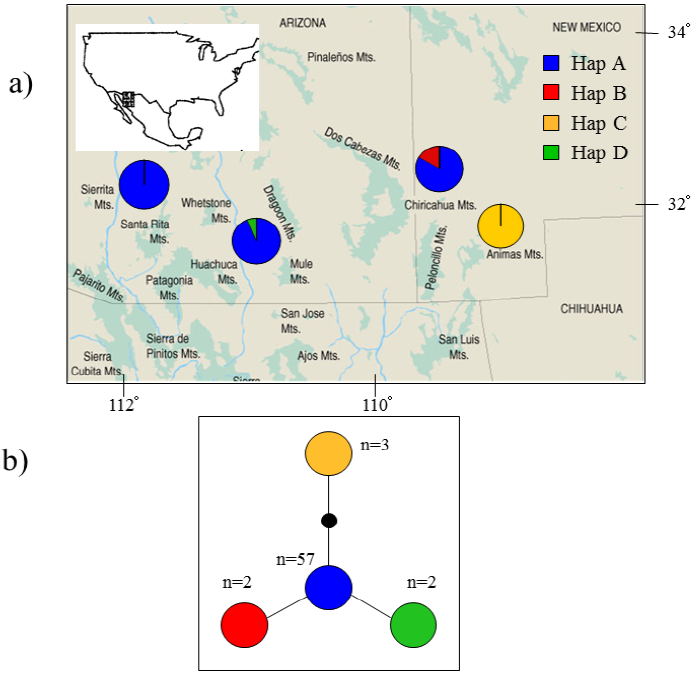
Figure 1 a) Map of the sampling locations of each population in Arizona and New Mexico (Marshall 1957), including the mtDNA haplotype frequencies for each site. b) Cytochrome-b minimum-spanning network based on 249 base pairs (bp) for the four representative haplotypes. Each node represents a1-bp change.
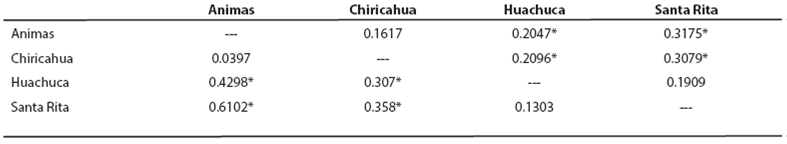
Haplotype diversity values (h) ranged from zero in the Santa Rita Mountains, where only one haplotype was recorded, to 0.32 in the Huachuca Mountains. Nucleotide diversity values (π) ranged from 0.03 to 0.15, indicating close relationship among haplotypes (Table 4). Hierarchical analysis of mtDNA variation revealed that 54.3 % of the genetic variation was attributable to differences among individuals within regions, whereas 45.7 % of the variation was partitioned among regions. When analyzed in a pairwise fashion, comparisons revealed some statistically significant 𝐹 𝑆𝑇 values (P < 0.05; Table 5). Santa Rita and Huachuca populations showed a non-significant difference, but both were significantly different from the Animas and Chiricahua populations.
Table 4 Haplotype (h) and nucleotide diversity (π) along with their respective standard error (SE) for the four geographic populations.
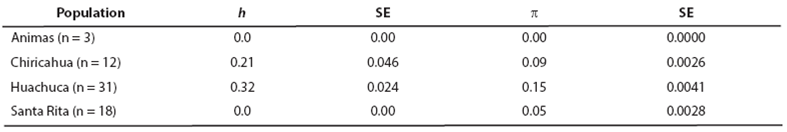
Table 5 Pairwise comparison of genetic differentiation among the four geographic populations. Values above diagonal are 𝐹 𝑆𝑇 -values based on DNA sequence variation of mtDNA cytochrome-b. Values below the diagonal are Rst-values based on microsatellite data. Numbers denoted by an asterisk (*) are significantly different from 0 (P < 0.05).
A hierarchical AMOVA analysis was performed to detect population genetic structure. For the four defined sites, 21.7 % of the variation was detected among groups, 37.5 % of the variation was partitioned among populations within groups, and 40.8 % of the variation was partitioned within populations.
mtDNA haplotypes separated by several mutational steps have a > 0.95 probability of being connected in a parsimonious way. Within this network, we found no ambiguous haplotype connections and haplotypes only differed by one or two mutations for a total of four substitutions (Table 3). All groups showed no ambiguities, were well resolved, and showed a star-shaped pattern (Figure 1b). Although the analysis did not incorporate geographic distance between sites, it revealed important associations among haplotype A with Santa Rita, Huachuca, and Chiricahua sites, while haplotype C in Animas is a unique haplotype in an exclusive site.
The Bayesian tree based on the 1,118 bp fragment of the cytochrome-b gene demonstrated support values ranging from 64 to 100 % for the nodes and the position of S. arizonae was well resolved (Figure 2). The four haplotypes of S. arizonae formed a monophyletic group that is closely related to S. trowbridgii (BI = 0.99) and S. sausseri (BI = 0.83). The overall tree topology supports the hypothesis originally generated from allozyme data (George 1988) that three major groupings can be detected in shrews of the genus Sorex and does not support classification based primarily on dental characters by Carraway (2007) that S. arizonae should be classified within the subgenus Sorex. Members of the Paleartic subgenus Sorex form a monophyletic group, and members of the Nearctic subgenus Otisorex form two monophyletic clades. One clade (clade B)includes the Nearctic species S. trowbridgii and S. arizonae, which are sister to S. saussurei. In general, the long-branch lengths and high Bayesian posterior probabilities for the node that clusters S. arizonae haplotypes as a monophyletic group in the tree are consistent with the hypothesis that this is a well defined species with a long evolutionary trajectory.
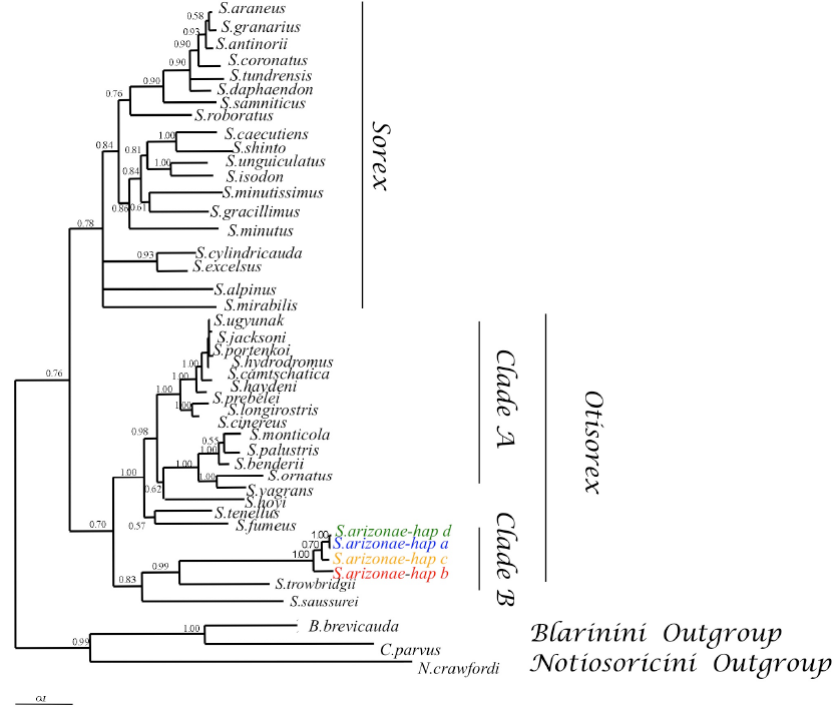
Figure 2 Phylogenetic tree based on Bayesian inference, depicting cytochrome-b relationships of the four S. arizonae haplotypes compared with GenBank deposited sequences from 38 other Sorex species. We aligned Sorex sequences with a short-tailed shrew (Blarina), small eared-shrew (Cryptotis), and a desert shrew (Notiosorex crawfordi) that were used as outgroups. Numbers designate nodes supported by Bayesian posterior probabilities. The three major clades are denoted on the right-hand side of the tree.
Microsatellite analysis. Tests for Hardy-Weinberg equilibrium (HWE) showed that all populations were in equilibrium after Bonferroni correction. In addition, none of the tests for linkage disequilibrium were significant at the 0.05 level with a sequential Bonferroni correction.
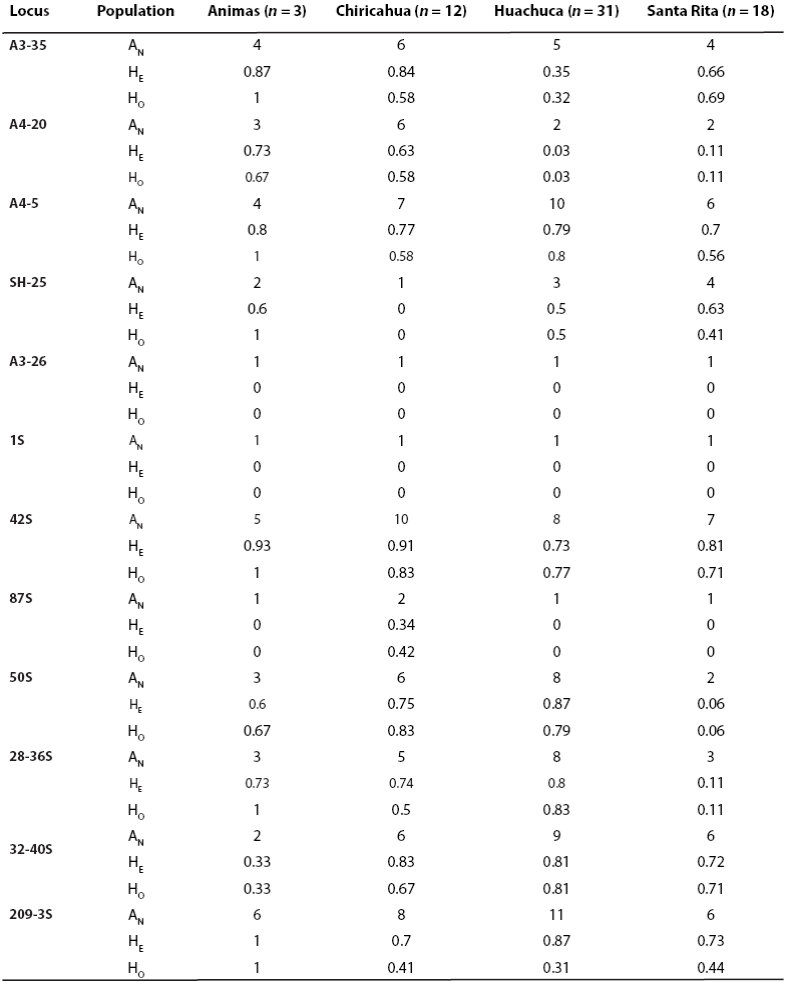
Population pairwise RST values exhibited low to high levels of genetic differentiation (0.03 - 0.6). Four population pairwise RST comparisons indicated significant genetic differentiation between Santa Rita and Huachuca shrews compared to Animas and also to Chiricahua populations. These data also suggest that moderate levels of differentiation, although not significant, exist between the Santa Rita and Huachuca and between Animas and Huachuca populations (Table 5). Heterozygosity levels ranged from 0.9 in locus A3 - 35 and locus 42S, to 0.0 in two monomorphic loci A3 - 36 and 1S (Table 6). Genetic diversity levels are highly variable across loci; expected heterozygosity is about equal for the four populations. We did not observed any microsatellite loci that were out of Hardy-Weinberg equilibrium, nor did we report linkage disequilibrium in any population. We detected that a high levels of population admixture has occurred between the Animas and the Chiricahua populations, but not among the rest of the populations. This was reflected in different genotypic frequencies and high levels of private alleles. An analysis of allele frequency distribution reveals that a large number of alleles are not shared among populations: 5, 14, 20, and 6 private (unique) alleles are found in the Animas, Chiricahua, Huachuca, and Santa Rita populations, respectively.
Table 6 Descriptive statistics for each locus for each population including number of alleles (AN), expected heterozygosity (HE), and observed heterozygosity (HO).
Clear population genetic structure was detected using the Bayesian cluster approach; the STRUCTURE program suggested that the sampled S. arizonae most likely represent three well-defined groups. The probability of the data was highest for K = 3; these population clusters were identified without any population locality prior information. All of the individuals sampled from the Animas and Chiricahua populations fell within a single cluster, while individuals from Huachuca and Santa Rita were assigned to two distinct clusters (Figure 3). There was very little evidence of admixture among the three defined clusters.
Discussion
The Arizona shrew is restricted to mountain ranges of southeastern Arizona, southwestern New Mexico, and northern Mexico. Only a few specimens of Arizona shrew have been collected due to their restricted difficult to access range, specialized habitat preferences, and elusive behavior. Until recently, information about the species' biology was scarce and based on only a few specimens (Diersing and Hoffmeister 1977). In recent decades however, additional field surveys have improved our understanding of this poorly known shrew (Simons et al. 1990; Simons and Van Pelt 1999). The present study represents the largest sampling of S. arizonae to date (see also Simons and Maldonado 2007). Our work suggests that S. arizonae remains well distributed and relatively abundant within its restricted and fragmented range in Arizona and New Mexico, particularly in many riparian zones and upland areas, including some ridgelines and mountaintop saddles with sufficient moisture, vegetation, and soil development to provide cover and a food base for shrews.
Phylogenetic status of Sorex arizonae. In terms of the phylogenetic position of these shrews with respect to other Nearctic and Eurasian shrews, our data supports the close affinity of S. arizonae to S. trowbridgii from Western North America and S. saussurei from Central Mexico.
Sorex trowbridgii shows some similarities with S. arizonae (George 1989), and it should be noted that the distribution of these species does not overlap; together they form part of a unique radiation of Sorex in North America. Our results suggest that S. arizonae may represent an earlier radiation with disjunct refugial populations now persisting in the mountains of southeastern Arizona, southwestern New Mexico, and northern Mexico.
Before 1977, all dark shrews from higher elevations in southern Arizona were thought to be S. monticola or S. vagrans. S. arizonae was unrecognized because it shares some external features with the other widely distributed shrews. Relationships among these species have been difficult to assess, with several different classifications proposed based on morphology (Diersing and Hoffmeister 1977). However, S. arizonae is distinguished based on a unique combination of cranial and dental features (Junge and Hoffmann 1981; Simons and Hoffmeister 2003). Moreover, our phylogenetic analysis of mtDNA data shows that S. arizonae is a well-defined species with a clear genetic from both S. monticola and S. vagrans. Our analysis placed S. arizonae in a well supported clade with S. trowbridgii and S. saussurei in a clade, separate from other North America shrews that are also considered to be members of the subgenus Otisorex (Figure 2). This enigmatic clade was previously suggested by allozyme analysis by George (1988) to be part of a distinct yet unnamed subgenus, however, these conclusions were discordant with the conclusions of other more recent molecular studies (Fumagalli et al. 1999; Ohdachi et al. 2006) that divided the genus Sorex into two monophyletic groups: the subgenus Sorex, with a primarily Palearctic distribution, and the subgenus Otisorex, distributed chiefly throughout the New World. This clade was considered as a sister group to Otisorex and did not support the validity of a third subgenus. Furthermore, a more recent study that examined the phylogenetic relationships of Sorex from Mexico and Guatemala (Esteva et al. 2010) also reported that several middle American species of shrews (S. saussurei, S. veracrucis, S. macrodon and S. veraepacis) formed a second major clade in the subgenus Otisorex (Clade B in Esteva et al. 2010) and were also included with S. trowbridgii and appeared to represent an early split of North American soricine shrews. This study dated the diversification of this clade to the late Miocene and only had members of Clade B extending beyond the Isthmus of Tehuantepec. Our study suggests that as member of the S. trowbridgii-sausseri clade, S. arizonae was also part of this older wave of diversification into southern Mexico.
Population structure of Sorex arizonae. Our molecular genetic data provides insight into the population structure of S. arizonae. Animas and Chiricahua populations form a single cluster which suggests that there has been gene flow in the recent past. However, with the exception of these two populations, all other individuals from the Santa Rita and Huachuca populations, were assigned with highest likelihood to inferred populations in the STRUCTURE analysis. This analysis coupled with 𝐹 𝑆𝑇 and RST statistics indicate a highly significant nuclear differentiation between shrews from the Santa Rita and Huachuca mountains with those in the Chiricahua and Animas Mountains. The difference in patterns between mtDNA and microsatellite markers may be due to the fact that mtDNA shows a historical pattern with perhaps more gene flow between the Arizona populations in the past while microsatellites reveal events which could be correlated with changes in recent habitat connectivity.
Genetic differentiation between populations of S. arizonae is explained by the existence of isolated mountain habitats separated by lowland arid areas inhospitable for these shrews. Although S. arizonae is restricted to the higher parts of these mountains (e. g. pine-oak woodland; Marshall 1957), our extensive field surveys suggest that S. arizonae remains well distributed within its restricted and fragmented range, and reasonably abundant within quality habitat. A restricted range and low vagility presumably facilitate population isolation between localities, promoting the development of significant genetic structure among populations. Environmental and geographical factors presumably accelerate genetic differentiation among the three subpopulations. However, details of this isolation, such as the stability of isolating mechanisms through time, remains to be understood.
The microsatellite data suggest that recent gene flow among S. arizonae populations is quite limited amongst most of the populations, however, cytochrome-b sequences show that there is a widely distributed haplotype (A) among three populations, and therefore, warrant further research based on larger sample sizes and knowledge of dispersal rates that have been inferred in other shrew species (Mascheretti et al. 2003).
Sorex arizonae's distribution should be assessed more widely in the United States and particularly in northern Mexico, where only a single individual has been reported and the distribution of the species remains to be established (Simons and Val Pelt 1999). Based on the species' known habitat requirements and mtDNA differences indicated in this paper, genetic differentiation can be detected between Arizona and New Mexico. However, nuclear microsatellite differentiation among S. arizonae is also marked between the three Arizona subpopulations.
Overall, haplotype A was the most widely dispersed as it was found in three of four mountain ranges (Chiricahua, Huachuca, and Santa Rita). From these localities, the Huachuca population has only two haplotypes, the most private alleles, and greater nucleotide diversity and was generally the most variable with respect to measures of microsatellite variation. The Chiricahua and Santa Rita populations demonstrated intermediate levels of variation. In contrast, the Animas population presented one unique haplotype, the least number of private alleles, and moderate nucleotide diversity. Note, however, that the Animas population also had the smallest sample size in this study by far.
Finally, Arizona shrews demonstrated less genetic diversity at mtDNA and/or microsatellite loci than ornate shrews (S. ornatus; Maldonado et al. 2001, 2004, 2006), masked shrew (S. cinereus; Sipe and Browne 2004), smoky shrew (S. fumeus; Sipe and Browne 2004), and dusky shrew (S. monticola; Demboski and Cook 2001).
Conservation and management implications. Our results have implications for the conservation and management of the Arizona shrew. S. arizonae is arguably one of the most threatened small mammals in southern Arizona, southern New Mexico, and northern Mexico (Warshall 1986). It is thought to be threatened primarily by destruction of its habitat. In Mexico, the shrew is listed as an endangered species and; however, throughout its distributional range is considered least concern (Woodman et al. 2008). The one location known to support the species in Chihuahua Mexico was reportedly logged and its habitat possibly destroyed sometime after the single specimen was discovered (Hoffmeister 1986). In the United States, field assessments suggest that the shrew is restricted to patchy habitats along riparian zones and other well-vegetated areas. This situation suggests that populations may have a high probability of local extinction, particularly if movement corridors are limited.
Sorex arizonae can be reasonably common in high-quality habitat, but these areas are restricted within the desert sky islands where the species occurs (Simons and Maldonado 2007). Furthermore, signatures of recent gene flow were revealed with microsatellite markers between the Animas and Chiricahua populations and, therefore, additional research is needed to assess the extent to which shrews move between the relatively discrete patches of high-quality habitat.
Our data indicate that Arizona and New Mexico populations of S. arizonae form three distinct clusters representing independent evolutionary trajectory. We consider each cluster a management unit (MU) because they differ in allele frequencies and haplotype diversity (Moritz 1994). These MU's may respond differently to environmental changes and should be managed as separate units for conservation.
Levels of genetic variability observed in S. arizonae populations were low (mtDNA) to moderate (microsatellite). A single mtDNA haplotype was fixed in the New Mexico population and this population also displayed a lower mean heterozygosity at microsatellite loci compared with the other populations. In general, only four mtDNA haplotypes were reported; nucleotide diversity was also moderate to low (Table 4). We suggest that the moderate variability indicated by the set of microsatellite loci designed for S. ornatus that we used in our analysis may be at least partially a consequence of applying heterologous markers. Other studies have demonstrated that the use of heterologous markers can reveal artificially high genetic variability in other species (Hellborg et al. 2002). We speculate that S. arizonae populations have lower levels of genetic diversity than it appears based on the microsatellite markers given that 5 of the 12 markers we used were designed for another species (S. ornatus). The remaining markers used were specifically designed for S. arizonae (Ortega et al. 2005).
Sky islands can be considered Pleistocene refugia and isolation of the populations may have occurred in the past (Masta 2000). Collaborative efforts between federal governmental agencies are urgently needed to protect sky island ecosystems, including populations of S. arizonae. This is particularly relevant now due to the potential impacts of the rapid anthropogenic induced climatic fluctuations on montane species. If shifts in temperature take place faster than the vegetation responses, or occur beyond the boundaries of suitable potential vegetation, then high elevation populations could be forced into areas of marginal habitat where they are likely to experience decreased survival and reproduction (Crick 2004).
Before we can provide management recommendations, additional research should focus on the Animas (New Mexico) population, which displayed relatively low levels of microsatellite variation and no haplotype variation at the mitochondrial level. Although we expended more sample effort in the Animas range than anywhere else, we obtained only three specimens. This suggests that the Animas population may be smaller and more restricted than in other mountain ranges. Due to its ecological and evolutionary significance, more shrews from this mountain range are needed to better characterize population-genetic processes.
In this study, we have provided baseline data on both the nuclear and mtDNA genetic variation of the Arizona shrew. Additional well-designed inventory monitoring throughout the range of this species, linked to genetic analyses, particularly in New Mexico and northern Mexico, are needed to understand the status and conservation needs of this unique and elusive species.

